Автор: Клод, Deep Tide TechFlow
Введение от Deep Tide: Отчет Nomura от 11 мая бросил ключевое утверждение: "По крайней мере, для американского рынка акций, AI-ралли, возможно, делает паузу для передышки." В тот же день KOSPI взлетел на 4.32% до 7822.24 пунктов, на внутридневной торговле сработал buy-sidecar, акции SK Hynix выросли на 11.98%, а рыночная капитализация компании впервые превзошла Eli Lilly, заняв 14-е место в мире. Прогноз отчета о "следующем этапе, смотря на FOMO в Южной Корее" практически совпал по времени с резким скачком корейского рынка. Движущая сила AI-трейда на американском рынке переключается с "выдавливания коротких позиций" на "FOMO розничных инвесторов".
AI-ралли на американском рынке не закончилось. S&P 500 вырос примерно на 16.6% за 28 торговых сессий, но источники денег, поднявших индекс, и оставшееся топливо для роста демонстрируют тонкие изменения. Nomura дает следующий вывод: этап, подталкиваемый покрытием коротких позиций и пополнением позиций институционалами, подходит к концу; если AI-трейд должен продолжиться, нужна новая волна притока капитала. Корейский рынок как раз в день публикации отчета дал образец: KOSPI преодолел три уровня — 7000, 7400 и 7800 — за неделю, розничные инвесторы погрузились в "hynix FOMO", иностранный капитал через DRAM ETF сконцентрированно увеличивал позиции в чип-акциях. Нарратив смещается с Nasdaq на KOSPI.
Американский рынок выглядит обычным, но "рост спотовой цены / рост волатильности" уже сигнализирует
Внешние показатели AI-трейда на американском рынке все еще горячие. Дайджест опционов Saxo от 11 мая показывает, что VIX закрылся на уровне 17.19, вырос на 0.64% за день. Сам по себе этот показатель ниже исторического среднего, но факт роста VIX на фоне рекордных максимумов индекса сам по себе является аномальным сигналом. Индекс CBOE SKEW вырос до 138.21 (+1.54%), VVIX, измеряющий волатильность VIX, поднялся до 96.78 (+3.39%). Одновременный рост всех трех показателей говорит о том, что институциональные инвесторы не снимают хеджирование на фоне обновления максимумов индексами.
Nomura в отчете от 11 мая описывает эту комбинацию как "аномальную ситуацию" для американских технологических акций. В отчете говорится, что Nasdaq демонстрирует комбинацию "рост спотовой цены и рост волатильности", при этом VIX продолжает снижаться, а VXN (волатильность Nasdaq) заметно восстановился; опционный скос (разница между подразумеваемой волатильностью 25-delta пута и колла с месячным сроком) для американских технологических акций быстро упал почти до исторических минимумов, вернувшись к уровню примерно октября 2025 года. Падение скоса означает, что премия за защиту путом относительно коллов снижается, рынок становится более переполненным в ценообразовании роста технологических акций.
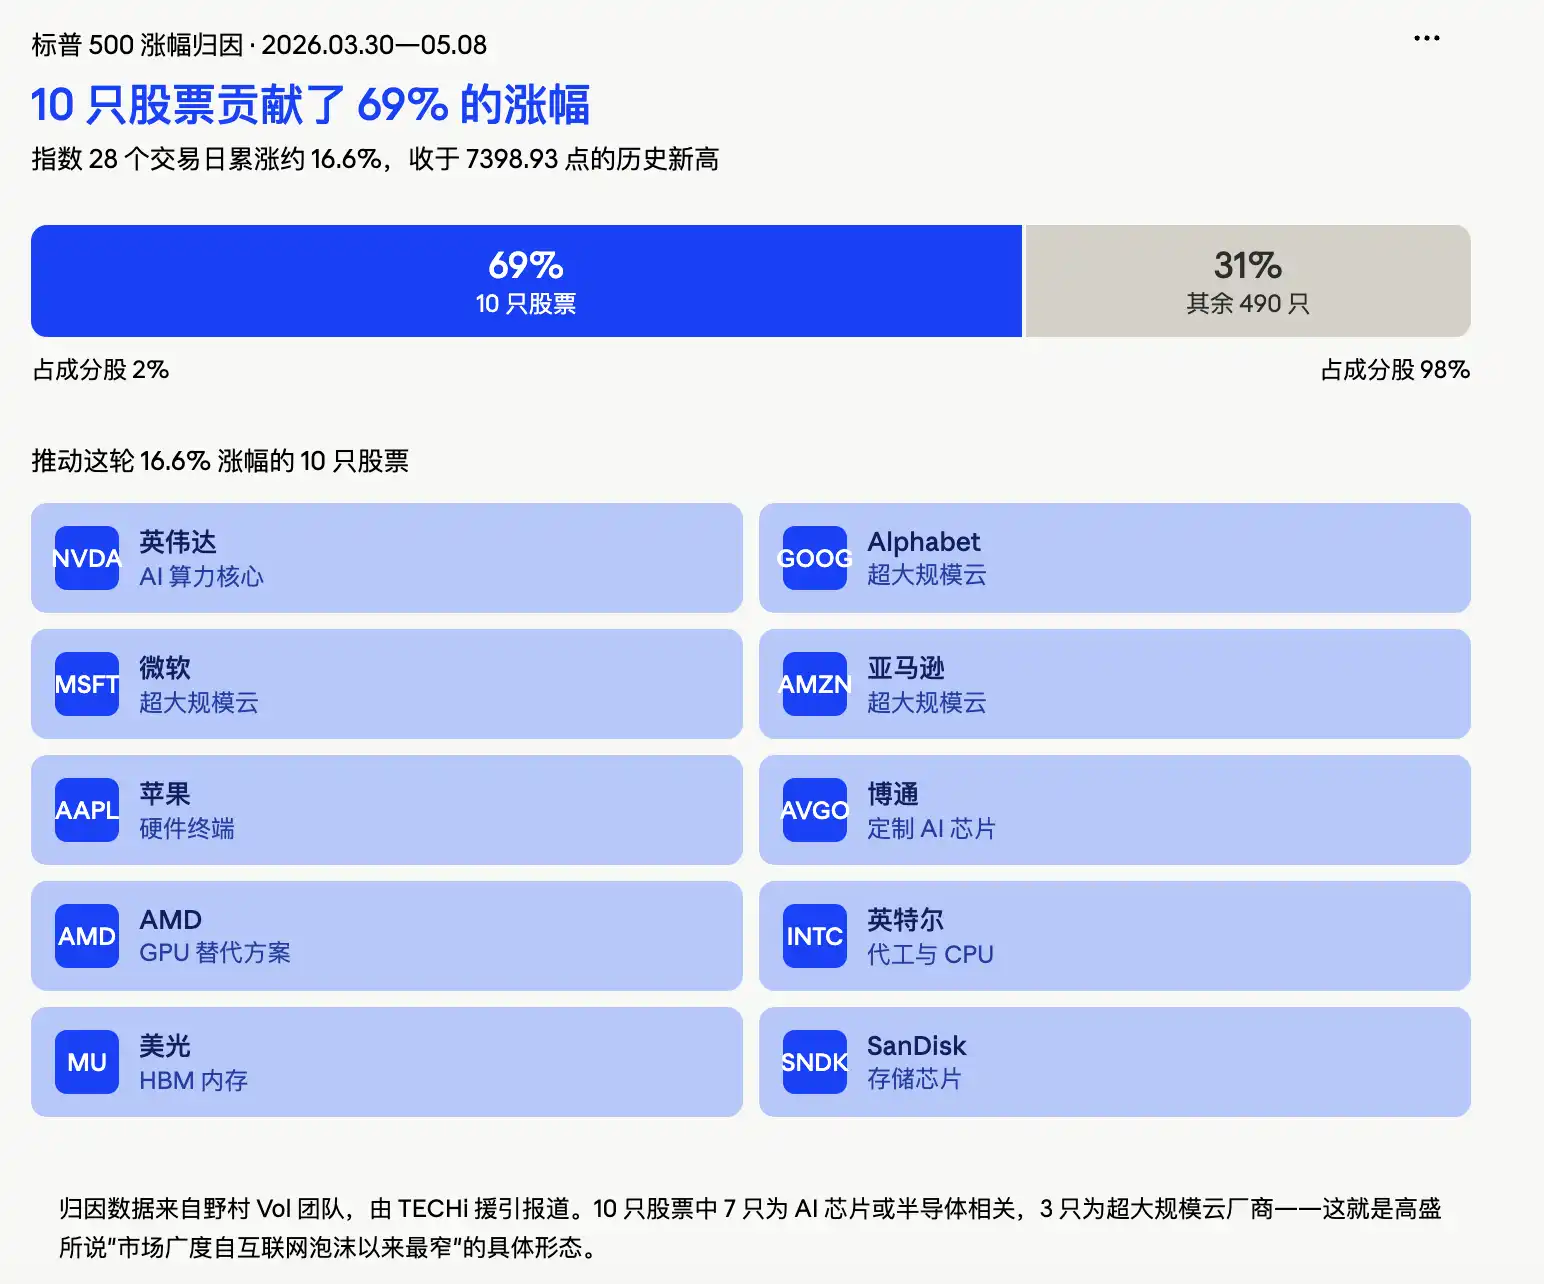
Более важна структура этого роста. Согласно графику декомпозиции доходности от команды Vol Nomura, на который ссылается TECHi, из примерно 16% роста S&P 500 с 30 марта 10 акций внесли вклад в 69%: Alphabet, Nvidia, Amazon, Broadcom, Intel, Micron, Apple, AMD, Microsoft, SanDisk. Остальные 490 компонентов внесли лишь 31%. Бен Снайдер, глава отдела стратегии по акциям США в Goldman Sachs, также отмечает, что ширина рынка (market breadth) снизилась до одного из самых узких уровней со времен пузыря доткомов. "Большое строительство AI" и "конфликт с Ираном" указаны Goldman Sachs как два самых четких риска для рынка на ближайшие недели.
Короткие позиции уже выдавили. Кто подтолкнет следующий этап?
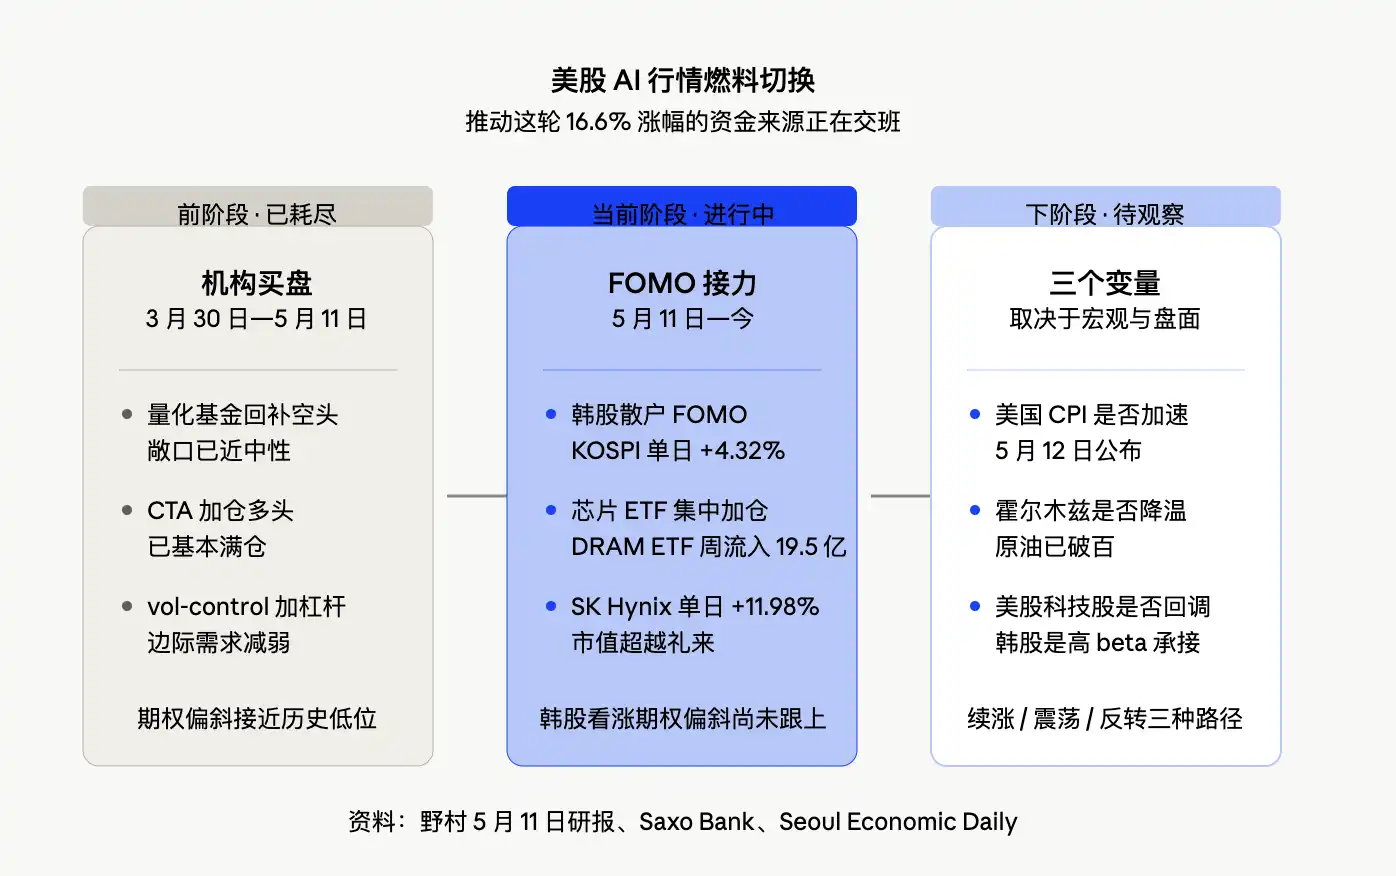
Настоящий убийственный вывод в отчете Nomura не в самой "аномальной комбинации", а в анализе денежных потоков: рыночная экспозиция количественных фондов восстановилась почти до нейтральной, процесс вынужденной покупки и покрытия коротких позиций в основном завершен. Фонды CTA (Commodity Trading Advisors) практически вернулись к полным длинным позициям, а предельный спрос на увеличение позиций со стороны стратегий управления волатильностью также ослабевает.
Другими словами, три основные движущие силы покупок, подталкивавшие AI-акции в последние недели — выдавливание коротких позиций, увеличение позиций CTA и увеличение кредитного плеча стратегиями vol-control на фоне снижения волатильности — сейчас приближаются к своему пределу. Если AI-акции продолжат расти, больше нельзя полагаться в основном на силу "покупок, вызванных выдавливанием коротких".
Важно отметить, что оценки Nomura позиций количественных фондов, CTA, макрофондов и других основаны на модельных расчетах, а не на фактических данных о позициях. Это означает, что они лучше подходят в качестве индикатора маржинальных изменений, а не точной таблицы позиций. Тем не менее, направление ясно: программируемый спрос на покупки со стороны институционалов приблизился к пределу, дальнейший импульс роста должен больше зависеть от розничных инвесторов и эмоционально обусловленных денег.
Торговая площадка Goldman Sachs в значительной степени согласна с выводами Nomura. Рич Привороцкий, руководитель торговой площадки One-Delta в Goldman Sachs, ранее охарактеризовал текущий темп как "полуиррациональную гонку за ростом", приведя в пример 1999 год, когда переполненные заказы на телекоммуникационное оборудование обеспечили "нарратив реальных узких мест", схожий с логикой дефицита вычислительных мощностей для AI сегодня. Торговая площадка по волатильности Goldman Sachs охарактеризовала недавний период как динамику "рост спотовых цен, рост волатильности", которая ограничивает пространство для дальнейшего наращивания позиций системными стратегиями.
Этот вывод означает, что AI-трейд на американском рынке не рухнул, но сценарий "продолжения роста за счет выдавливания коротких позиций" подходит к концу.
Корейский рынок дает ответ: в день публикации отчета Nomura KOSPI вырос на 4.32%, сработал buy-sidecar
Другой вывод в отчете Nomura: если AI-трейду сужден еще один этап, истинным сигналом продолжения роста будет появление FOMO в Южной Корее.
В день публикации отчета корейский рынок ответил экстремальным всплеском. KOSPI закрылся на отметке 7822.24 пункта, вырос на 4.32% за день, в ходе торгов достиг 7899.32 пункта, сработал buy-side sidecar. Акции SK Hynix выросли на 11.98% до 1.888 млн вон, рыночная капитализация компании впервые превзошла Eli Lilly, заняв 14-е место в мире; Samsung Electronics выросли на 6.33% до 285,5 тыс. вон. Совокупная капитализация двух компаний превысила 3000 трлн вон, что составляет почти половину общей капитализации KOSPI. Совокупная капитализация корейского фондового рынка и KOSDAQ впервые превысила 7000 трлн вон, всего через 8 торговых дней после преодоления отметки в 6000 трлн вон 27 октября.
В ходе торгов 12 мая KOSPI в дальнейшем пробил уровень 3900 пунктов (то есть уровень около 7900 пунктов), обновив исторический максимум. Но данные за этот же день раскрыли другую сторону FOMO: из 948 акций на всем рынке KOSPI, только 186 выросли, а 696 упали; около 30% компонентов индекса падали с начала года. Весь рост был полностью сконцентрирован на двух полупроводниковых акциях с большим весом — Samsung и SK Hynix.
FOMO среди розничных инвесторов уже сформировало новую рыночную лексику. Корейские финансовые СМИ используют термин "hynix FOMO" для описания ментального раскола среди розничных инвесторов: с одной стороны — сожаление об упущенной выгоде ("надо было покупать на уровне 800 тыс. вон"), с другой — тревога "стоит ли сейчас запрыгивать" и "коррекция скоро наступит". В сообществах розничных инвесторов появилось множество обсуждений на тему "Samjeon-nix" (совместное название Samsung + Hynix). Это типичная форма гонки за ростом, управляемой розничными инвесторами, что в высокой степени соответствует определению "сигнала FOMO" от Nomura.
Направление иностранного капитала еще более показательно. Согласно сообщению Seoul Economic Daily от 10 мая, фонд iShares MSCI Korea ETF (EWY) зафиксировал чистый отток в размере 10,145 млрд долларов в период с 1 по 7 мая. Это сигнал оттока пассивных фондов с корейского рынка. Но в то же время, Roundhill Active DRAM ETF за тот же период привлек чистые средства в размере 19,538 млрд долларов. В этом ETF доля SK Hynix составляет 25.94%, Samsung Electronics — 21.62%, в сумме около 48%. Иностранный капитал не продает Южную Корею, а продает широкие индексы и покупает чипы — это целенаправленное наращивание позиций по теме AI.
Однако, есть одна деталь, заслуживающая внимания. Nomura в отчете от 11 мая указывает, что KOSPI 200 также демонстрирует "рост спотовой цены и рост волатильности", но скос коллов не следует за ростом, что не похоже на расширение волатильности, вызванное спросом на коллы. Другими словами, на момент публикации отчета корейский рынок еще не вошел в типичное состояние "боязни упустить выгоду и спешки за коллами". После резкого скачка KOSPI в тот день, станет ли этот сигнал быстро разворачиваться, будет ключевым для оценки устойчивости FOMO на следующем шаге.
Корейский рынок — продолжение цепочки капитальных затрат AI на американском рынке. Как долго продержится следующая эстафета, зависит от "вершины пирамиды"
FOMO на корейском рынке — не изолированное событие. По сути, это продолжение с высокой бетой истории капитальных затрат AI на американском рынке.
Данные напрямую указывают на эту цепочку передачи. По оценкам Bridgewater, Alphabet, Amazon, Meta и Microsoft в совокупности инвестируют около 6500 млрд долларов в инфраструктуру, связанную с AI, в 2026 году. Goldman Sachs, ссылаясь на данные, указывает, что консенсус-оценки капитальных затрат крупнейших компаний облачной инфраструктуры на 2026 год подскочили на 1300 млрд долларов в последнем квартале, достигнув 6700 млрд долларов, что составляет более 90% ожидаемого операционного денежного потока этих компаний. Капитальные затраты Microsoft в третьем финансовом квартале составили 31,9 млрд долларов, Alphabet в отчете за Q1 раскрыла покупки недвижимости и оборудования на 35,7 млрд долларов, а Meta повысила ориентир по капитальным затратам на 2026 год до диапазона 125-145 млрд долларов.
Эти деньги текут в дата-центры, GPU, память, сети, системы питания и облачные мощности. SK Hynix и Samsung находятся в самом центре этого денежного потока. Память HBM4, высокоскоростная память HBM раскупаются гипермасштабными облачными провайдерами. Согласно сообщению Reuters, SK Hynix недавно получила "беспрецедентные" предложения о заказах от крупных технологических компаний, некоторые клиенты сами предложили финансировать новые производственные линии и литографические аппараты ASML. Мощности по производству чипов практически исчерпаны. Вот почему однодневный скачок KOSPI на 4.32% полностью вписывается в нарратив: корейский рынок, по сути, является "второй производной" истории американского AI.
Но эта взаимосвязь также означает уязвимость. Как только американские технологические акции совершат полный разворот, корейский рынок станет активом с высокой бетой, напрямую принимающим на себя давление продаж. Другой путь риска, упомянутый Nomura, — это возобновление инфляции, вынуждающее мировые центральные банки занять более ястребиную позицию. Ключевым событием на этой неделе (12 мая) станет индекс потребительских цен США (CPI), а премия на это событие на опционном рынке все еще находится на низком уровне — рынок еще не заплатил высокую страховую премию за этот риск.
На макроэкономическом фоне есть еще одна переменная: Ормузский пролив. Нефть WTI закрылась 8 мая на уровне 100,09 долларов (+4.89%), нефть Brent — на 105,66 доллара (+4.31%), конфликт в районе Ормузского пролива продолжает обостряться. Nomura дает следующий вывод: пока пролив остается заблокированным и между США и Ираном сохраняются разногласия по условиям прекращения огня, доминирующая среда на рынке, обусловленная AI, может оказаться более устойчивой, чем ожидалось. Влияние цен на энергоносители будет подстегивать инфляционные ожидания, но одновременно сделает рынок еще более нежелающим покидать "историю AI, на которой можно заработать".
Сложив все эти нити вместе, этап роста AI-ралли на американском рынке за счет "выдавливания коротких позиций" подходит к концу; FOMO на корейском рынке уже разгорелось, розничные инвесторы и иностранные чип-ETF синхронно наращивают позиции, но опционный скос еще не поспевает; то, как долго продержится следующая эстафета, зависит от того, скорректируются ли американские технологические акции, даст ли американский CPI сигнал об ускорении инфляции и утихнет ли ситуация в Ормузском проливе. Концептуальная рамка отчета Nomura была последовательно подтверждена действиями рынка, Сеул становится новым эпицентром этого AI-трейда.