Согласно рыночному аналитику CryptoMichNL, биткоин находится в зоне, которая определит его дальнейшую судьбу. Недавно он обозначил две ключевые ценовые области, которые могут определить следующий крупный ход актива. Хотя он считает, что более широкая бычья структура остаётся нетронутой, он также определил более низкий диапазон, в котором инвесторы, в случае пробития поддержки, могут найти, по его мнению, одну из самых привлекательных возможностей для покупки в текущем цикле.
Самая важная зона поддержки биткоина
Прогноз аналитика сосредоточен на регионе около $71 000 - $73 000, который он описал как уровень, который должен оставаться нетронутым, чтобы избежать более глубокого отката. Его сопровождающий график выделяет эту область как критический блок поддержки, расположенный над более широкой линией восходящего тренда, которая направляла восстановление биткоина после резкой коррекции, наблюдавшейся ранее в этом году.
Согласно графику, текущая рыночная структура существенно отличается от обвала, произошедшего в феврале. Тогда ранее установленный уровень сопротивления не смог превратиться в поддержку, что привело к быстрой потере импульса и крутому падению. На этот раз, однако, аналитик утверждает, что рынок пытается защитить бывшую зону сопротивления в качестве поддержки — развитие, которое могло бы сохранить более широкую бычью структуру.
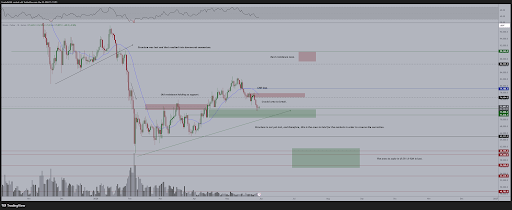
На графике также отмечена "критическая область для пробития" около $76 600. Биткоин недавно отступил из этого региона, столкнувшись с сопротивлением, что оставило его в качестве следующего серьёзного препятствия для быков. Чуть выше находится гэп Чикагской товарной биржи (CME) около $79 000, за которым следует ещё один кластер сопротивления в районе верхней границы диапазона $80 000.
По словам аналитика, удержание поддержки — это только первый шаг. Успешная защита области в $71 000 сохранит более широкую структуру нетронутой и увеличит вероятность нового продвижения к этим целям сверху. В таком сценарии биткоин мог бы восстановить импульс и подготовиться к рывку к новым максимумам цикла.
Где покупать, если биткоин обвалится
Хотя аналитик сохраняет конструктивный взгляд на рынок, он также наметил запасной план на случай, если поддержка не устоит. Если биткоин потеряет регион $71 000-$73 000, его график указывает на значительно более низкую зону накопления примерно между $61 000 и $65 000.
Эта область примечательна по нескольким причинам. Она совпадает с историческими уровнями поддержки, установленными во время предыдущих фаз консолидации, и находится близко к 200-дневной скользящей средней — долгосрочному индикатору тренда, за которым внимательно следят как институциональные, так и розничные участники рынка. Аналитик предположил, что снижение в этот регион будет представлять исключительную возможность для покупки.
На данный момент внимание рынка остаётся прикованным к двум уровням. Первый — это защита поддержки около $71 000. Второй — решительный пробой выше $76 600. То, как биткоин отреагирует вокруг этих пороговых значений, может определить, принесёт ли следующая глава новую волну роста к рекордным максимумам или последнюю возможность для покупателей накопить актив по значительно более низким ценам в регионе $61 000-$65 000.


