Hyperliquid [HYPE] продолжил свою краткосрочную нисходящую тенденцию, опустившись ниже уровня $37 2 апреля. С 15 марта уровень $37 выступал в качестве надежной краткосрочной поддержки.
Каждое повторное тестирование сопровождалось отскоком цены, но ни один из отскоков за последние две недели не был достаточным, чтобы подняться к локальным максимумам на уровне $43,7. Последняя неделя марта ознаменовалась движением выше психологической отметки $40, но медведи быстро взяли под контроль тенденции после этого.
В то же время Bitcoin [BTC] и многие другие prominent альткоины показывали убытки и испытывали давление продаж. Рыночные настроения оставались крайне пессимистичными.
Означает ли это, что инвесторам HYPE стоит продавать и ждать продолжения нисходящего тренда?
Инвесторы HYPE не должны упускать ЭТОТ шанс

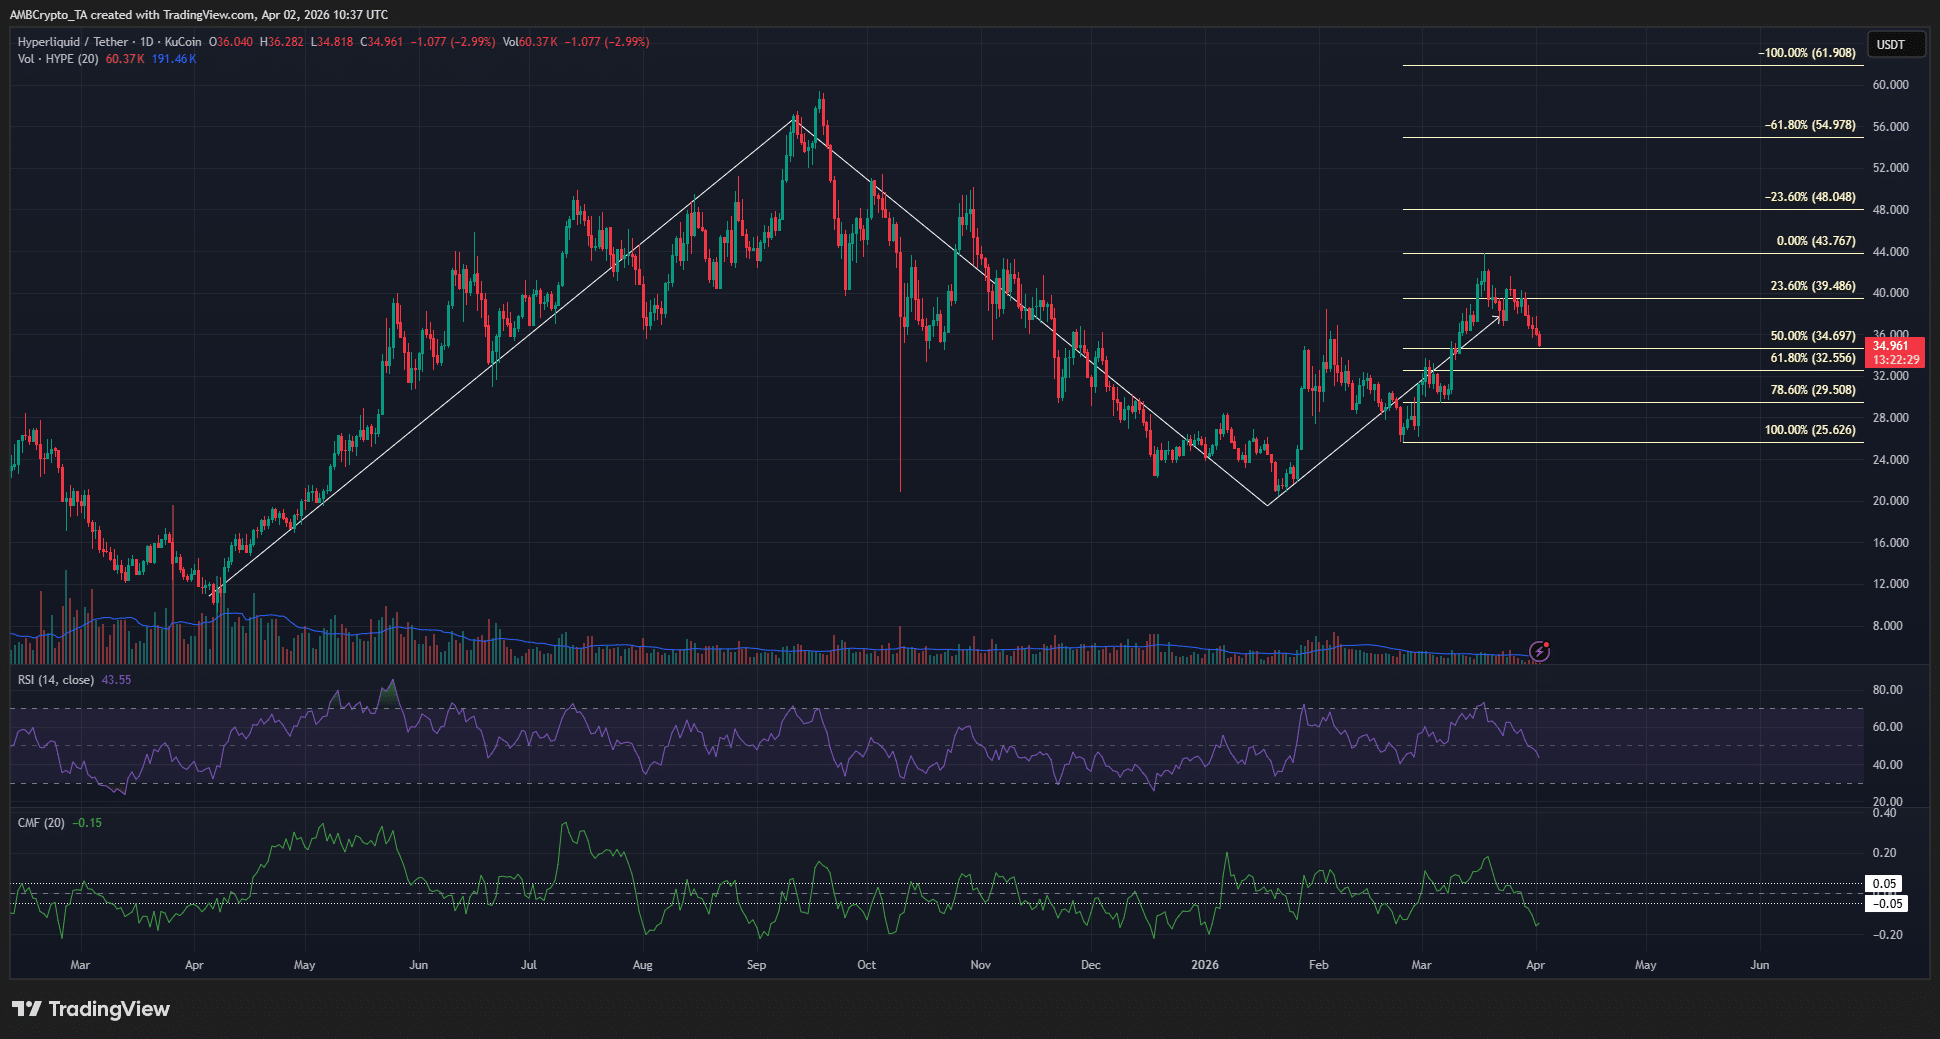
Хотя недавние потери в цене токена Hyperliquid кажутся серьезными, они могут быть всего лишь частью отката. Долгосрочная структура показала, что HYPE пережил ралли в 2025 году, которое почти достигло $60, а затем откатилось до $20 к концу года.
Последующий рост до $43,7 с тех пор стал частью следующей бычьей волны. Мартовское ралли сопровождалось откатом за последние две недели, и этот откат может продолжиться еще некоторое время.
Уровни Фибоначчи, построенные для последнего восходящего движения от $25,6, показали, что у HYPE есть пространство для дальнейшего падения. Уровни $32,44 и $29,5 в "золотом кармане" — это те уровни, за которыми будут следить долгосрочные покупатели.
Тем не менее, им не стоит и спешить с покупками. На момент написания статьи RSI показал, что импульс стал медвежьим, при этом RSI опустился ниже нейтрального уровня 50. CMF также отражал значительный отток капитала с рынка, показывая значение -0,15.
Призыв к действию для трейдеров: Ждать

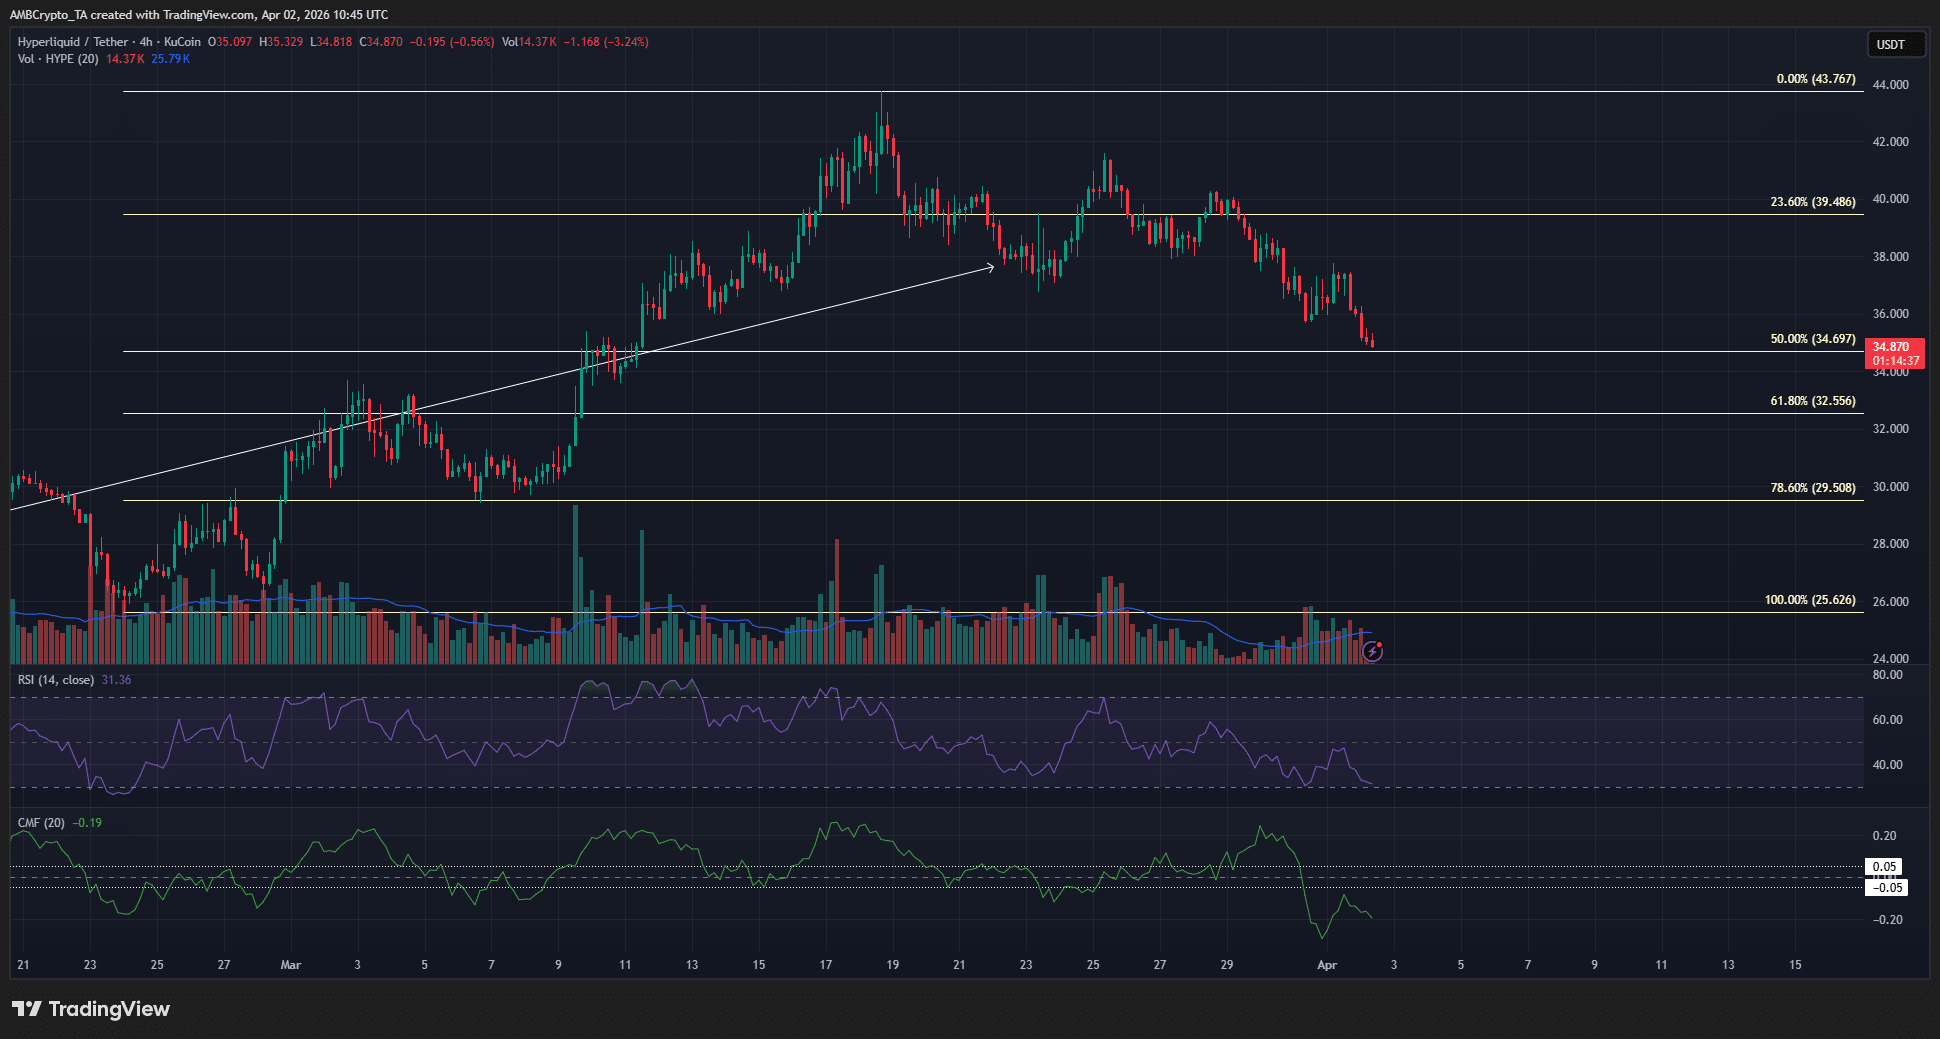
На 4-часовом графике видна медвежья структура для HYPE. Более низкий максимум, установленный ниже $42 25 марта, стал свинг-максимумом на этом таймфрейме. В то же время зона $29,55-$32,5 оставалась зоной спроса, которую покупателям необходимо защищать.
Для того чтобы опровергнуть эту идею об откате и показать, что у токена есть потенциал для установления новых максимумов выше $43,7, необходим возврат выше $41,59. Пока этого не произошло, долгосрочные инвесторы могут дождаться окончания отката перед покупкой.
Итоговое резюме
- Долгосрочный тренд цены токена Hyperliquid был бычьим, но текущий краткосрочный тренд — медвежий.
- Текущая распродажа происходит на фоне отката в долгосрочной структуре. Следовательно, инвесторы с долгосрочным горизонтом будут наблюдать за зоной спроса $29-$32.


