Gate Institutional Weekly Report: BTC Funding Rate Turns Positive, CEX TradFi Trading Volume Soars (March 23–29, 2026)

marsbitОпубликовано 2026-04-03Обновлено 2026-04-03

Введение

Last week, the market was primarily driven by a sharp escalation in the U.S.-Iran conflict, which pushed WTI crude oil prices above $100 amid threats to the Strait of Hormuz. This triggered inflation concerns, rising U.S. bond yields, and a sell-off in tech stocks and crypto assets, with major cryptocurrencies falling over 6%. Market sentiment indicators like the VIX and Fear & Greed Index reflected high uncertainty and fear. In crypto ETFs, outflows dominated mid-week with $500M net withdrawn from BTC and ETH products, though slight inflows returned by the weekend. TradFi trading volume on CEXs surged, especially in commodities and metals, while PAXG liquidity recover after initial sell pressure. On-chain, DEX trading cooled, with Meteora on Solana maintaining high volume while others declined. Stablecoin supply remained stable, with DAI showing resilience. LST protocols like Lido and Jito saw reduced activity due to lower ETH and SOL performance. Aave’s lending decreased overall, though Mantle saw growth. Derivatives data showed BTC funding rates briefly turned positive, indicating tentative long interest, though open interest declined and skew remained negative, reflecting defensive sentiment. Implied volatility held steady, suggesting limited expectations for near-term price swings. Gate highlighted progress in data-driven operations, growth in lending, AI integration, and upcoming events including the Hong Kong Web3 Festival.

The core driver of the market last week was the sharp escalation of the US-Iran conflict. As the Strait of Hormuz faced a substantial threat, WTI crude oil prices surged nearly 17% during the week, reclaiming the $100 mark. This simultaneously triggered strong inflation expectations, leading to rising US Treasury yields and dealing a heavy blow to high-valuation tech stocks. The US Dollar Index broke through the 100 mark, suppressing gold's gains. Cryptocurrencies, as high-risk assets, experienced significant selling pressure, with weekly declines exceeding 6%. As the US-Iran conflict entered its fifth week with no signs of resolution, the sell-off continued. Last week's volatility and uncertainty indicators reflected the current macroeconomic tone. The VIX index closed at 31.05, its highest level since the outbreak of the war; while CNN's Fear & Greed Index fell to the "Extreme Fear" level, its lowest since last November. The bond market further adjusted its pricing, with the 10-year US Treasury yield rising to 4.44% and the 30-year US Treasury yield briefly breaking through 5% before retreating to just below that level. This movement reflects the market's entrenched expectation of "higher for longer" interest rates. The market widely believes the possibility of a Fed rate cut before autumn is minimal, while the chance of a 25 basis point rate hike this year is about 25%.

2. Liquidity Analysis

2.1 Crypto ETF Net Flows

Crypto ETF flows showed a clear pattern of "outflows first, recovery later" over the past week: sentiment weakened rapidly mid-week, with spot ETFs seeing a combined net outflow of approximately $500 million—BTC outflows were about $296 million and ETH outflows about $207 million. The selling pressure was mainly concentrated on March 26-27, indicating a clear phase of institutional de-risking. Marginal inflows appeared over the weekend, ending the multi-day outflow trend. Overall, institutional funds remain cautiously allocated amid macroeconomic uncertainty.

2.2 TradFi Liquidity

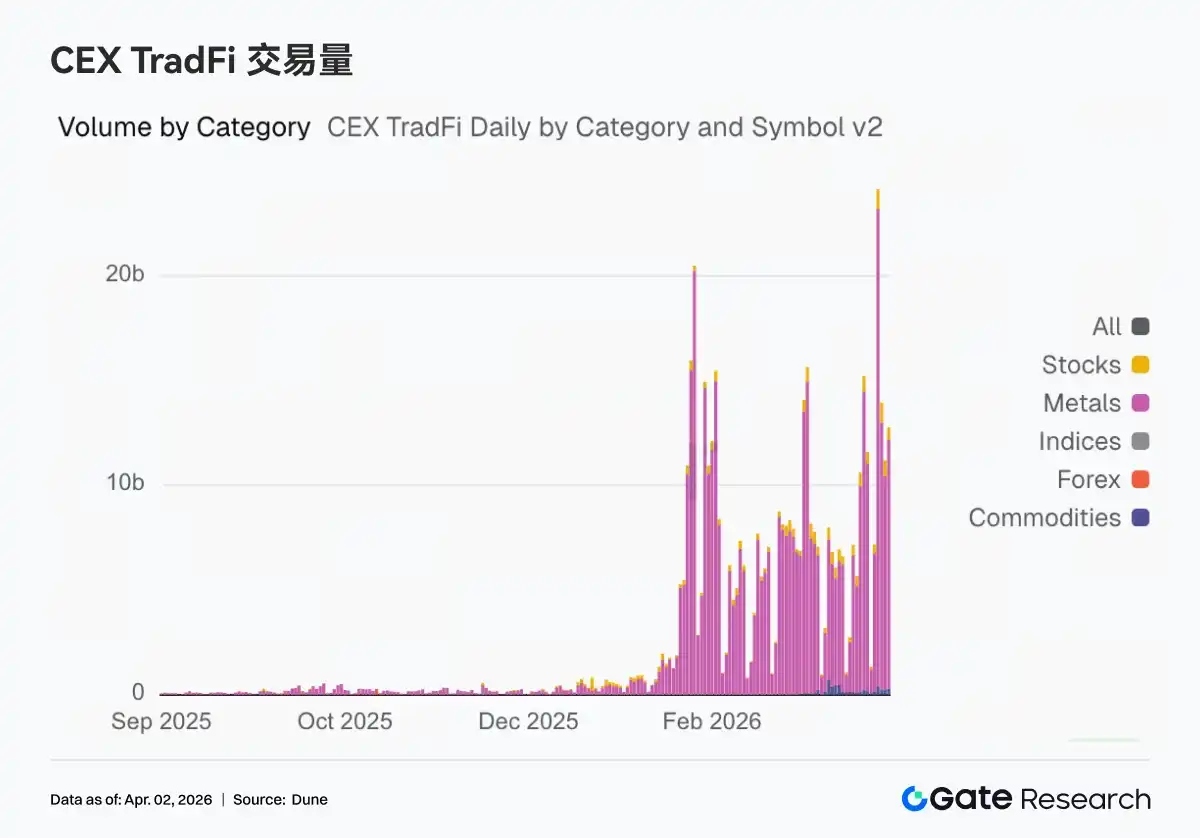
Over the past week, on-chain trading remained centered around macro asset volatility. Perp DEX TradFi trading volume rose to $17 billion; crude oil trading still had the highest weight but declined sequentially, while gold's share increased again. TradFi perpetual trading volume on CEXs surged, with volume on March 23rd hitting a record high. All sub-categories saw significant growth, with commodities and metals showing the highest sequential increases.
PAXG's market depth changes over the past week exhibited a structural feature of "weak first then strong, with tail-end volume expansion." Early in the week, Delta was mostly negative, coupled with price declines from highs, indicating net selling dominated and liquidity tended to withdraw; subsequently, around March 23rd, a round of concentrated selling pressure emerged, corresponding to a rapid price drop and creating a temporary liquidity vacuum. Depth structure improved significantly over the weekend, with Delta turning consistently positive and the scale significantly expanding, indicating funds began to actively absorb selling and push prices higher.

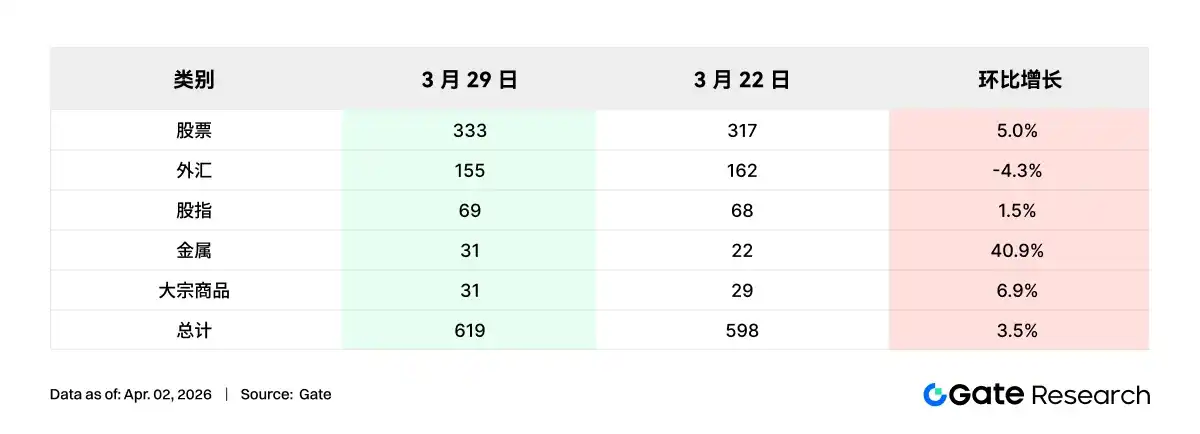
The number of TradFi asset categories expanded further last week. The total number of TradFi asset categories (counting only TradFi and CFD sections, excluding perpetual contracts) on three major CEXs increased from 598 to 619, a sequential growth of 3.5%. Metals saw the most significant growth, increasing from 22 to 31 items, up 40% sequentially; overall, only Gate saw an increase in the number of TradFi asset categories last week.
3. On-Chain Data Insights

3.1 DEX Trading Cools Down, Meteora Remains High

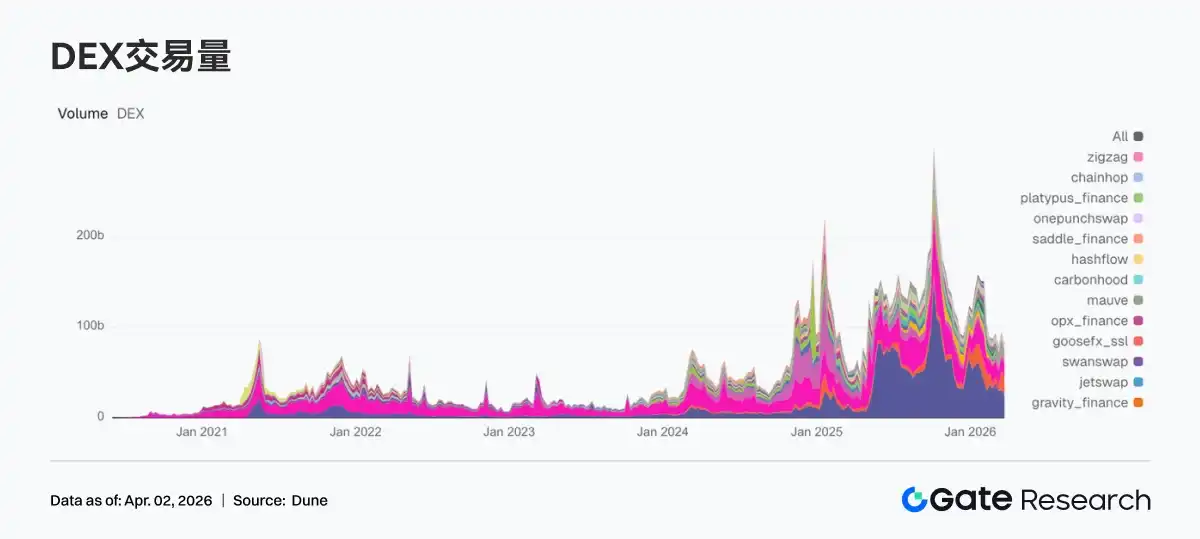
Trading heat shifted from last week's surge to a cooling phase, with top protocols generally pulling back. Weekly trading volume on both PancakeSwap and Uniswap declined compared to the previous week, indicating a overall convergence of spot trading demand on mainstream chains. The Solana side showed divergence; Meteora remained at a high level slightly above $20 billion in trading volume, but marginal growth has slowed; Raydium's weekly trading volume fell 50% sequentially, the largest drop among top DEXs. Aerodrome, Humidifi, and Bisonfi also saw varying degrees of decline. Looking at the protocol side, PancakeSwap's Infinity architecture and Meteora's DLMM remain the strongest efficiency labels, but the market this week placed more emphasis on确定性 liquidity.
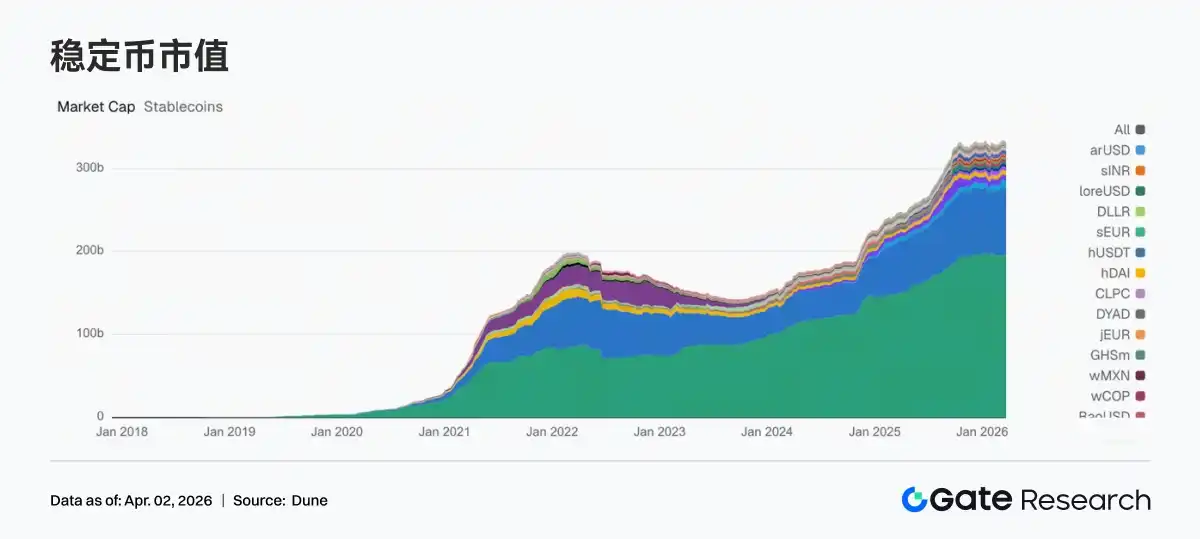
3.2 Stablecoin Supply Consolidates at Highs, DAI Shows Resilience

No new external inflows were seen in the stablecoin sector this week, with overall levels consolidating at highs. USDT remained almost flat compared to the previous week. USDC decreased by about $1.4 billion, and PYUSD also fell by nearly $200 million, indicating demand for payment and settlement-oriented stablecoins slightly declined this week. Protocol-type stablecoins were relatively more stable, with DAI seeing slight growth and USDS maintaining high levels. USD1, USDe, and GHO had minor fluctuations,偏向 structural reallocation. Circle continues to advance the multi-chain expansion of USDC + CCTP, but this week's data reflects a tilt within stablecoins from payment/settlement towards resilience in DeFi scenarios.
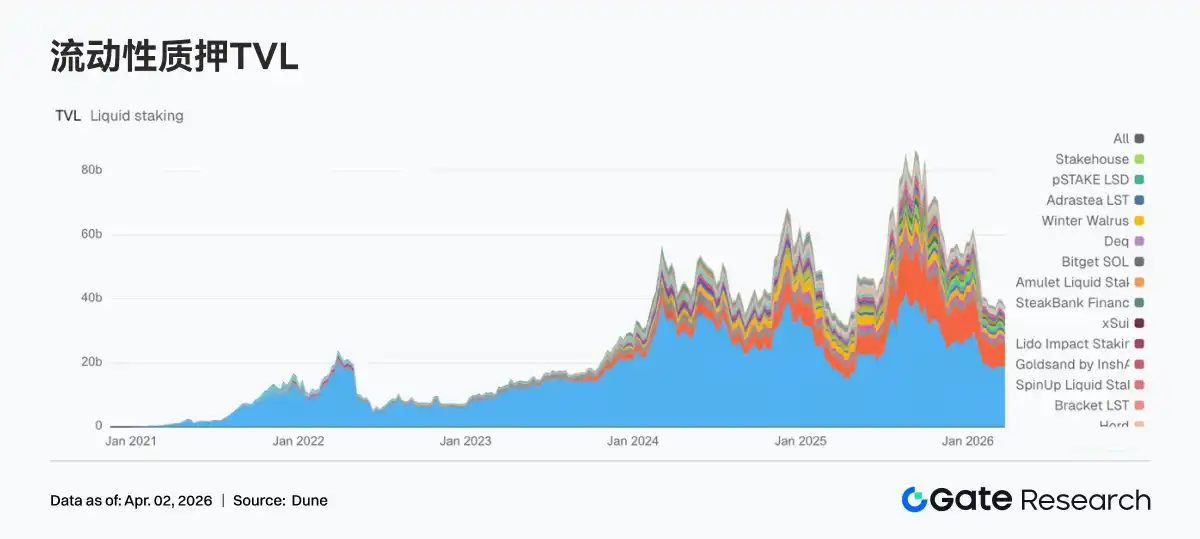
3.3 LST Protocols Pull Back, ETH and SOL Both Decelerate

This week, the liquid staking sector saw both ETH and SOL narratives decelerate. Affected by ETH's poor performance, ETH LST funds began阶段性 reducing positions, with TVL declining for both Lido and Rocket Pool. Lido's V3 and EarnETH / EarnUSD vault expansions have broadened the product boundaries, but short-term TVL is more influenced by market risk appetite and staked asset price volatility. The SOL direction also faced pressure, with Jito and Sanctum Validator LSTs, among others, experiencing pullbacks. Overall, the week saw a downturn in the sector's overall risk appetite.
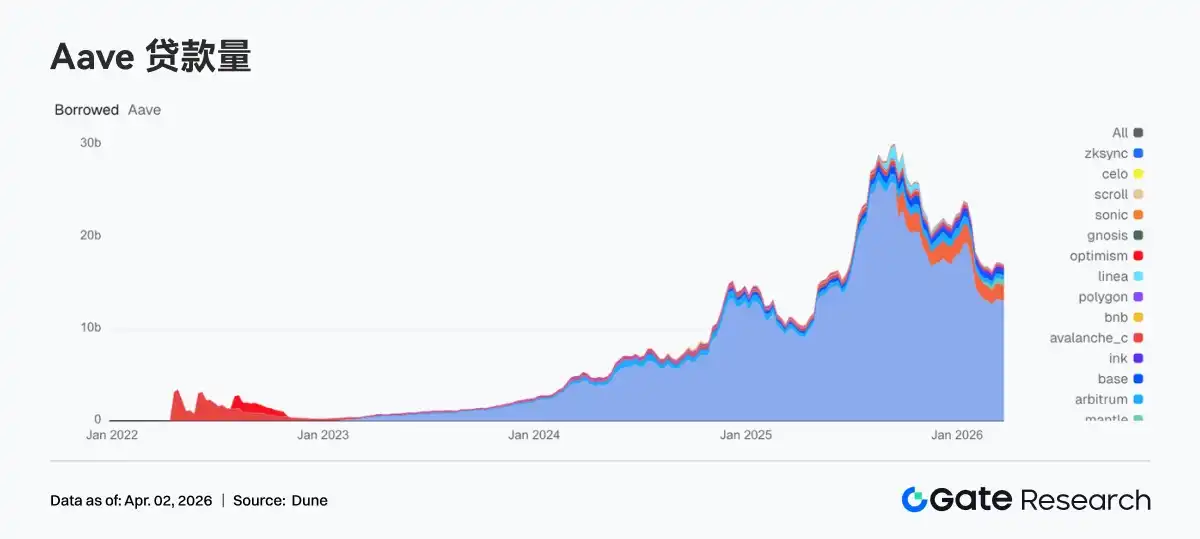
3.4 Aave Loan Volume Pulls Back, Mantle Becomes a Market Absorbing Limited Increment

Aave's total loan balance slightly decreased compared to the previous week. Both the Ethereum main market and Plasma saw declines of about $100 million, indicating deleveraging in mainstream markets. Multi-chain expansion also temporarily slowed this week, with Base and Arbitrum同步 pulling back. Mantle was one of the few markets that grew against the trend, with loan规模 increasing from $555 million to $574 million, becoming the structural highlight of the week. Ink also rose slightly from $289 million to $292 million, but the increase was limited. Aave is recently advancing its V4 Hub-and-Spoke model, and the market is pricing in future cross-market liquidity efficiency, but current funds are prioritizing reducing overall leverage and allocating limited increments to sub-markets with new narratives.
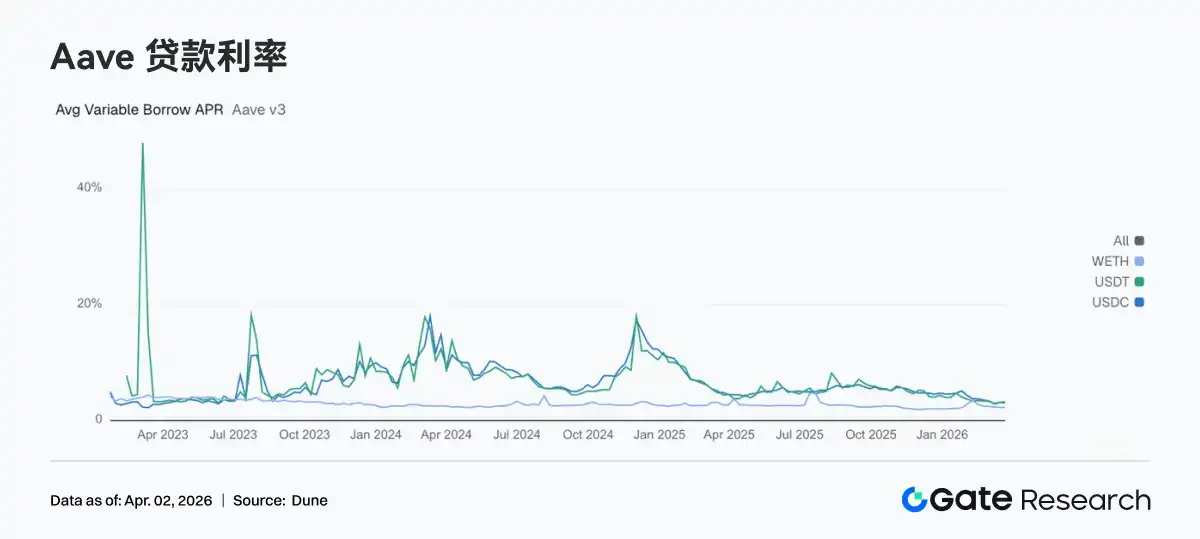
3.5 Divergence in Aave's Three Core Asset Lending Rates Continues

The average floating borrowing APR for USDC rose from 3.10% to 3.23%; demand for USD stablecoins did not weaken同步 with the decline in total loan balance this week. In contrast, USDT fell from 3.10% to 3.02%, and WETH also slightly decreased from 2.25% to 2.23%. While compressing broad risk exposure on-chain this week, lending demand became more concentrated on USDC. From a strategic perspective, this typically corresponds to institutions preferring USDC for liquidity scheduling, collateral management, and neutral strategy turnover. Combined with Aave's latest governance progress, the risk isolation and liquidity routing framework of V4 is gradually becoming clearer. Divergence in interest rates between different assets is likely to become more frequent in the future, better reflecting true capital preferences.
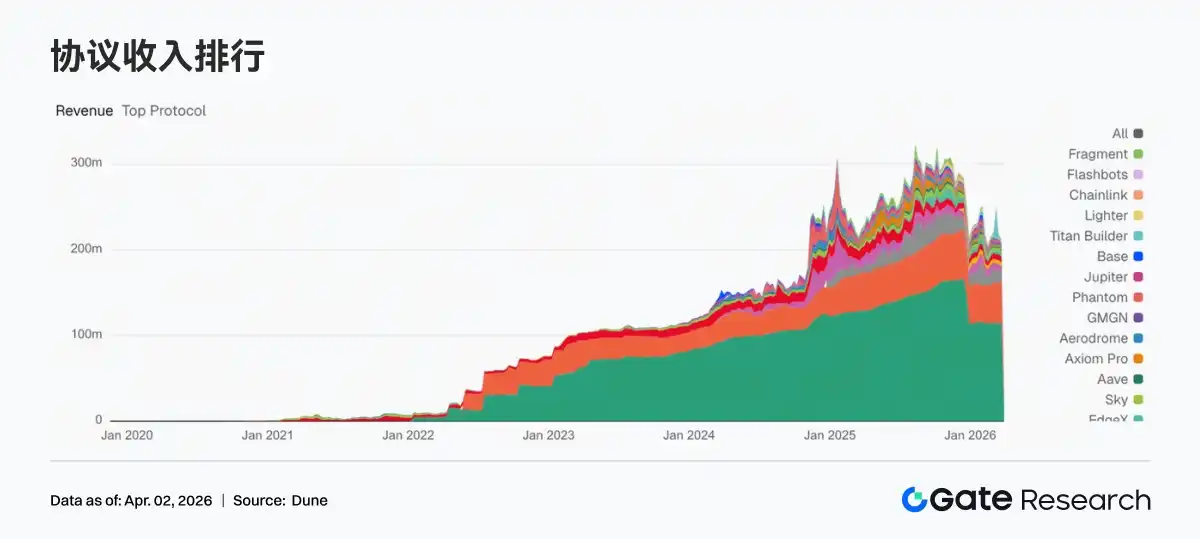
3.6 Protocol Revenue Shifts from Transaction-Driven Back to Stock-Driven

Revenue from trading protocols generally cooled down, while stablecoin issuers remained the most stable profit centers. Weekly revenue for Tether and Circle remained stable at high levels. In contrast, Hyperliquid declined from $14.3025 million to $12.6277 million, Pump fell from $7.1452 million to $6.6905 million, and EdgeX also dropped from $4.5534 million to $3.7969 million; the cooling trading activity has already transmitted to the revenue side. Overall, the main theme of protocol revenue this week was whose revenue is less dependent on short-term trading volatility.
4. Derivatives Tracking

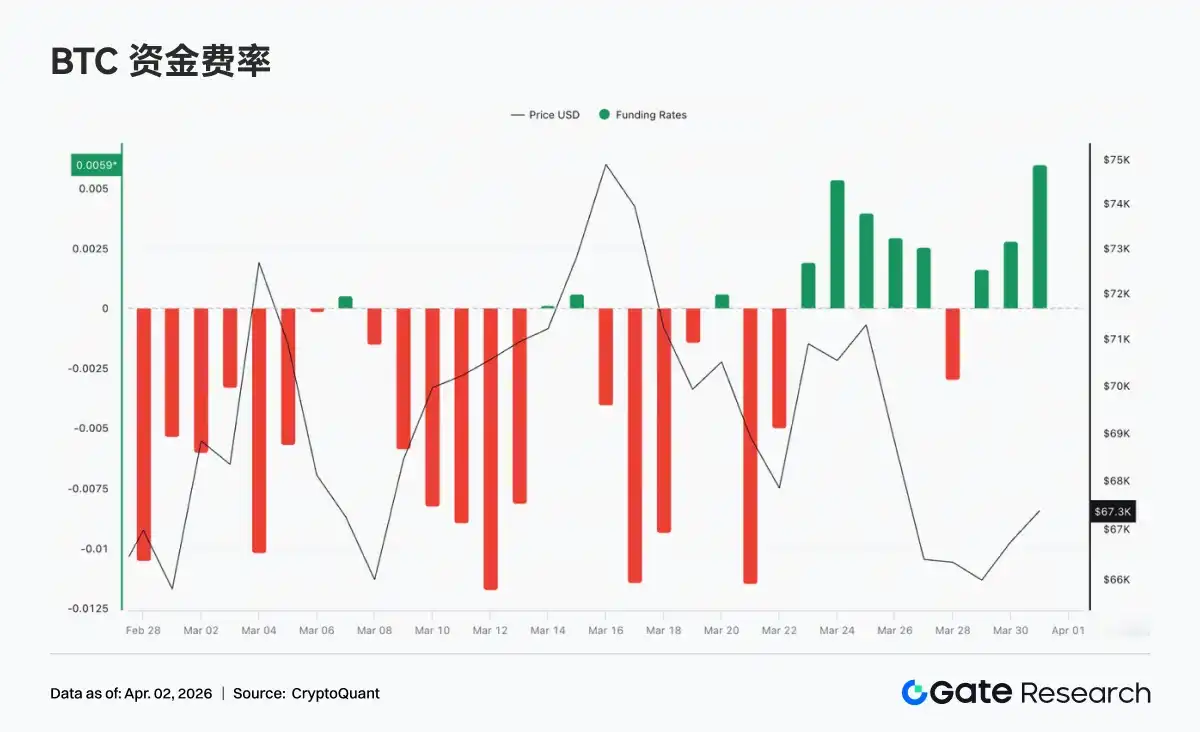
4.1 Funding Rates Shift to Short-Term Bullish, Sentiment Switches to Tentative Longing

BTC funding rates overall showed a structure of shifting from repair to briefly turning positive before fluctuating again. The previously long-standing deep negative, short-dominated pattern has明显 eased. Funding rates turned positive mid-week and remained for several days (peaking near +0.005), indicating the market switched to active long试探, with short-term risk appetite repairing and resonating with the阶段性 price rebound. However, this positive funding rate phase was short-lived and limited in intensity, failing to form a trend-positive premium structure.
4.2 Open Interest Rises Then Falls, Consolidates; Leveraged Funds Turn Watchful

Over the past week, BTC open interest first expanded to a阶段性 high alongside rising prices, but then quickly decreased to around $21B following the price pullback, indicating significant deleveraging in the market. Subsequently, open interest failed to return to previous highs, instead oscillating and repairing within the $21B–$22.5B range, with the overall center of gravity lower. New capital inflow momentum was insufficient, and leverage shifted from expansion to contraction. Overall, the current open interest structure is dominated by存量博弈 (stock game playing), lacking sustained volume配合, and the market remains in a震荡重建阶段 (oscillating rebuilding phase) after deleveraging.

4.3 Option Open Interest Concentrated in Medium-to-Long Term & High Strike Prices, Bullish Structure Prevails

BTC option open interest is mainly concentrated in medium-to-long term contracts like April and June, indicating the market is focused on medium-term positioning; structurally, Calls are significantly higher than Puts, overall still偏向 bullish. Looking at strike prices, Calls are主要集中在 the $80,000–$120,000 range, while Puts are distributed in the $60,000–$80,000 range, forming a typical structure of upside call speculation and downside hedging. It is worth noting that Put open interest in the $60K–$70K range is not low,表明 the market maintains medium-term bullish expectations while also strengthening short-term defensive sentiment.

4.4 Skew in Negative Territory, Short-Term Defensive Sentiment Still Dominates

Over the past week, the BTC 25D Skew overall remained in negative territory (approx. -6 to -10), with Puts still carrying a premium relative to Calls, indicating the market's assessment of downside risk remains relatively high. Shorter cycles (7D, 30D) were more volatile, falling rapidly before briefly repairing, reflecting反复 switching short-term sentiment; medium-to-long term (60D and above) was relatively stable, overall maintaining in the -5 to -7 range, showing little change in medium-term risk expectations. Overall, the Skew did not show a sustained recovery to near neutral or positive values, meaning that although there were repair attempts, defensive positioning still dominates.

4.5 Implied Volatility Stabilizes, Market Expects Limited Short-Term Volatility

Over the past week, the BTC DVol index overall oscillated within the 52%–55% range, first slightly declining then rising again, without a trend increase. The market's pricing of future volatility remains relatively restrained overall. During this period, prices experienced significant declines, but implied volatility only rose温和, without panic amplification, indicating the market did not view the current adjustment as a high-risk event. Overall, IV showed some desensitization from price, reflecting traders' inclination towards range-bound volatility expectations rather than unilateral trend行情 (market moves).

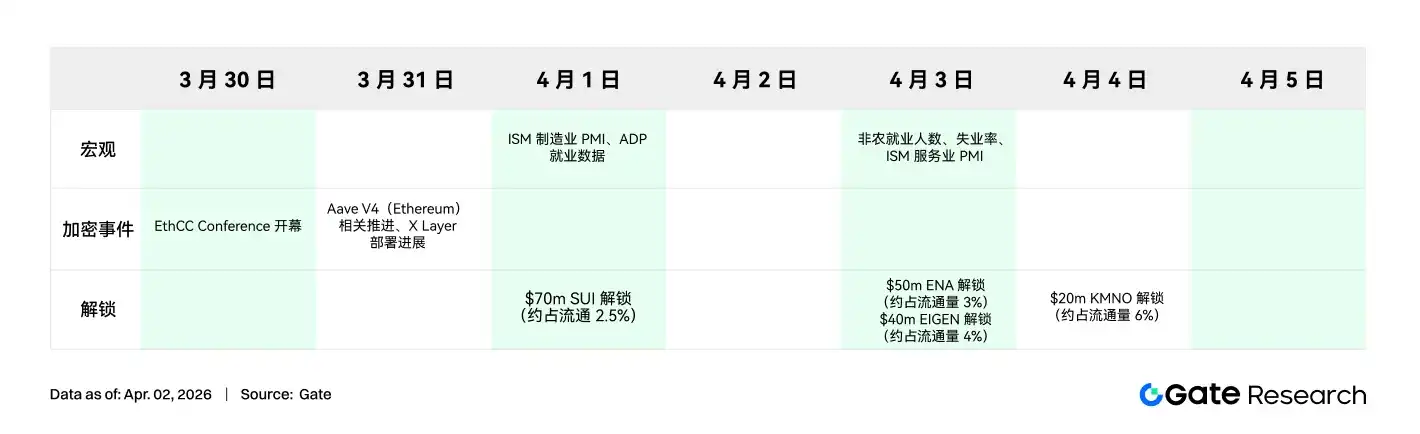
5. Week Ahead Outlook
6. Gate Institutional Dynamics

Refined Operations

1. Advancing data-driven and refined management,精准定位 customer needs, enriching customized solutions.

2. Significant results in dormant user activation.

Capital Business

1. Collateralized lending scale continues to grow, approaching bull market levels.

2. BTC interest rates下调, driving new demand growth.

Product & Technology

1. Websocket contract BBO real-time push achieved full availability in April.

2. AI gradually implemented, institutional services entering the AI-assisted operation phase.

Events & Marketing

1. CrossEx Advanced Trading Incentive Program launched, offering up to -0.01% contract rebate maker fees starting April 9th.

2. April Hong Kong Web3 Festival Side Event即将开启 (coming soon).

Data Sources:

• Investing, https://investing.com/currencies/xau-usd-historical-data

• Gate, https://www.gate.com/trade/BTC_USDT

• CMC, https://coinmarketcap.com/real-world-assets/?type=all-tokens

• Coinglass, https://www.coinglass.com/pro/depth-delta

• Dune, https://dune.com/gateresearch/gate-institutional-weekly-report

• CryptoQuant, https://cryptoquant.com/asset/btc/chart/derivatives

• Amberdata, https://pro.amberdata.io/options/deribit/btc/current/

Gate Research Institute is a comprehensive blockchain and cryptocurrency research platform, providing readers with in-depth content including technical analysis, hot topic insights, market reviews, industry research, trend predictions, and macroeconomic policy analysis.

Disclaimer

Cryptocurrency market investment involves high risks. It is recommended that users conduct independent research and fully understand the nature of the assets and products they purchase before making any investment decisions. Gate is not responsible for any losses or damages resulting from such investment decisions.


Трендовые криптовалюты

Связанные с этим вопросы

QWhat was the main driver of the market last week and how did it impact cryptocurrency prices?

AThe main driver was the sharp escalation of the US-Iran conflict, which threatened the Strait of Hormuz. This caused WTI crude oil prices to surge nearly 17%, reigniting inflation expectations. As a result, US Treasury yields rose, putting pressure on high-valuation tech stocks. Cryptocurrencies, as high-risk assets, experienced significant selling, with weekly losses exceeding 6%.

QHow did the net flows for crypto ETFs perform last week, and what was the trend for BTC and ETH specifically?

ACrypto ETF flows showed a clear pattern of 'outflows first, followed by a recovery.' Mid-week, sentiment weakened rapidly, with spot ETFs seeing a combined net outflow of approximately $500 million. Specifically, outflows were about $296 million for BTC and $207 million for ETH, with the selling pressure concentrated on March 26-27. A marginal inflow occurred over the weekend, ending the multi-day outflow trend.

QWhat was notable about the trading volume of TradFi perpetual contracts on CEXs last week?

AThe trading volume of TradFi perpetual contracts on CEXs surged significantly last week. Notably, March 23rd set a new all-time high for trading volume. All sub-categories saw substantial growth, with commodities and metals recording the highest month-over-month increases.

QWhat was the trend for BTC funding rates last week, and what did it indicate about market sentiment?

ABTC funding rates shifted from a deep negative, bearish-dominated structure to briefly turning positive (reaching nearly +0.005) mid-week. This indicated a shift towards active long positioning and a repair in short-term risk appetite, resonating with a temporary price rebound. However, this positive rate phase was short-lived and of limited intensity, failing to establish a sustained positive premium structure.

QHow did the Aave lending market perform last week, and which specific market was a structural bright spot?

AThe total loan balance on Aave saw a slight decline compared to the previous week. The main Ethereum market and Plasma both decreased by approximately $100 million, showing deleveraging in mainstream markets. Multi-chain expansion also slowed. Mantle was a structural bright spot, with its loan scale increasing from $555 million to $574 million, representing a rare instance of growth.

Похожее

После трёх кварталов падения: получится ли у крипторынка стабилизироваться в третьем квартале?

Криптовалютный рынок пережил худший квартал с 2022 года, общая капитализация упала на 12,6% до $2,1 трлн, а дневные объемы торгов снизились на 20,9%. Впервые за три года сократилась и капитализация стейблкоинов. Основные факторы спада — отток средств из биткоин-ETF, распродажа биткоинов корпоративным казначейством Strategy и ужесточение монетарной политики ФРС. Второй квартал завершился чистым оттоком $46,7 млрд из ETF, при этом в июне отток достиг рекордных $45 млрд. Ключевым событием третьего квартала станет заседание ФРС 28–29 июля. Мягкий сигнал может поддержать биткоин в диапазоне $68 000–84 000 и вернуть приток в ETF, тогда как жесткая риторика способна сместить торговый диапазон к $50 000–56 000. Законодательная неопределенность также давит на рынок: прогресс по закону CLARITY Act, определяющему регуляторные границы, замедлился, и вероятность его принятия в 2026 году упала до 40–45%. Несмотря на общий спад, два сегмента показали рост: объемы на рынках предсказаний выросли на 48,7%, а торговля токенизированными коллекционными предметами увеличилась на 143%. Сектор RWA продолжает стабильно развиваться, достигнув $28,1 млрд. Рынок, вероятно, миновал фазу острой распродажи, но для устойчивого восстановления необходимы ясность от ФРС и регуляторный прогресс.

marsbit15 ч. назад

После трёх кварталов падения: получится ли у крипторынка стабилизироваться в третьем квартале?

marsbit15 ч. назад

BIT Торговые часы: BTC по-прежнему под давлением 200 EMA на недельном графике, после отскока возможен перезапуск нисходящего движения; секторы хранения данных и полупроводников, выросшие ночью, начали падение в вечерней сессии

**Краткий обзор рынка: BTC под давлением, коррекция на рынке акций, внимание к данным и событиям** Рынок криптовалют демонстрирует осторожное восстановление. Bitcoin торгуется около $66 000, сталкиваясь со значительным сопротивлением в районе $68 000, где сосредоточены объемные "застрявшие" позиции. Ключевые технические уровни — 200-недельная скользящая средняя (~$63 333) и 200-недельная EMA (~$68 328). Аналитики отмечают низкую ликвидность, характерную для летнего периода. На фондовом рынке после сильного роста во вторник наблюдается коррекция. Фьючерсы на основные индексы США снижаются. Акции полупроводниковой и памяти, которые резко выросли накануне, падают в ночных торгах. Исключением стал SMCI, который вырос более чем на 15% после оптимистичного прогноза. На общий настрой негативно влияют рост цен на нефть (более $91 за баррель Brent) и доходности государственных облигаций США (10-летние — около 4,64%), что возрождает инфляционные опасения. Азиатские рынки показали нестабильную динамику. Индекс KOSPI в Корее вырос на 0,74%, а японский Nikkei 225 снизился на 0,18%. Основной риск для региона — ослабление японской иены до минимумов с 1986 года, что повышает вероятность вмешательства властей. **Ключевые события для наблюдения:** * **24 июля:** Финансовые отчеты Alphabet (Google), Tesla, IBM. Событие AMD, посвященное ИИ. * **25 июля:** Решение по процентной ставке ЕЦБ и пресс-конференция Кристин Лагард. Финансовые отчеты Intel, American Airlines, Honeywell и других. Данные по числу первичных заявок на пособие по безработице в США.

marsbit15 ч. назад

BIT Торговые часы: BTC по-прежнему под давлением 200 EMA на недельном графике, после отскока возможен перезапуск нисходящего движения; секторы хранения данных и полупроводников, выросшие ночью, начали падение в вечерней сессии

marsbit15 ч. назад

Бывший глава CFTC и президент Circle Тарберт: призывает к долгосрочной стратегии, но сам выводит $30 млн

Бывший председатель CFTC и президент Circle Хит Тарберт, публично пропагандируя долгосрочное видение компании для инвесторов на фоне падения акций на 70% с пиковых значений, сам активно распродавал свои акции CRCL. С момента IPO Circle он по плану 10b5-1 продал более 360 тысяч акций, выручив около 30 миллионов долларов, и при этом ни разу не докупал акции на открытом рынке. Эта разница между его публичными заявлениями и личными действиями вызвала критику. Карьера Тарберта демонстрирует классическое использование «вращающейся двери» между регулирующими органами и частным сектором. Уйдя с поста председателя CFTC в 2021 году, через 27 дней он занял должность главного юрисконсульта в маркет-мейкере Citadel Securities, который в тот момент находился под пристальным вниманием из-за скандала с акциями GameStop. Позже, уже работая в Citadel, Тарберт выступал за расширение полномочий CFTC на крипторынок, в то время как его работодатель планировал выход на этот рынок. В 2023 году Тарберт присоединился к Circle, где его опыт и связи сыграли ключевую роль в успешном проведении IPO компании в 2025 году. Однако его последующие массовые продажи акций, совпавшие с падением котировок и его же призывами к долгосрочным инвестициям, ставят под сомнение искренность его уверенности в будущем компании. Критики видят в его карьере образец превращения регуляторного опыта и политических связей в личную выгоду, в то время как риски несут обычные инвесторы, верящие его нарративам.

marsbit15 ч. назад

Бывший глава CFTC и президент Circle Тарберт: призывает к долгосрочной стратегии, но сам выводит $30 млн

marsbit15 ч. назад

Gate Research: Взлет «уолл-стритизации» криптофинансовых продуктов — это конкуренция или интеграция?

**Аналитический обзор Gate Research Institute: Волна "уолл-стритизации" криптофинансовых продуктов — конкуренция или интеграция?** Создание биткоина в 2009 году было ответом на финансовый кризис и стремлением построить децентрализованную систему без доверенных посредников. Однако к 2026 году значительная часть биткоинов (около 7,14%) хранится через ETF таких гигантов, как BlackRock. Это символизирует глубокую интеграцию традиционных финансов (TradFi) и крипторынка. С появлением биткоин-ETF, фьючерсов, RWA (токенизированных реальных активов) и государственных облигаций на блокчейне, традиционные институты получают всё больше влияния на выпуск, ценообразование, кастодию и дистрибуцию криптоактивов. Однако это не одностороннее поглощение, а взаимодополняющая конвергенция. Криптосфера приносит TradFi глобальную 24/7 ликвидность и программируемость, а TradFi предоставляет криптосфере регулируемые каналы, институциональное доверие и массовый доступ. Яркий пример — две противоположные, но ведущие к одной цели траектории: * **Путь А:** Криптобиржи, такие как Gate, начинают с токенизированных акций и CFD, а затем напрямую подключаются к инфраструктуре традиционных брокеров, предлагая реальную торговлю акциями США, Гонконга и Кореи за стейблкоины. * **Путь Б:** Традиционные брокеры, такие как Robinhood, интегрируют криптоактивы, а затем создают собственные Layer 2 для токенизации своих акций, стремясь к круглосуточной торговле. Обе стратегии нацелены на создание **универсального финансового аккаунта будущего** — единой точки доступа к акциям, криптовалютам, ETF, токенизированным облигациям и другим активам. Ключевой конкурентной борьбой становится не между CEX и брокерами, а между этими "супераккаунтами". Параллельно, слой RWA и токенизированных гособлигаций растёт даже на медвежьем рынке, становясь "прослойкой" для объединения капиталов. Хотя этот рынок (около $150 млрд токенизированных казначейских облигаций) ещё мал по сравнению с традиционным ($30 трлн), он демонстрирует устойчивый структурный тренд, привлекающий крупнейшие финансовые институты (JPMorgan, DTCC и др.). **Вывод:** "Уолл-стритизация" — это не поражение идеалов децентрализации, а формирование новой гибридной модели. Децентрализованные протоколы продолжают работать на базовом уровне, в то время как на уровне приложений и пользовательского опыта формируется более эффективный, глобальный и свободный объединённый рынок капитала, где активы TradFi и DeFi торгуются бок о бок в одном интерфейсе. Уолл-стрит не завоевала криптосферу, а криптосфера не обошла Уолл-стрит — они совместно строят новые финансовые рельсы.

marsbit16 ч. назад

Gate Research: Взлет «уолл-стритизации» криптофинансовых продуктов — это конкуренция или интеграция?

marsbit16 ч. назад

S&P Dow Jones и Pantera выпускают криптоиндекс, биткоин оставлен за бортом из-за «отсутствия прибыли»

Стандард энд Пурс (S&P Dow Jones Indices) совместно с Pantera Capital запускает индекс S&P Pantera Digital Asset Index. Новый индекс включает 18 токенов, но исключает биткоин, XRP и мем-токены. Критерием отбора послужила «финансовая жизнеспособность», по аналогии с S&P 500: протокол должен демонстрировать положительный доход в течение нескольких кварталов и распределять стоимость среди держателей токенов. Это первое применение фундаментального подхода к оценке криптоактивов со стороны крупнейшего в мире провайдера индексов. В первую пятерку активов вошли Ethereum (ETH), BNB, Solana (SOL), TRON (TRX) и Hyperliquid (HYPE). Pantera отмечает, что совокупный годовой доход всех протоколов индекса превышает $30 млрд. Биткоин был исключен по трем причинам: он рассматривается как монетарный актив, доступный через отдельные ETF; он не генерирует доход протокола; а смешивание его в индексе с доходными активами затрудняет фундаментальный анализ для институциональных инвесторов. Пока индекс является эталонным, но Pantera ведет переговоры о создании на его основе ETF и других инвестиционных продуктов. Компания также отмечает значительный разрыв на рынке: многие институциональные инвесторы готовы к аллокации в криптоактивы, но им не хватает структурированных продуктов, фокусирующихся на активах с реальной экономической деятельностью.

marsbit16 ч. назад

S&P Dow Jones и Pantera выпускают криптоиндекс, биткоин оставлен за бортом из-за «отсутствия прибыли»

marsbit16 ч. назад

Торговля

Спот

Популярные статьи

Как купить CORE

Добро пожаловать на HTX.com! Мы сделали приобретение CORE (CORE) простым и удобным. Следуйте нашему пошаговому руководству и отправляйтесь в свое крипто-путешествие.Шаг 1: Создайте аккаунт на HTXИспользуйте свой адрес электронной почты или номер телефона, чтобы зарегистрироваться и бесплатно создать аккаунт на HTX. Пройдите удобную регистрацию и откройте для себя весь функционал.Создать аккаунтШаг 2: Перейдите в Купить криптовалюту и выберите свой способ оплатыКредитная/Дебетовая Карта: Используйте свою карту Visa или Mastercard для мгновенной покупки CORE (CORE).Баланс: Используйте средства с баланса вашего аккаунта HTX для простой торговли.Третьи Лица: Мы добавили популярные способы оплаты, такие как Google Pay и Apple Pay, для повышения удобства.P2P: Торгуйте напрямую с другими пользователями на HTX.Внебиржевая Торговля (OTC): Мы предлагаем индивидуальные услуги и конкурентоспособные обменные курсы для трейдеров.Шаг 3: Хранение CORE (CORE)После приобретения вами CORE (CORE) храните их в своем аккаунте на HTX. В качестве альтернативы вы можете отправить их куда-либо с помощью перевода в блокчейне или использовать для торговли с другими криптовалютами.Шаг 4: Торговля CORE (CORE)С легкостью торгуйте CORE (CORE) на спотовом рынке HTX. Просто зайдите в свой аккаунт, выберите торговую пару, совершайте сделки и следите за ними в режиме реального времени. Мы предлагаем удобный интерфейс как для начинающих, так и для опытных трейдеров.

672 просмотров всегоОпубликовано 2024.03.29Обновлено 2026.06.02

Как купить CORE

Обсуждения

Добро пожаловать в Сообщество HTX. Здесь вы сможете быть в курсе последних новостей о развитии платформы и получить доступ к профессиональной аналитической информации о рынке. Мнения пользователей о цене на CORE (CORE) представлены ниже.

活动图片