За последние две недели ожидаемый восстановительный ралли в основном состоялся, при этом цена выросла к сопротивлению, прежде чем остановиться ниже себестоимости краткосрочных держателей, что подтверждает наличие значительного предложения сверху. На этом фоне данное издание исследует структуру и поведение этого избытка, с акцентом на формирующуюся динамику продавцов.
Восстановительный ралли встречает сопротивление
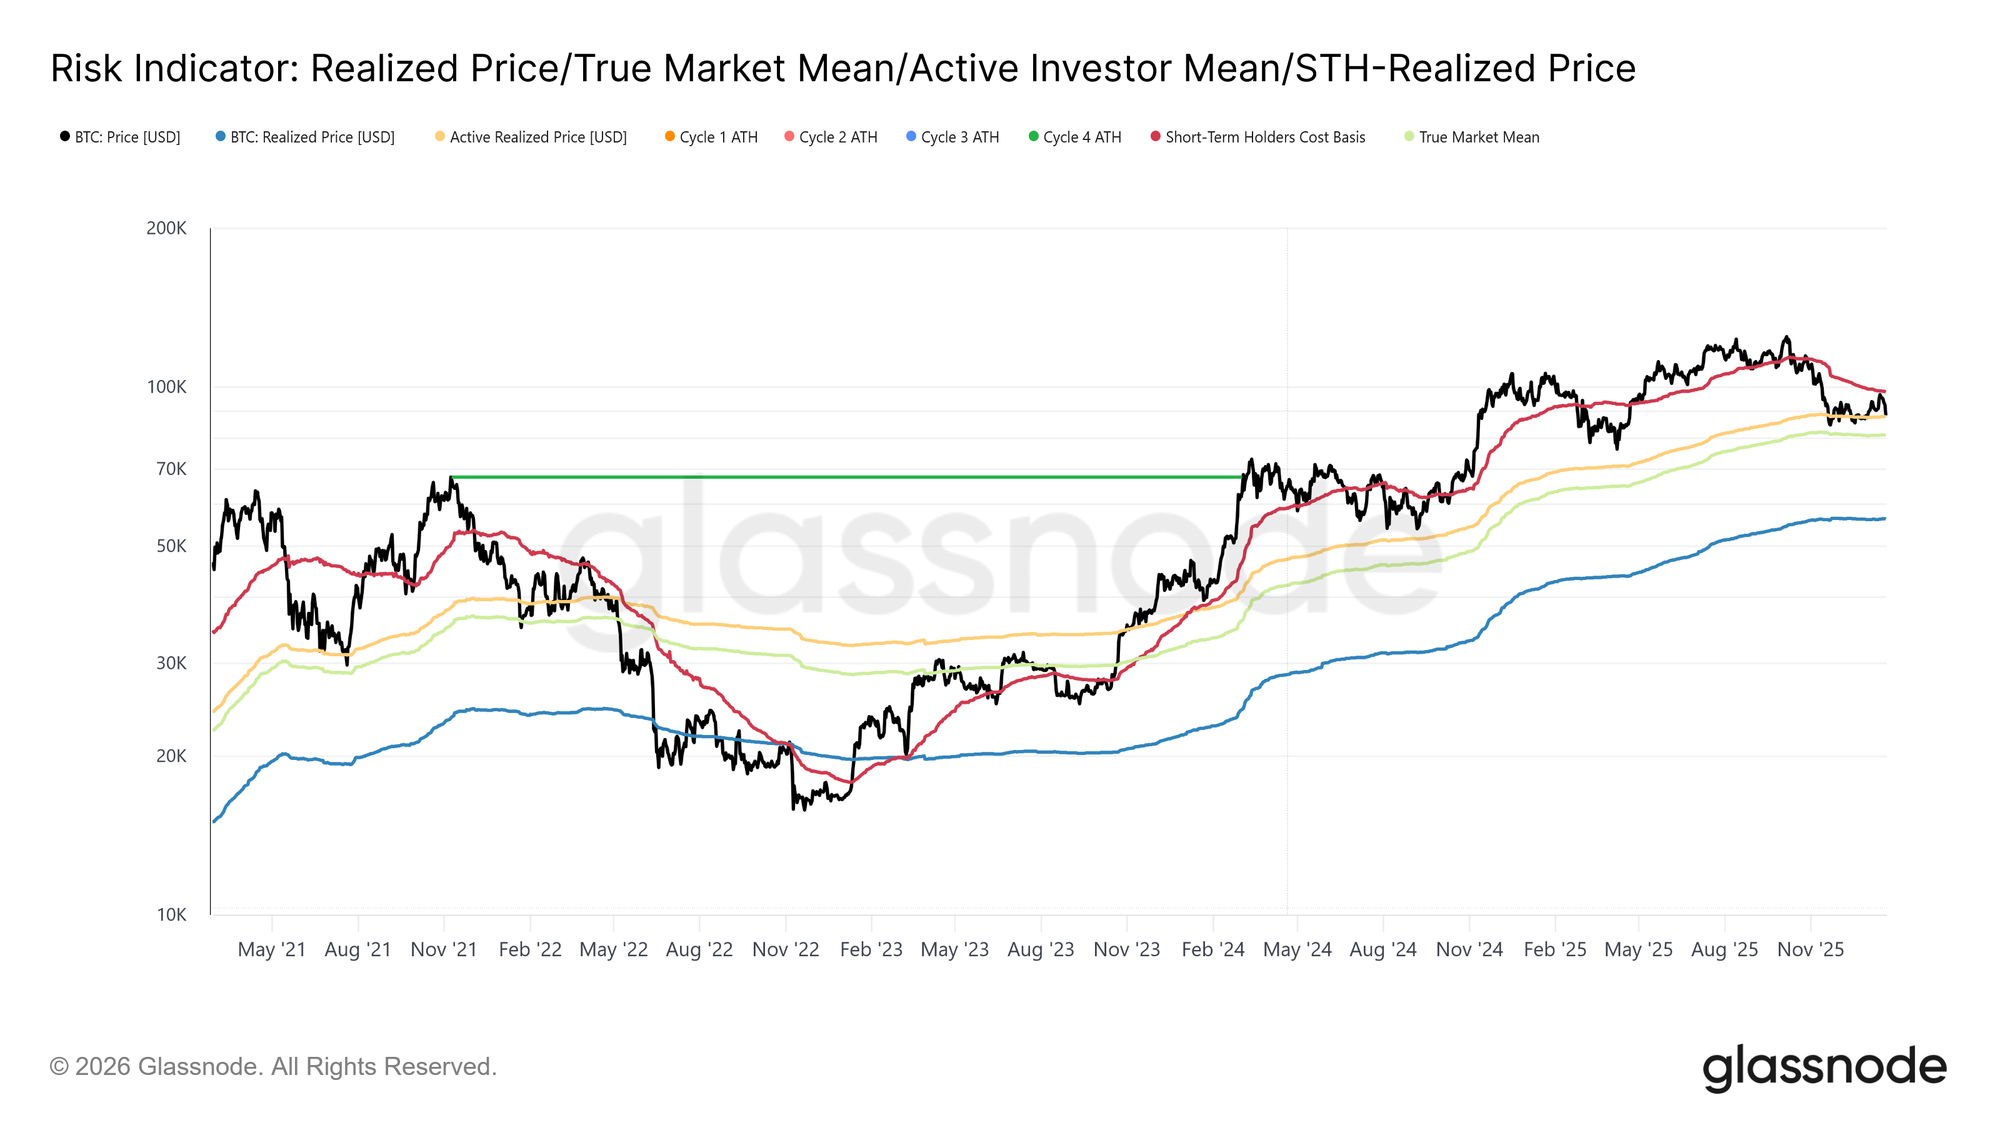
Обзор последних еженедельных ончейн-отчетов выявил последовательный нарратив. Рынок функционировал в рамках умеренной медвежьей фазы, ограниченной снизу Истинной Рыночной Средней на уровне $81,1 тыс., а сверху — себестоимостью краткосрочных держателей. Этот диапазон определял хрупкое равновесие, где давление на понижение поглощалось, но попытки роста неоднократно встречали дистрибуцию со стороны инвесторов, которые накапливали активы между первым и третьим кварталом 2025 года.
В начале января 2026 года признаки истощения продавцов открыли путь для отскока к верхней границе этого диапазона. Однако это движение было сопряжено с повышенным риском, поскольку цена приблизилась к региону ~$98 тыс., где предложение от недавних покупателей, выходящих в безубыток, становилось все более активным.
Недавнее отскок от себестоимости краткосрочных держателей на уровне ~$98,4 тыс. зеркалирует структуру рынка, наблюдавшуюся в первом квартале 2022 года, когда повторные неудачи в reclaim себестоимости недавних покупателей затягивали консолидацию. Это сходство подчеркивает хрупкость текущей попытки восстановления.
Избыток предложения сохраняется
Основываясь на этом отскоке от ключевых уровней безубыточности, более пристальный взгляд на распределение ончейн-предложения помогает прояснить, почему попытки роста продолжают останавливаться.
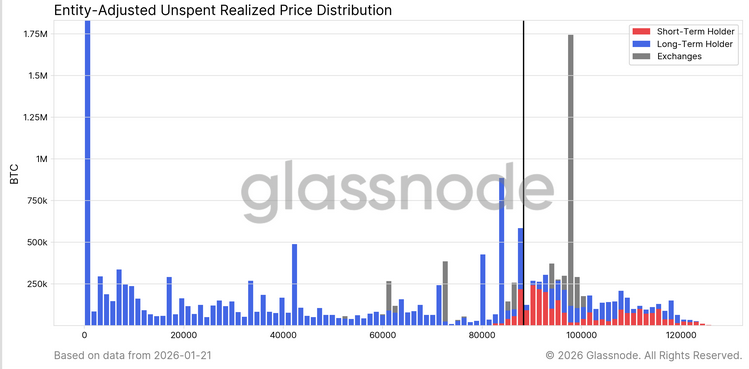
Чтобы дополнить нашу оценку того, почему избыточное предложение выше ~$98 тыс. остается доминирующей силой продавцов, ограничивающей кратко- и среднесрочные отскоки, диаграмма URPD предлагает особенно эффективную перспективу. Недавний ралли частично заполнил предыдущий воздушный зазор между ~$93 тыс. и $98 тыс., движимый перераспределением от крупных покупателей к новым участникам рынка, что видно как формирующиеся кластеры предложения краткосрочных держателей.
Однако переоценка распределения выше $100 тыс. reveals reveals широкую и плотную зону предложения, которая постепенно созревает в когорту долгосрочных держателей. Этот нерешенный избыток предложения остается постоянным источником давления продаж, который, вероятно, будет ограничивать попытки роста выше себестоимости STH в $98,4 тыс. и уровня $100 тыс.. Таким образом, для чистого пробоя потребовался бы значительный и устойчивый рост импульса спроса.
Лицом к лицу со созревающими продавцами
Расширяя анализ стороны предложения за пределы краткосрочных держателей, долгосрочное позиционирование усиливает то же структурное ограничение.
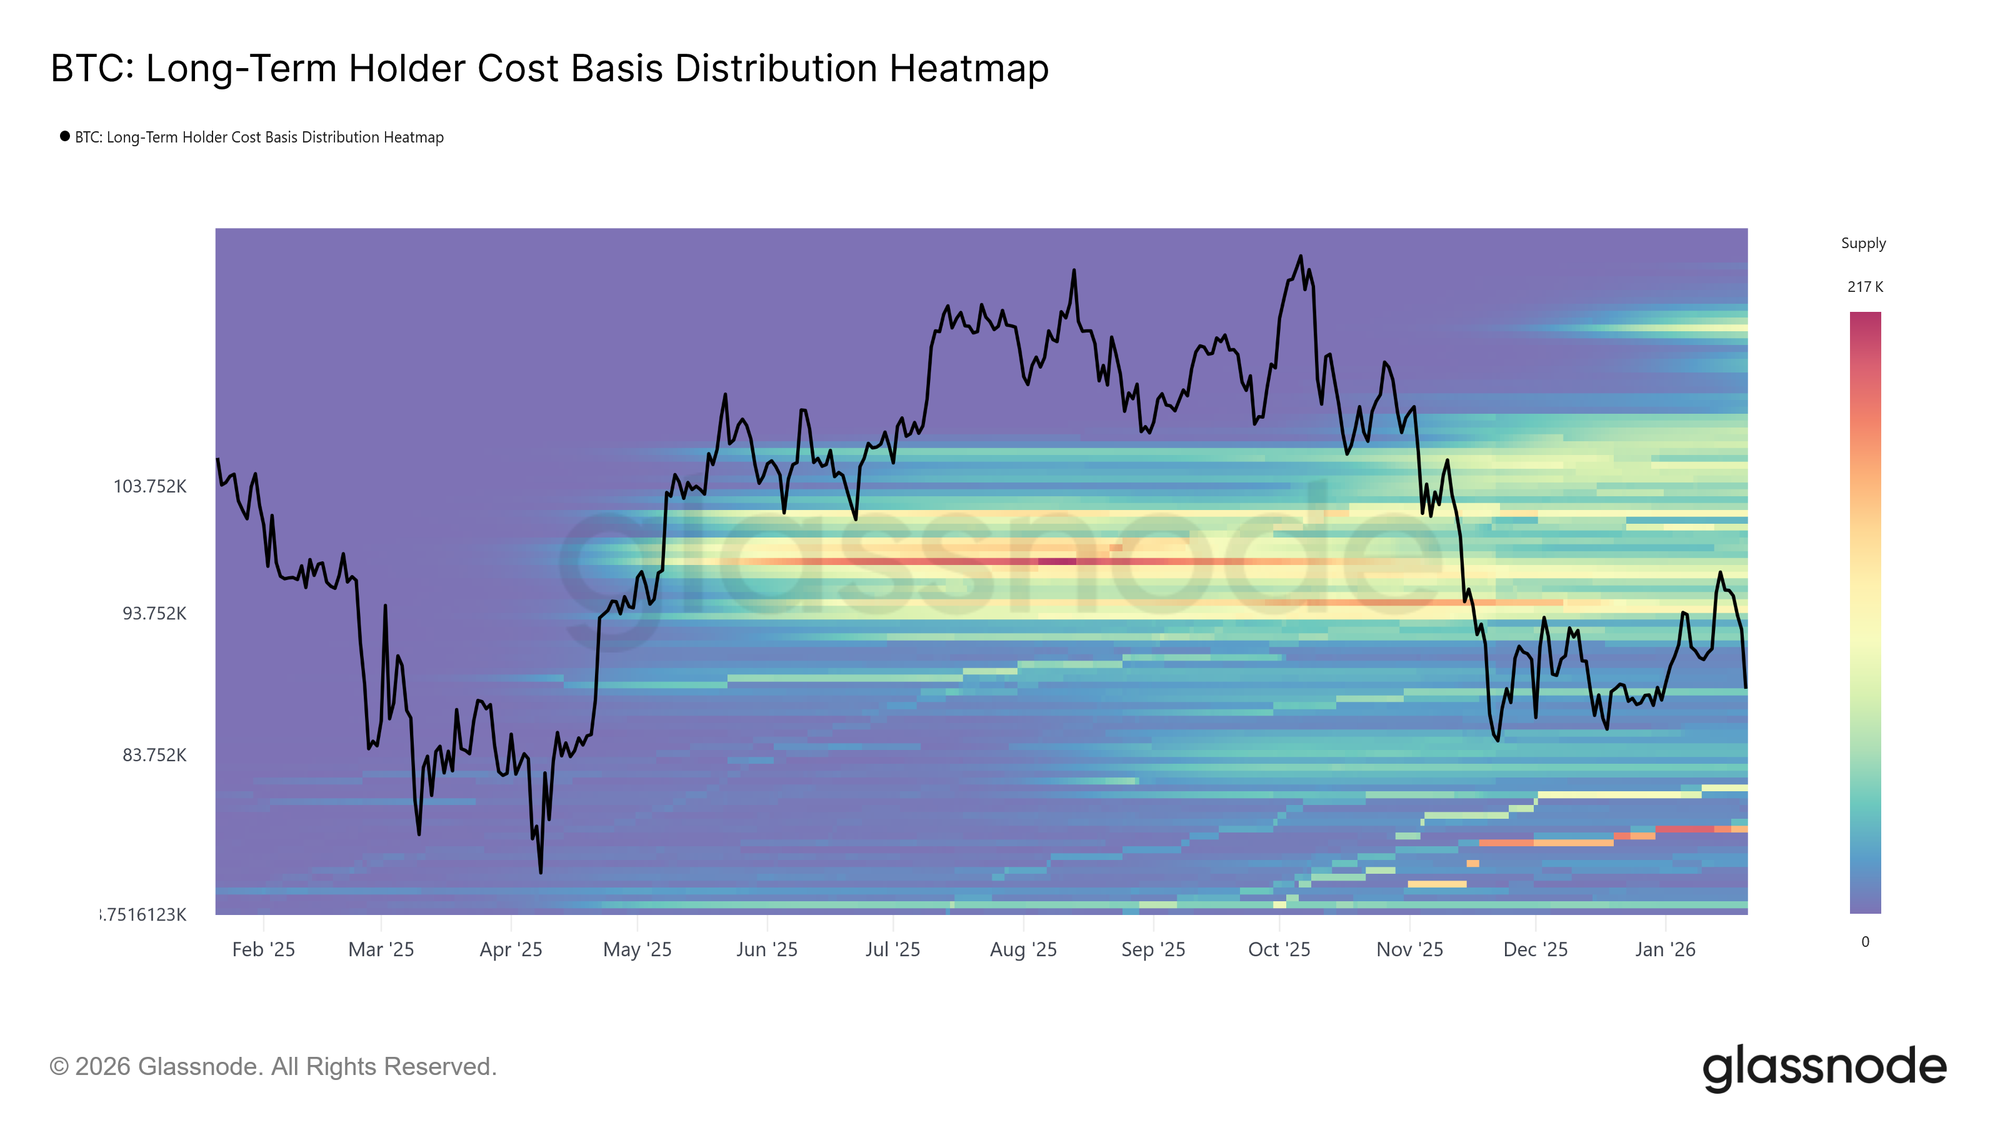
Тепловая карта распределения себестоимости долгосрочных держателей, которая отображает предложение долгосрочных держателей по цене приобретения, выделяет плотную концентрацию монет, удерживаемых выше текущего спотового уровня. Этот кластер представляет собой существенный пул потенциальной ликвидности продавцов, особенно в краткосрочной и среднесрочной перспективе, по мере приближения цены к предыдущим уровням входа.
Пока не появится новый спрос достаточной силы, чтобы поглотить это предложение сверху, долгосрочные держатели остаются скрытым источником сопротивления. В результате прогресс вверх, вероятно, останется ограниченным, а ралли уязвимы для возобновления дистрибуции, если этот избыток предложения не будет решительно устранен.
Дистрибуция в восстановительный ралли
Развивая картину стороны предложения далее, мы можем выделить, какие когорты инвесторов были наиболее активны в реализации стоимости и, в свою очередь, ограничивали недавнее продвижение к региону ~$98 тыс.
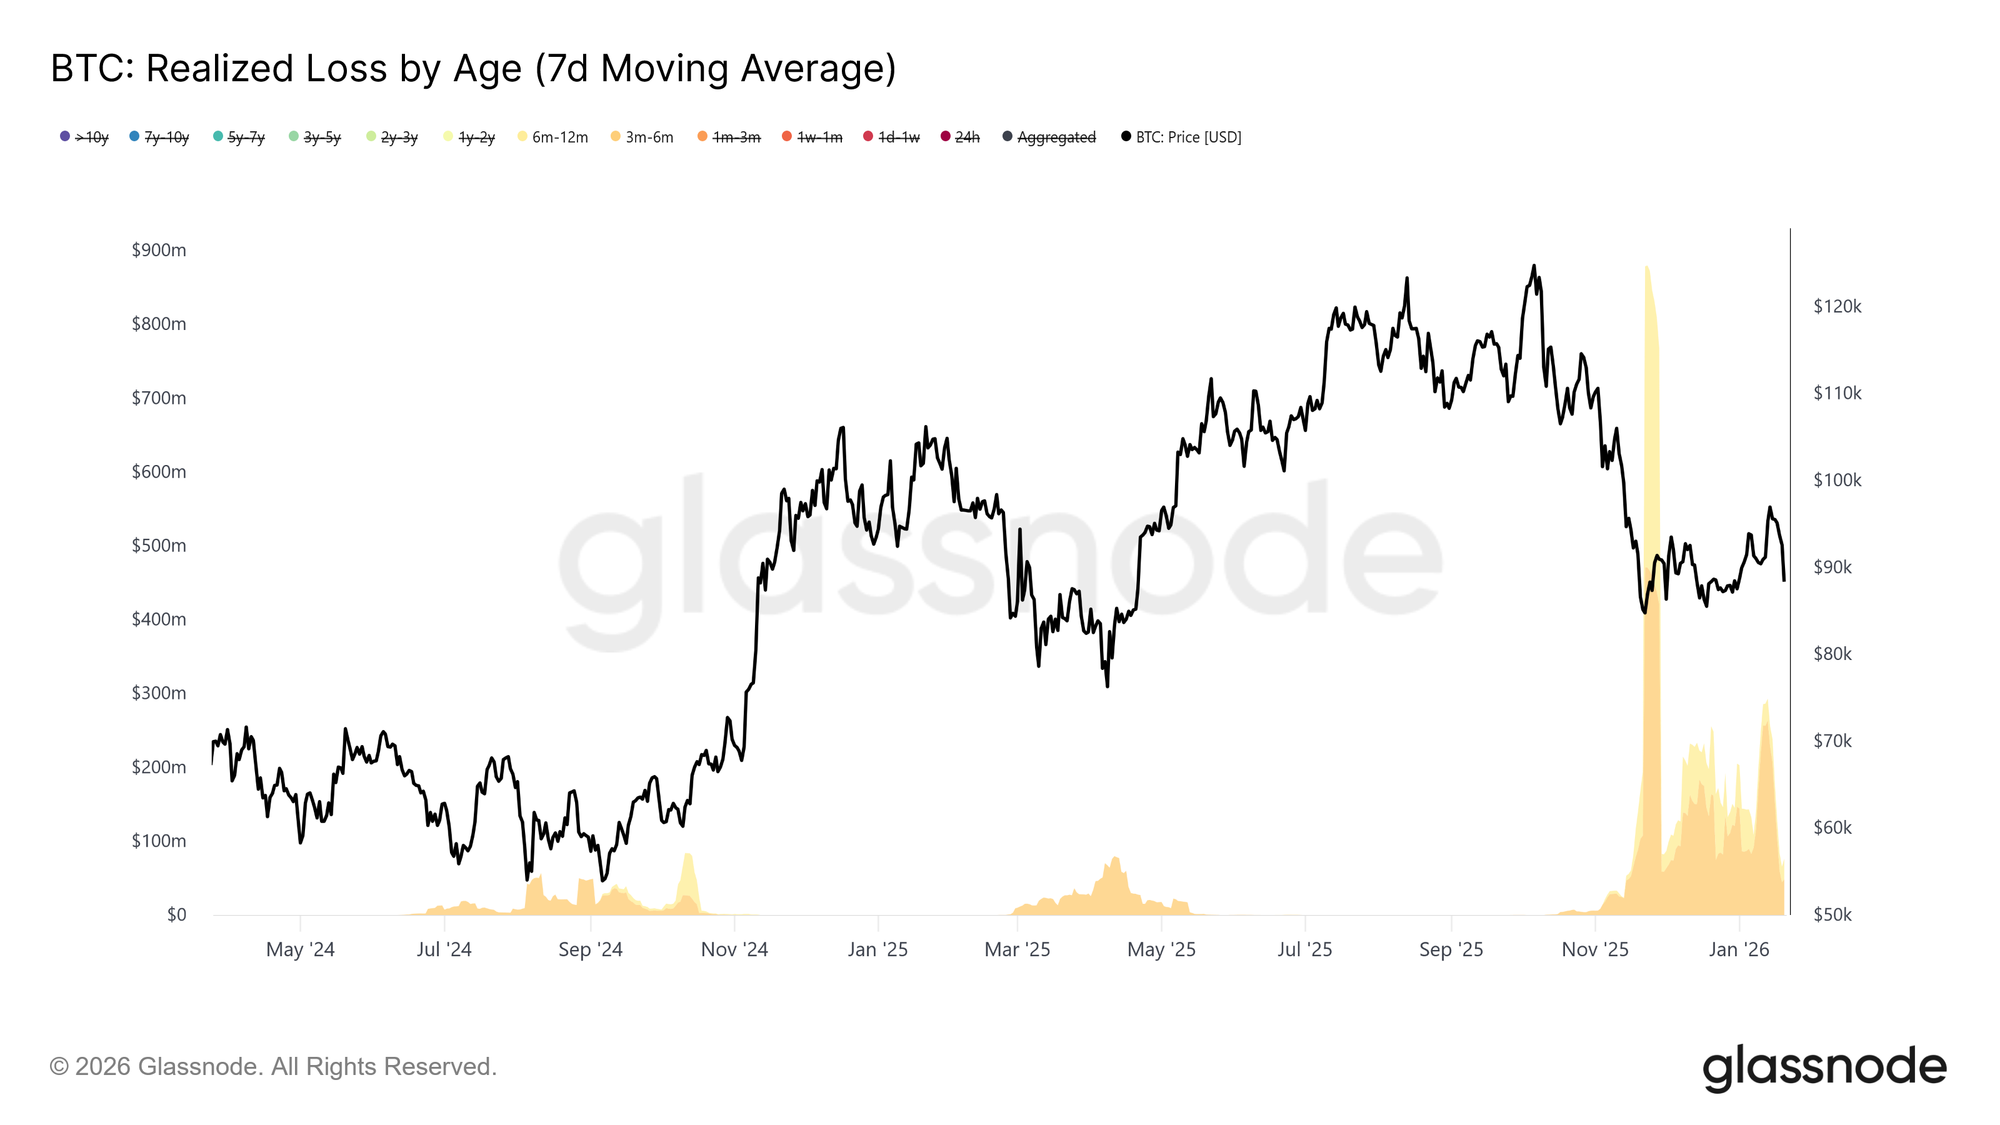
Обращаясь к метрике Реализованных Убытков по Возрасту, реализация убытков доминировала когортой 3–6 месяцев, с вторичным вкладом держателей 6–12 месяцев. Эта модель характерна для поведения, driven болью среди крупных покупателей, в частности инвесторов, которые накапливали монеты выше $110 тыс. и теперь выходят из позиций по мере возврата цены к их диапазону входа. Такая активность усиливает давление продавцов near ключевых порогов восстановления, поскольку эти когорты стремятся снизить экспозицию, а не повторно вступать в риск.
Дополняя выходы, driven убытками, поведение фиксации прибыли further проясняет, кто предоставляет ликвидность в недавнюю силу.
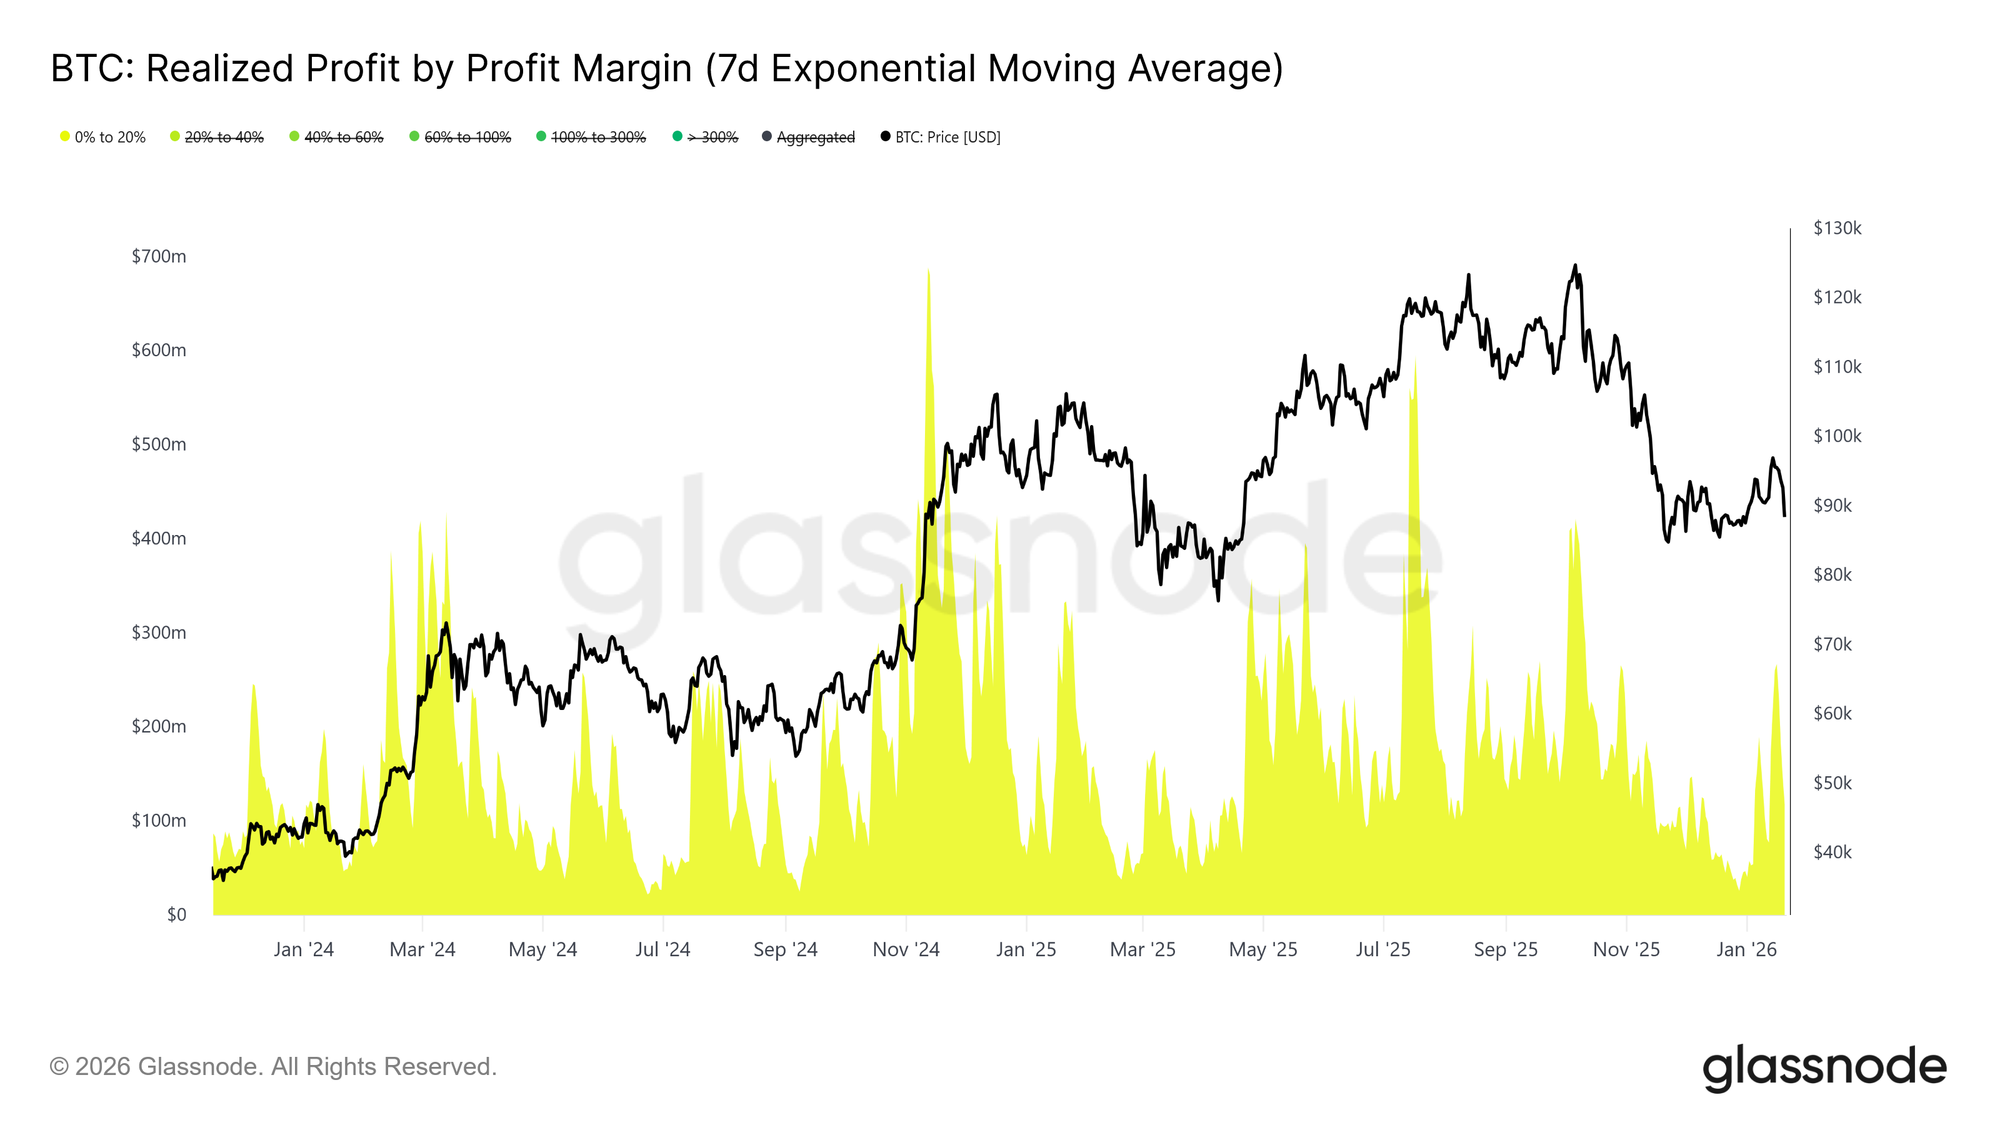
Со стороны фиксации прибыли, метрика Реализованной Прибыли по Марже Прибыли показывает заметное увеличение доли прибыли, captured когортой с маржой от 0% до 20%. Этот сдвиг highlights влияние продавцов в безубыток и краткосрочных свинг-трейдеров, которые предпочитают выходить из позиций с относительно небольшой прибылью, а не удерживать для продолжения тренда.
Такое поведение типично для переходных рынков, где убежденность остается хрупкой, и участники prioritize сохранение капитала и тактическую прибыль. Этот растущий вклад от реализаций с низкой маржой активно ограничивает восходящий импульс, поскольку предложение высвобождается на nearby уровнях себестоимости.
Офф-чейн инсайт
Спотовые потоки становятся конструктивными
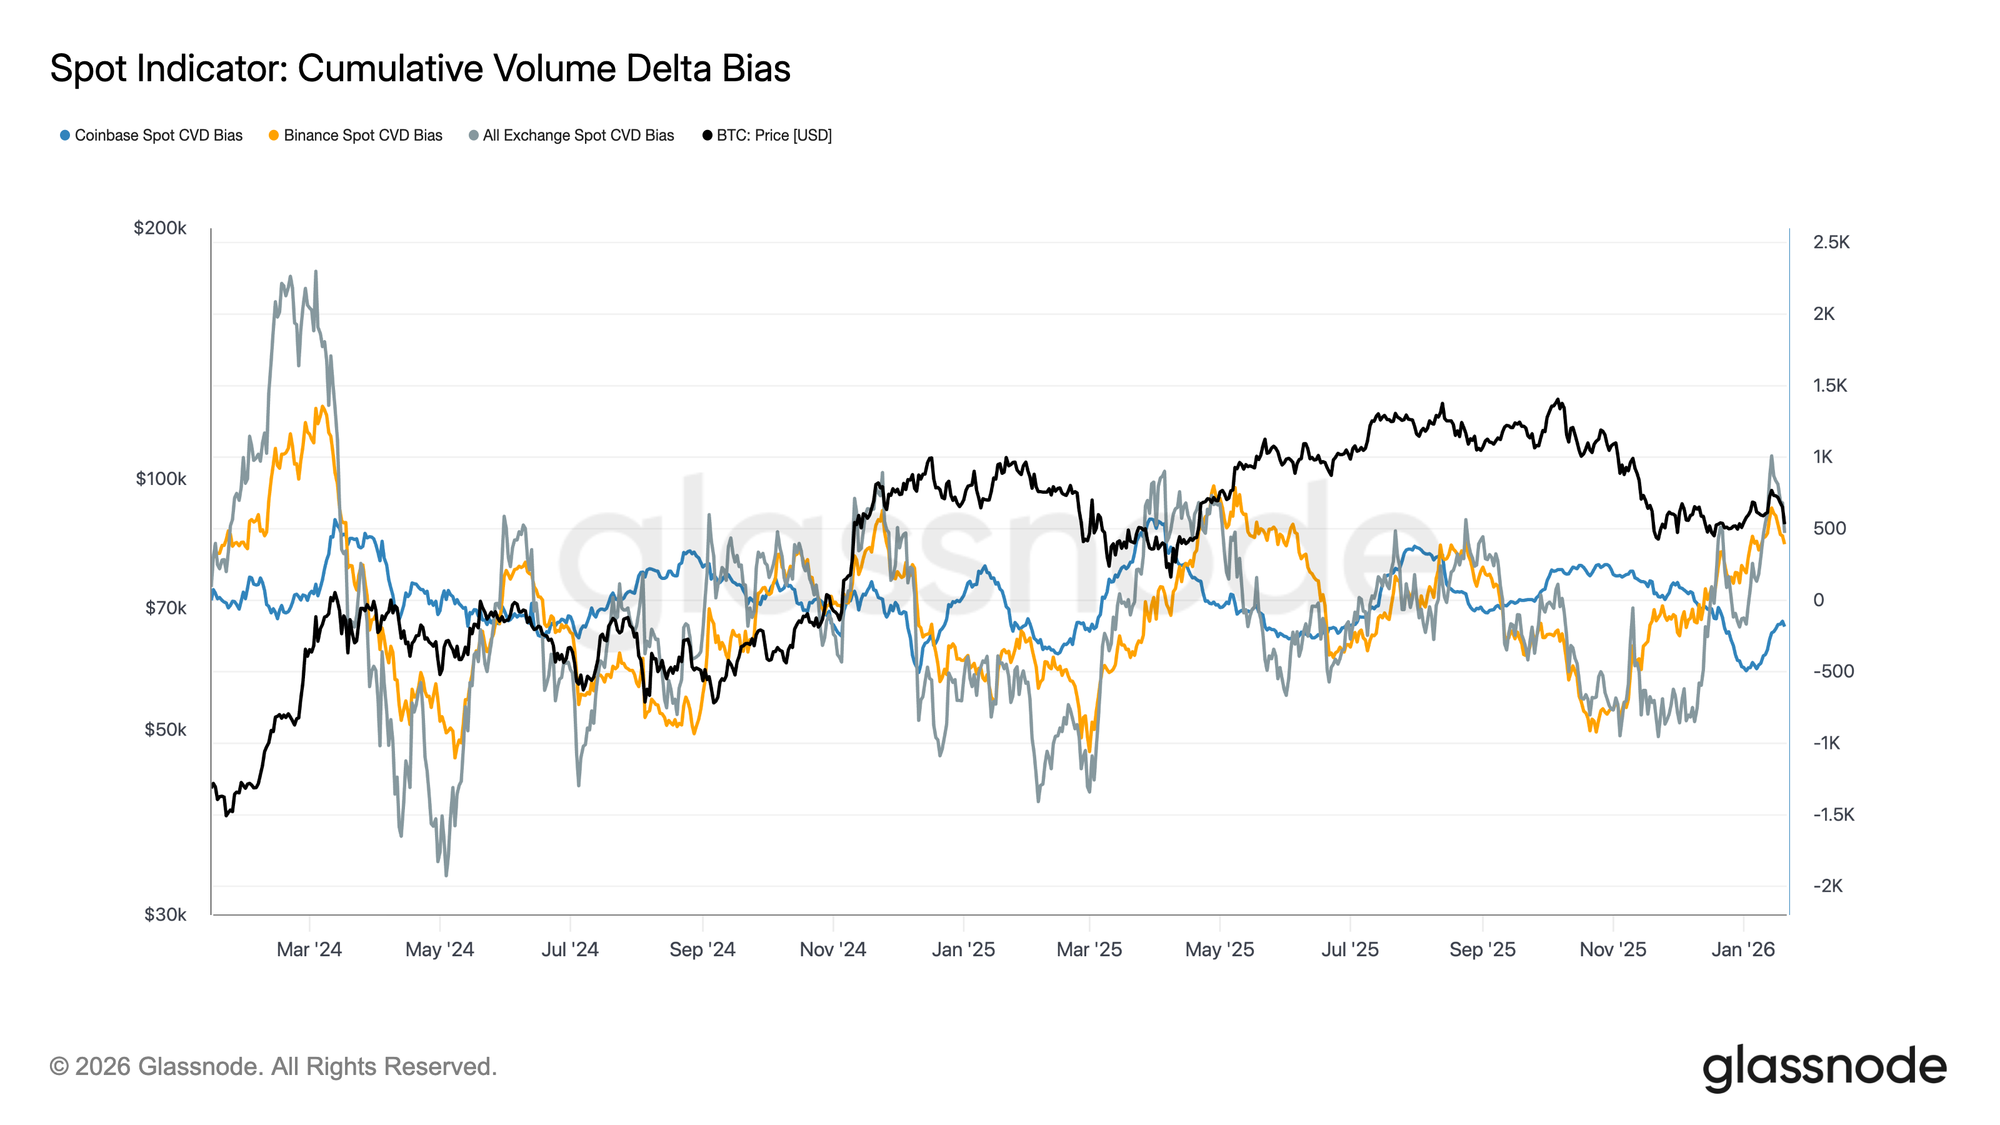
Поведение спотового рынка начало улучшаться после недавнего снижения, при этом меры CVD на Binance и агрегированные биржевые меры вернулись к buy-доминирующему режиму. Это знаменует собой отход от устойчивого давления продавцов, которое определяло предыдущую консолидацию, и указывает на то, что спотовые участники вновь поглощают предложение, а не распределяют в силу.
Coinbase, который был постоянным источником агрессии продавцов на протяжении большей части диапазонного периода, также увидел meaningful замедление чистых продаж. Смягчение дистрибуции, led Coinbase, уменьшило предложение сверху, helping стабилизировать price action и поддержать недавнее восстановление.
Хотя участие спота еще не демонстрирует устойчивого, агрессивного накопления, typically наблюдаемого during фаз полного расширения тренда, переход обратно к чистым покупкам на основных площадках представляет собой конструктивное улучшение базовой структуры спотового рынка.
Корпоративные казначейские потоки остаются избирательными
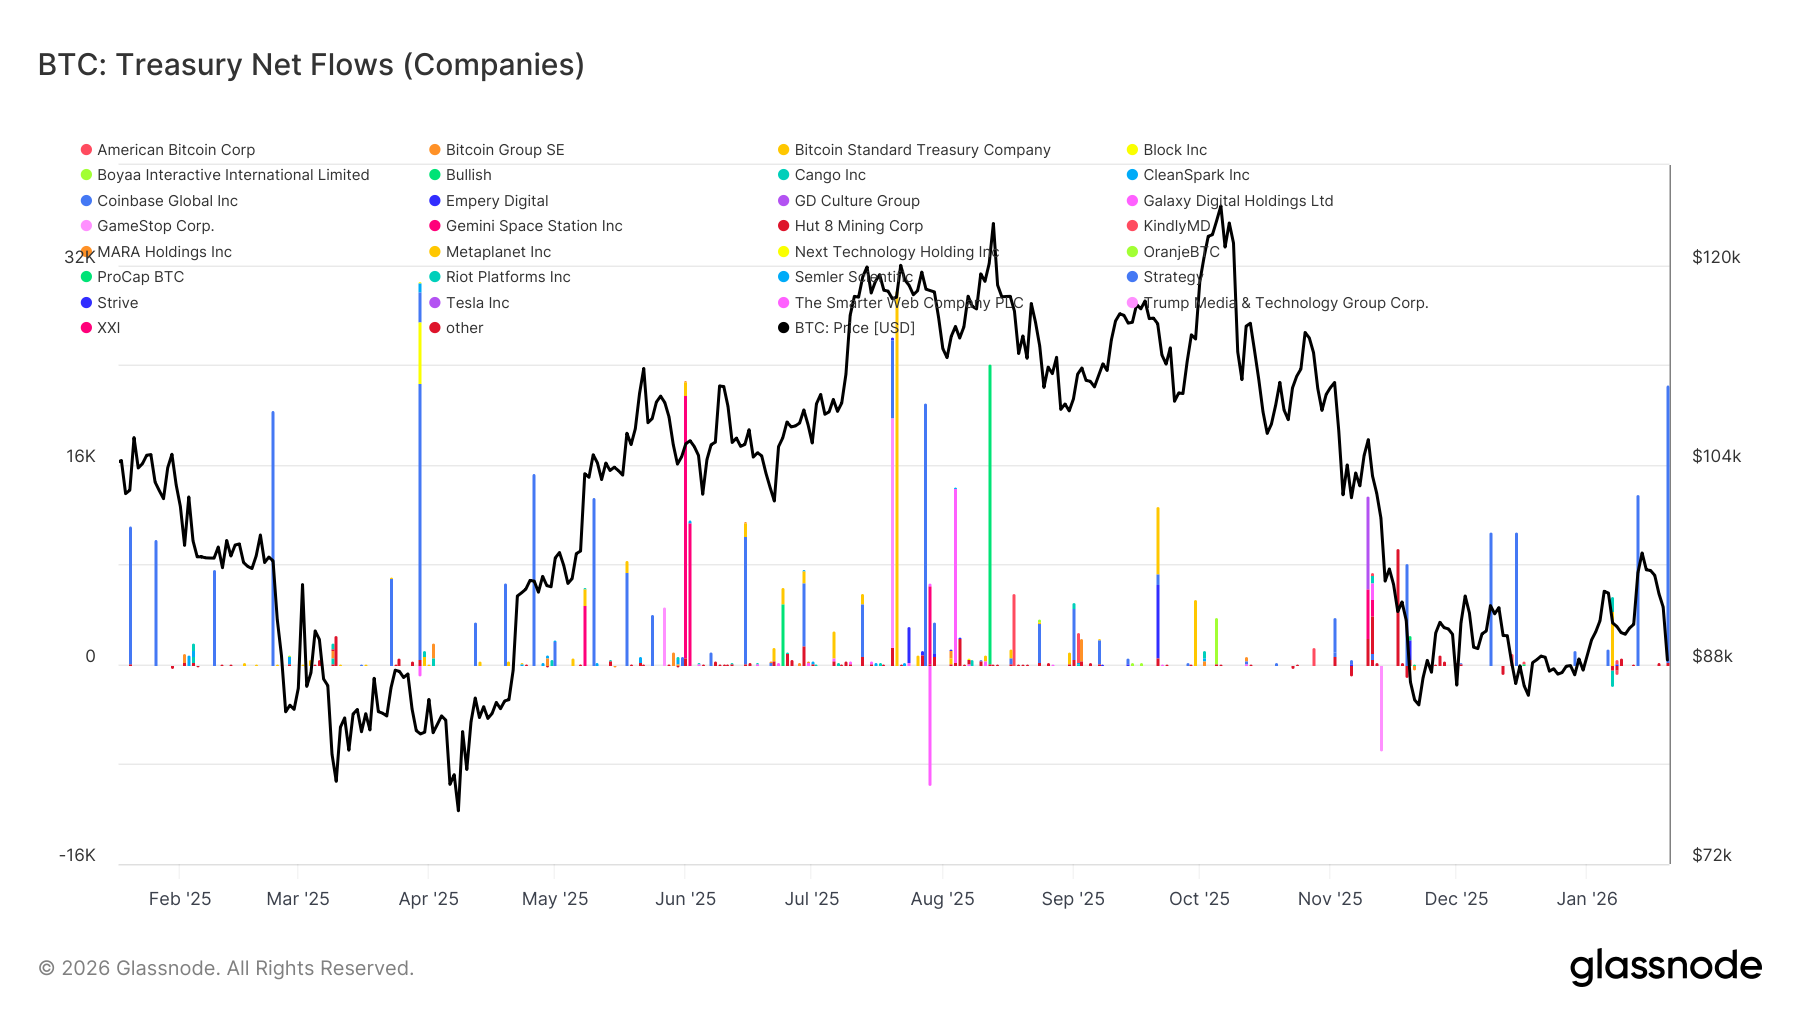
Недавние чистые потоки корпоративных казначейств остаются спорадическими и неравномерными, с активностью, сконцентрированной в изолированных, event-driven сделках, а не в широкомасштабном накоплении. Хотя несколько отдельных entities показали заметные всплески притока за последние несколько недель, совокупный корпоративный спрос еще не перешел в режим устойчивого накопления.
В целом, потоки колебались tightly near нейтральной отметки, указывая на то, что большинство корпоративных казначейств в настоящее время неактивны или действуют opportunity, а не масштабируют стратегическую экспозицию. Это контрастирует с более ранними периодами, когда скоординированные притоки от multiple entities более тесно совпадали с ускорением тренда.
В целом, последние данные предполагают, что корпоративные казначейства действуют как маргинальный, избирательный источник спроса, вносящий эпизодический вклад, но еще не оказывающий решающего влияния на более широкую динамику цен.
Активность на деривативах остается низкой
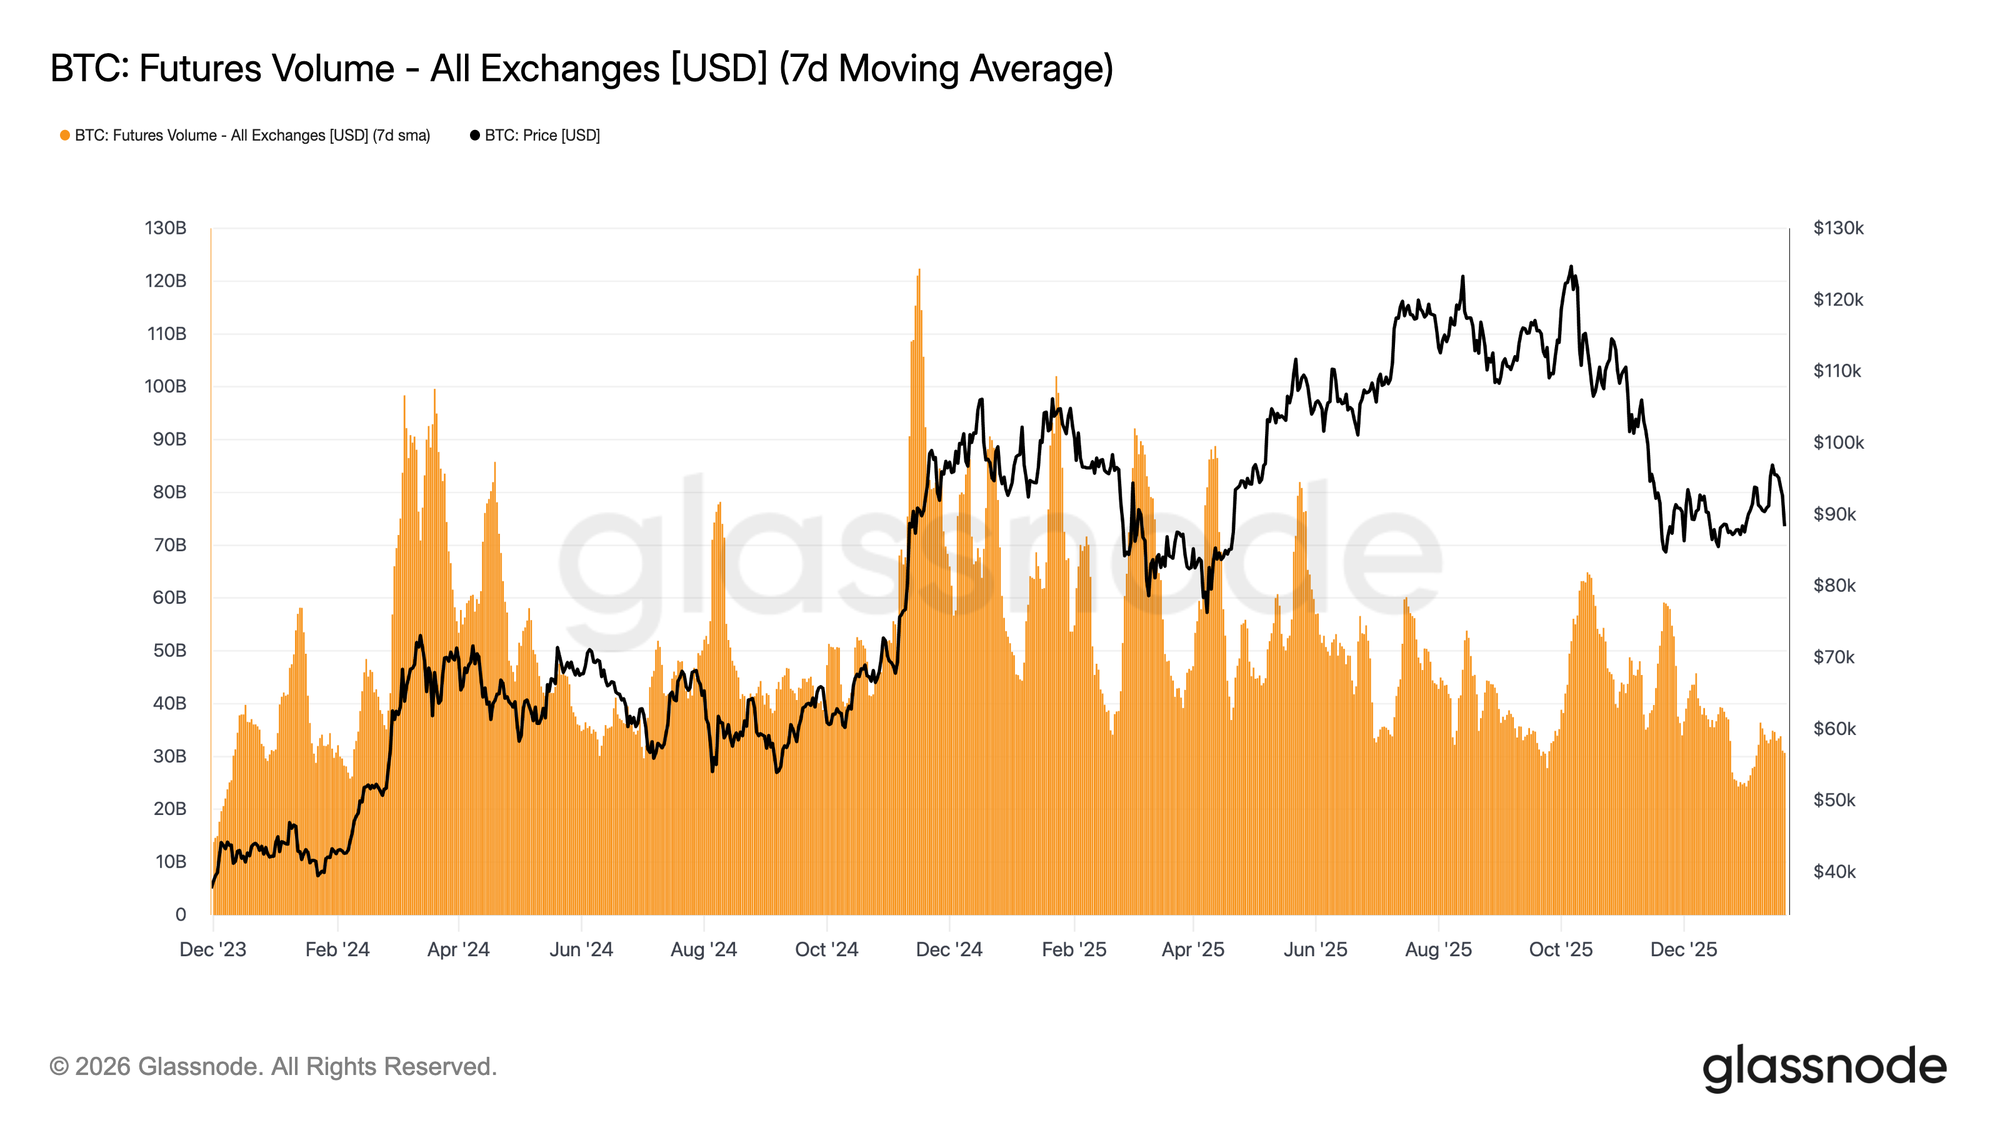
Объем торгов фьючерсами BTC продолжает сокращаться на основе скользящей средней за 7 дней, при этом активность остается значительно ниже уровней, typically ассоциируемых с устойчивым формированием тренда. Недавние движения цен произошли при отсутствии meaningful расширения объема, highlighting рынок деривативов, characterized низким участием и ограниченной убежденностью.
Текущая структура предполагает, что большая часть недавнего price action была driven низкой ликвидностью, а не агрессивным позиционированием. Корректировки открытого интереса произошли без соответствующего увеличения торгуемого объема, указывая на churn позиционирования и recycling риска, а не на развертывание свежего leverage.
В целом, рынки деривативов в настоящее время напоминают среду с низкой вовлеченностью, со muted спекулятивным интересом и sparse участием. Этот «город-призрак» профиль подразумевает рынок, который highly чувствителен к любому возобновлению объема, но пока остается reactive, а не оказывает major влияния на price discovery.
Подразумеваемая волатильность реагирует только на коротком конце
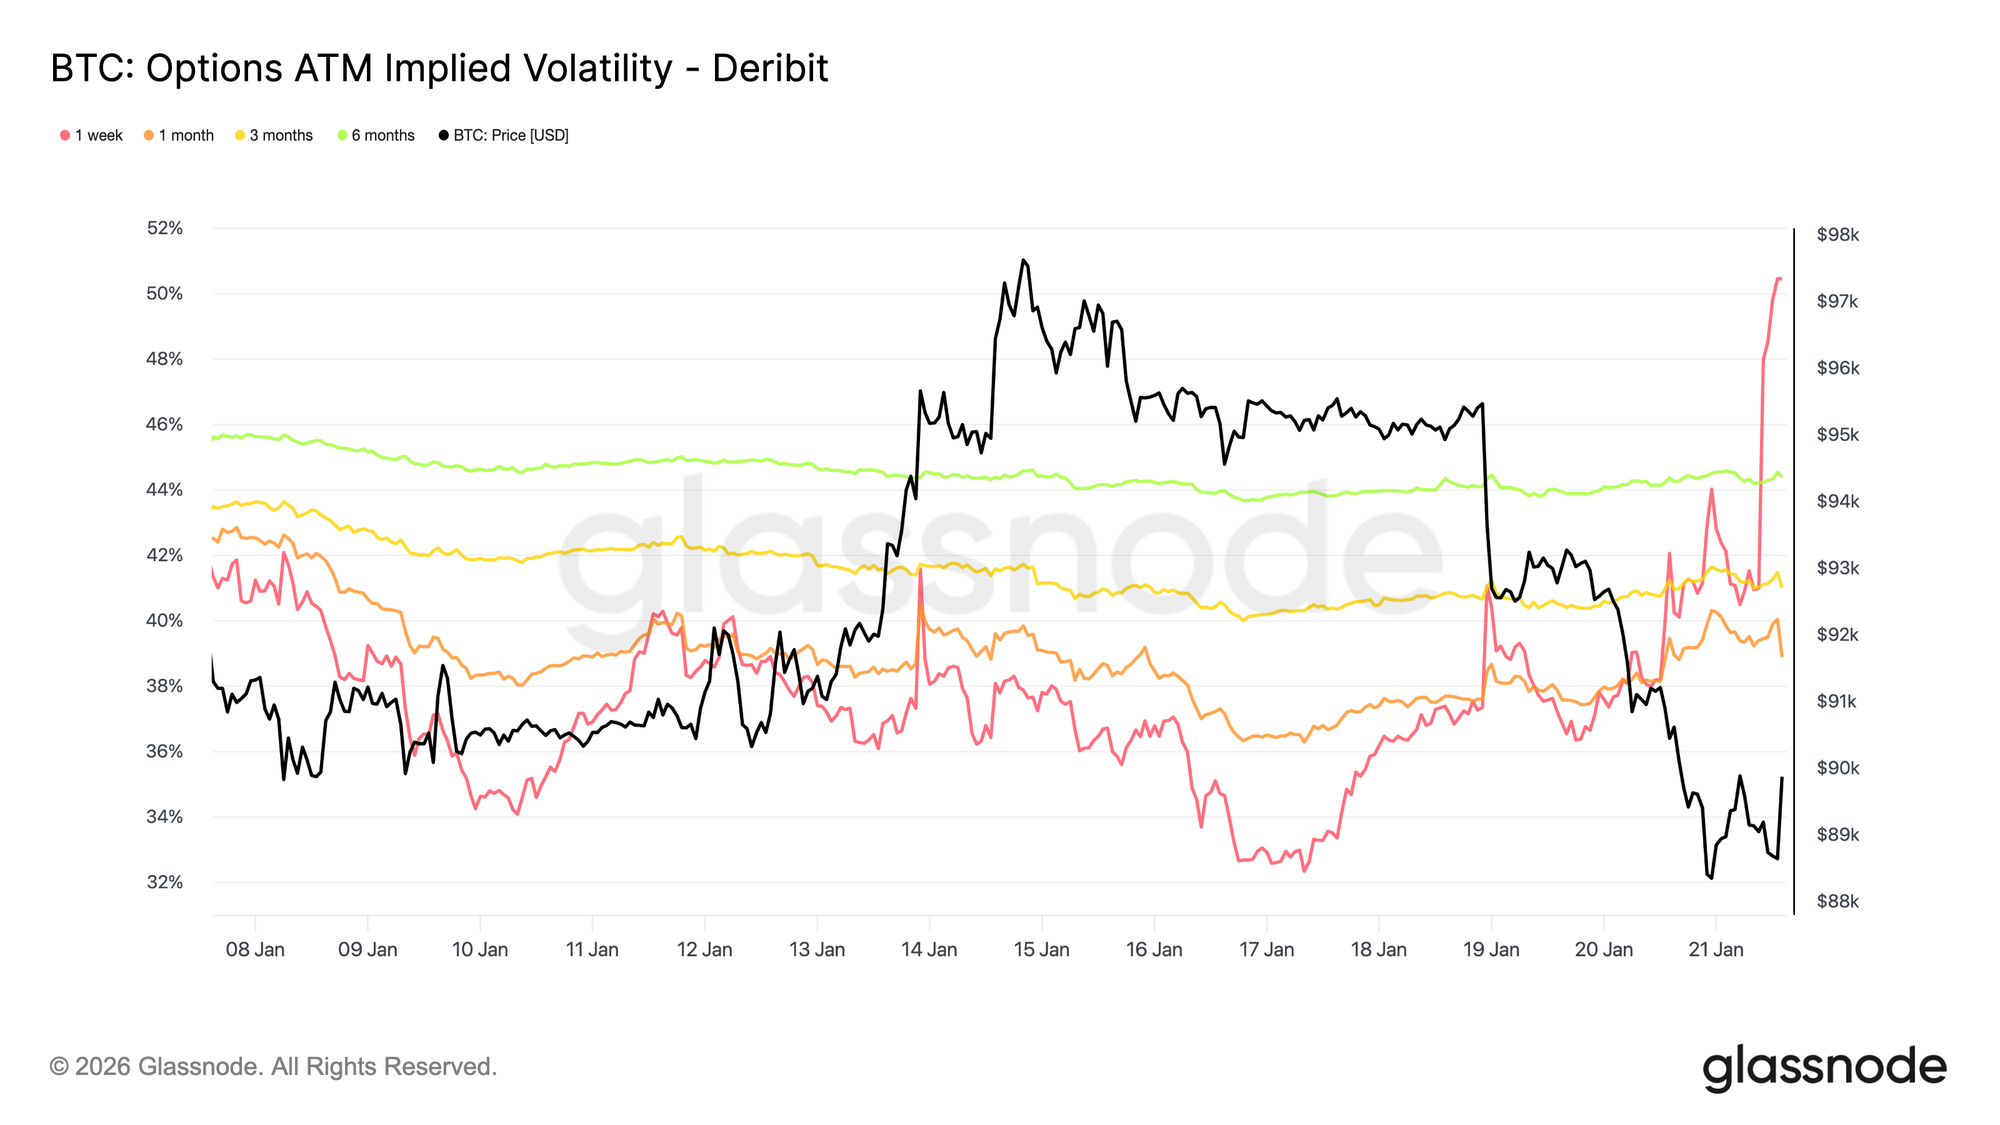
Спотовое снижение, driven макроэкономическими и геополитическими заголовками, вызвало реакцию только в краткосрочной волатильности. Недельная подразумеваемая волатильность выросла более чем на 13 пунктов волатильности с распродажи в воскресенье, в то время как трехмесячная подразумеваемая волатильность выросла примерно на 2 пункта, а шестимесячная подразумеваемая волатильность barely moved.
Это резкое ужесточение на самом коротком конце кривой волатильности показывает, что трейдеры реагируют тактически, а не пересматривают среднесрочный риск. Когда корректируется только краткосрочная подразумеваемая волатильность, это отражает event-driven неопределенность, а не более широкий сдвиг режима волатильности.
Рынок оценивает кратковременный риск, а не длительное disruption.
Краткосрочный скос агрессивно колеблется
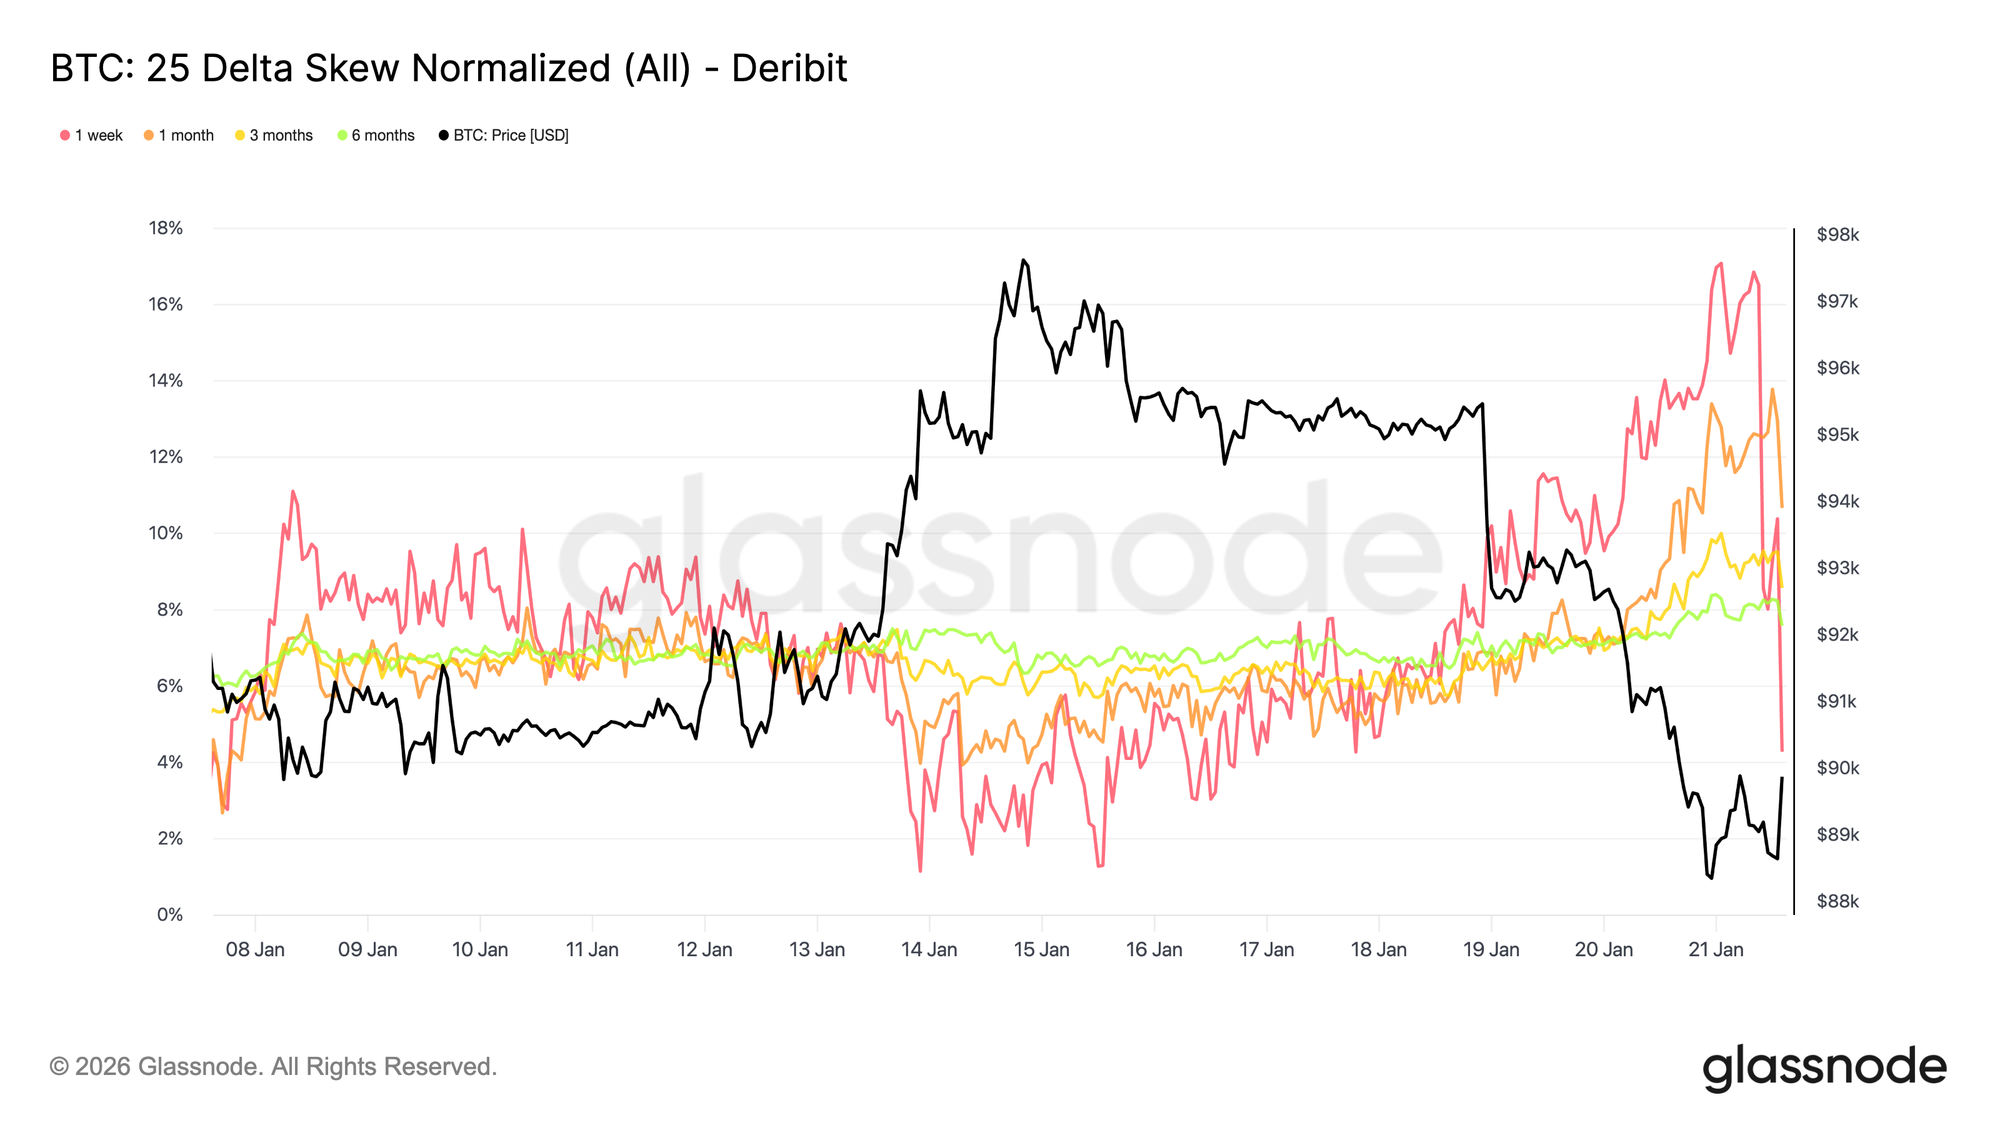
Так же, как и ATM подразумеваемая волатильность, краткосрочный скос led корректировкой, при этом недельный 25 дельта скос резко сместился в сторону put richness после того, как неделю назад находился close к равновесию.
С прошлой недели недельный 25 дельта скос переместился roughly на 16 пунктов волатильности в сторону путов, достигнув close к 17 процентам put richness. Месячный скос также отреагировал, в то время как более длинные сроки погашения остаются firmly на территории путов, лишь marginally склоняясь further в сторону снижения.
Когда скос наклоняется так агрессивно, это часто совпадает с локальными экстремумами, где позиционирование становится перегруженным, и рынок struggles расширяться в том же направлении. После выступления Трампа в Давосе, downside richness был faded и монетизирован, и скос начал revert, almost так же быстро, как и двигался выше.
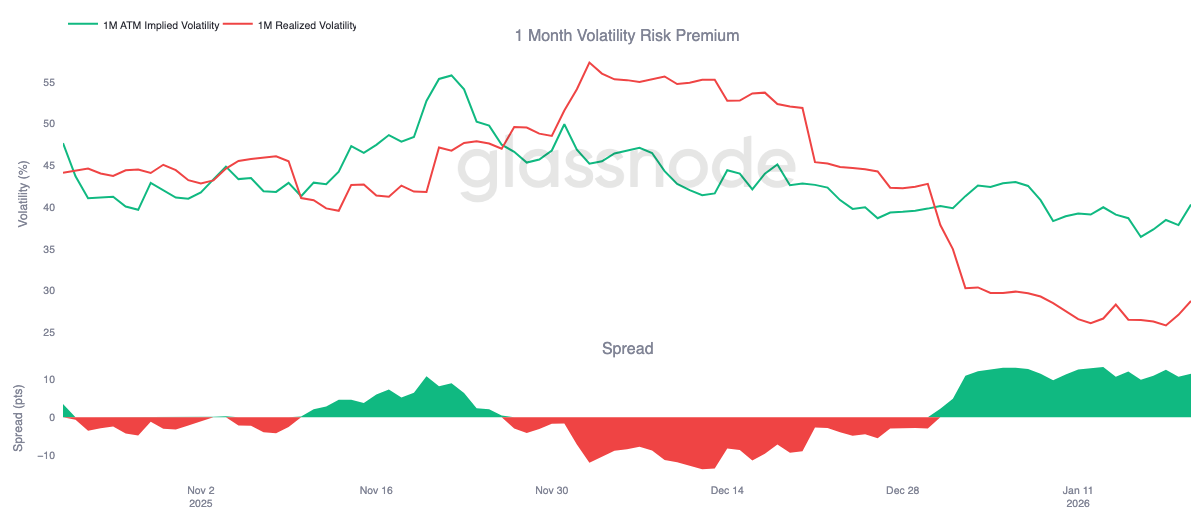
Премия за риск волатильности остается повышенной
Месячная премия за риск волатильности остается положительной, как и с начала года. Хотя подразумеваемая волатильность historically низка в абсолютном выражении, она продолжает оцениваться выше реализованной волатильности. Другими словами, опционы все еще дороги relative к фактическому движению цены, которое materialized.
Премия за риск волатильности captures разрыв между подразумеваемой и реализованной волатильностью. Положительная премия означает, что продавцы опционов получают compensation за принятие риска волатильности. Это создает благоприятную среду carry для short volatility стратегий, где удержание short gamma позиций генерирует доход, пока реализованные движения остаются contained.
Эта динамика усиливает сжатие волатильности. Пока продажа волатильности остается прибыльной, больше участников готовы engage, удерживая подразумеваемую волатильность anchored. По состоянию на 20 января, месячный спред волатильности составлял around 11,5 пунктов волатильности в пользу продавцов, highlighting, насколько supportive текущие условия остаются для поведения продажи волатильности.
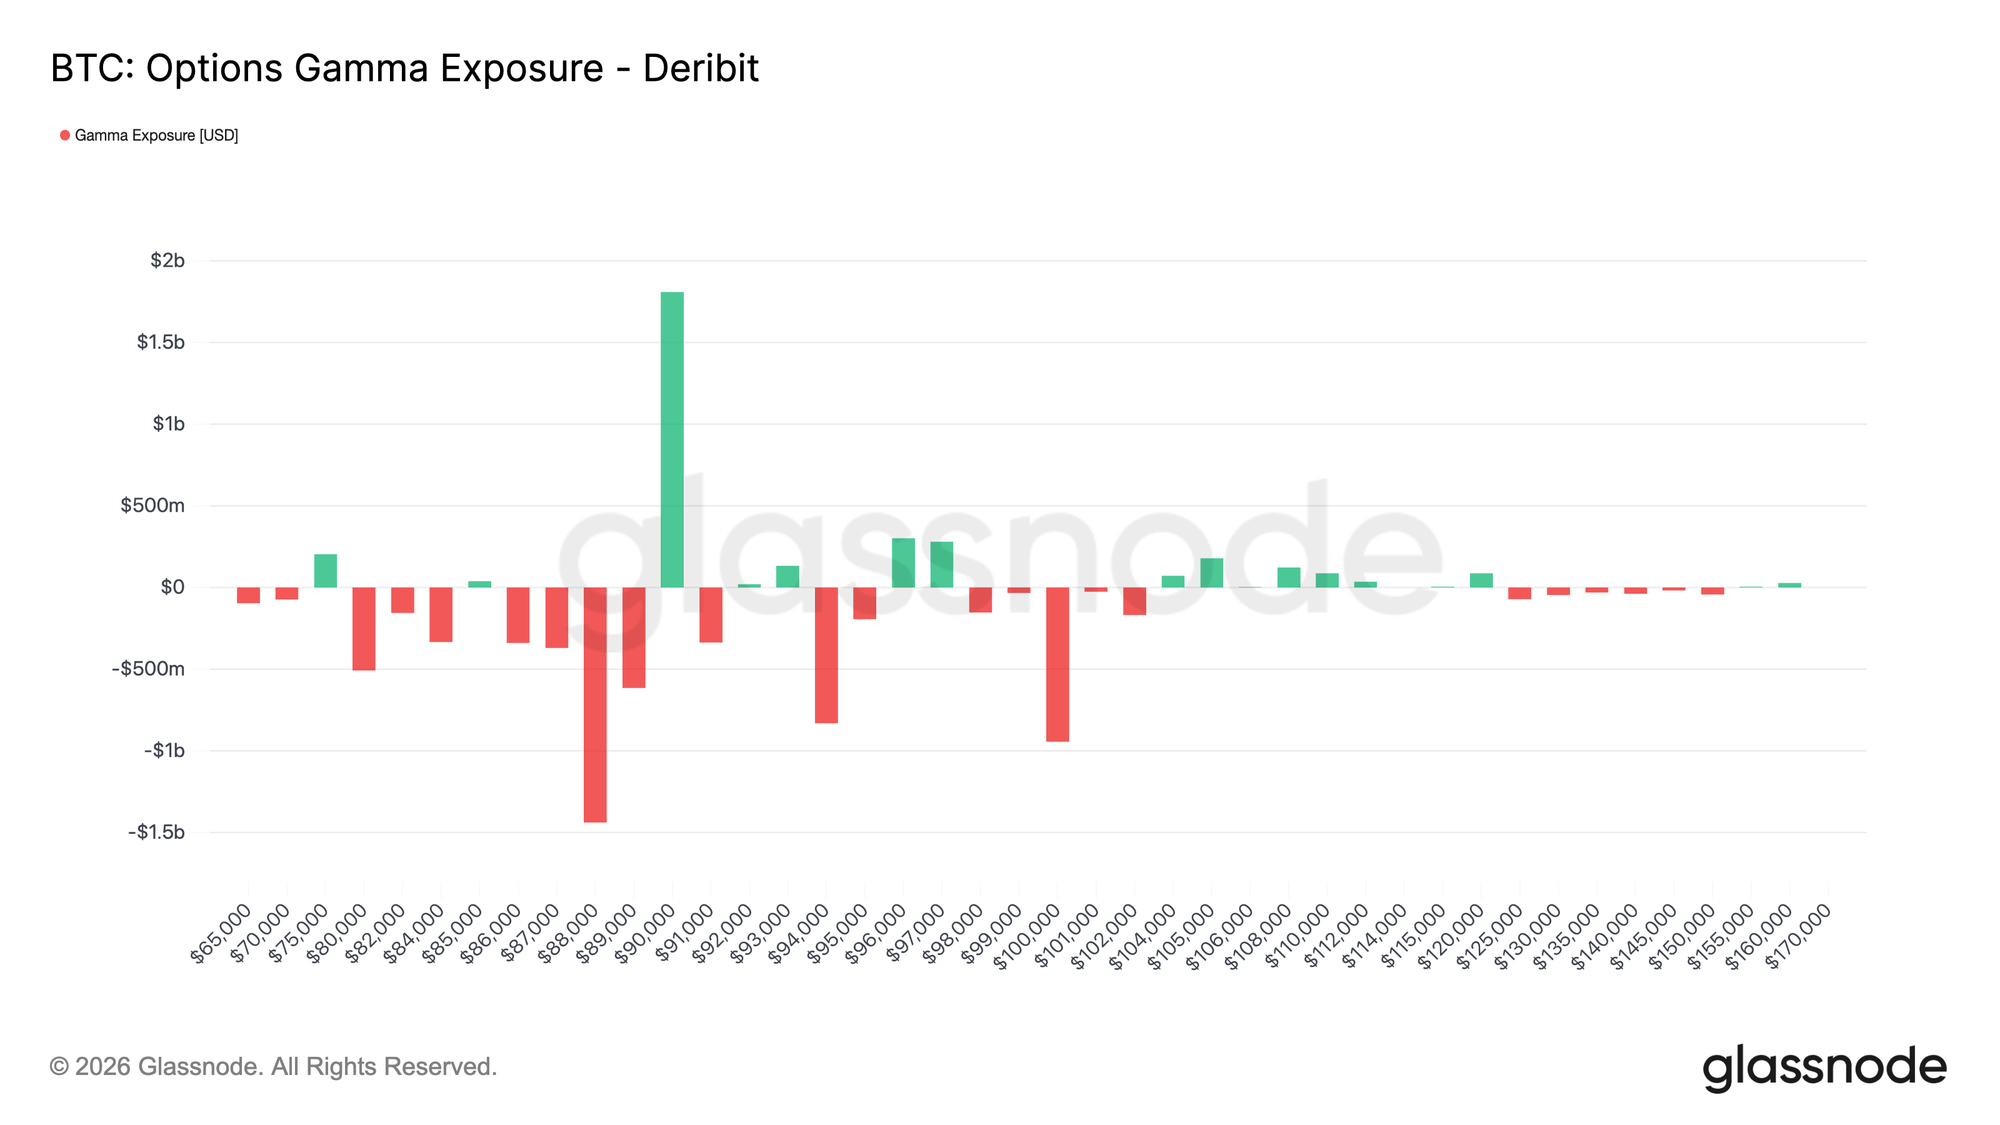
Позиционирование гаммы дилеров смещается вниз
Позиционирование гаммы дилеров помогает framing структурные силы, shaping краткосрочное ценовое поведение. Недавний поток показывает, что тейкеры активно предлагают защиту от снижения, pushing дилеров short gamma ниже уровня 90k. В то же время, некоторые тейкеры финансировали эту защиту, продавая upside, оставляя дилеров long gamma выше этого ключевого страйка 90k.
Это создает асимметричную setup. Ниже 90k, дилеры being short gamma означает, что движения вниз могут ускориться, поскольку хеджи adjusted через продажу фьючерсов или спота. Выше 90k, dealer long gamma вводит стабилизирующую силу, так как ралли tend встречаться с хеджирующими потоками, которые dampen продолжение.
В результате, price action остается хрупким ниже 90k, в то время как сам этот уровень, вероятно, будет действовать как точка трения. Устойчивое reclaim его потребовало бы sufficient импульса и уверенности, чтобы поглотить хеджирующие потоки дилеров и сместить экспозицию гаммы выше.
Заключение
Биткоин остается в режиме низкого участия, при этом price action driven больше отсутствием давления, чем активной убежденностью. Ончейн-данные продолжают отражать избыток предложения и хрупкую структурную поддержку, в то время как спотовые потоки, хотя и улучшаются, еще не перешли в режим устойчивого накопления.
Институциональный и корпоративный спрос остается осторожным, при этом казначейские потоки стабилизируются near нейтральной отметки, а активность сконцентрирована в изолированных сделках. Участие в деривативах остается низким, с сжатым объемом фьючерсов и subdued развертыванием leverage, усиливая среду с низкой ликвидностью, где цена increasingly чувствительна к скромным сдвигам позиционирования.
Рынки опционов echo это сдержанность. Переоценка волатильности была ограничена коротким концом, спрос на хеджирование нормализовался, а повышенная премия за риск волатильности продолжает anchor подразумеваемую волатильность.
В целом, рынок, похоже, quietly строит базу, консолидируясь не из-за избыточного участия, а из-за паузы в убежденности, поскольку инвесторы ждут следующего катализатора для разблокировки более широкого engagement.
Отказ от ответственности: Этот отчет не предоставляет каких-либо инвестиционных рекомендаций. Все данные предоставляются исключительно в информационных и образовательных целях. Ни одно инвестиционное решение не должно основываться на информации, предоставленной здесь, и вы solely несете ответственность за свои собственные инвестиционные решения.
Балансы бирж, представленные здесь, получены из комплексной базы данных Glassnode с метками адресов, которые собираются как из официально опубликованной информации бирж, так и с помощью проприетарных алгоритмов кластеризации. Хотя мы стремимся обеспечить максимальную точность в представлении балансов бирж, важно отметить, что эти цифры могут не всегда охватывать всю полноту резервов биржи, особенно когда биржи воздерживаются от раскрытия своих официальных адресов. Мы призываем пользователей проявлять осторожность и осмотрительность при использовании этих метрик. Glassnode не несет ответственности за любые несоответствия или потенциальные неточности.
Пожалуйста, прочитайте наше Уведомление о прозрачности при использовании биржевых данных.