Нашим руководящим принципом в разработке продуктового предложения Glassnode всегда было обеспечение всестороннего обзора рынков цифровых активов. Это подразумевало предоставление аналитики блокчейна и деривативов, являющейся лидером в отрасли, а также помощь инвесторам в интерпретации более широких сил, формирующих рыночное поведение.
По мере того как цифровые активы становятся зрелыми, эти силы все чаще выходят за пределы данных блокчейна. Сегодня мы further расширяем наш продукт, чтобы отразить это продолжающееся изменение. Теперь Glassnode интегрирует макроэкономические данные и данные традиционных финансов (TradFi), объединяя все необходимое для понимания Биткойна и цифровых активов на единой платформе.
Почему макроэкономика сейчас важна как никогда
Цифровые активы больше не являются нишевым экспериментом. Это мейнстримовый класс активов с растущим участием институтов, ETF и игроков традиционных финансов. Недавнее одобрение и быстрый рост Биткойн-ETF – теперь превышающих $100 миллиардов под управлением по состоянию на начало 2026 года – являются явным сигналом этого сдвига.
Но с этой интеграцией возникает новая динамика: цена Биткойна все больше подвержена влиянию традиционных финансовых сил. Геополитические риски, денежно-кредитная политика и более широкие макроэкономические тенденции теперь играют критическую роль в формировании траектории Биткойна. Для инвесторов, трейдеров и институтов это делает доступ к более широкому набору действенных данных более важным, чем когда-либо.
Именно поэтому Glassnode расширяет свое покрытие данных, включив в него показатели TradFi и макроэкономики. Цель состоит не в том, чтобы выйти за рамки анализа блокчейна, а в том, чтобы расширить его, позволив пользователям соединить точки между рынками цифровых активов, данными традиционных финансов и глобальной экономикой.
От цифрового золота к активу, чувствительному к ликвидности
Биткойн был создан сразу после Глобального финансового кризиса в 2009 году как прямой ответ его создателя на то, что он видел как фундаментальный изъян современного финансы: способность центральных банков и правительств создавать деньги по своему усмотрению. Фиксированное предложение Биткойна в 21 миллион монет – это не просто техническая деталь; это политическое заявление.
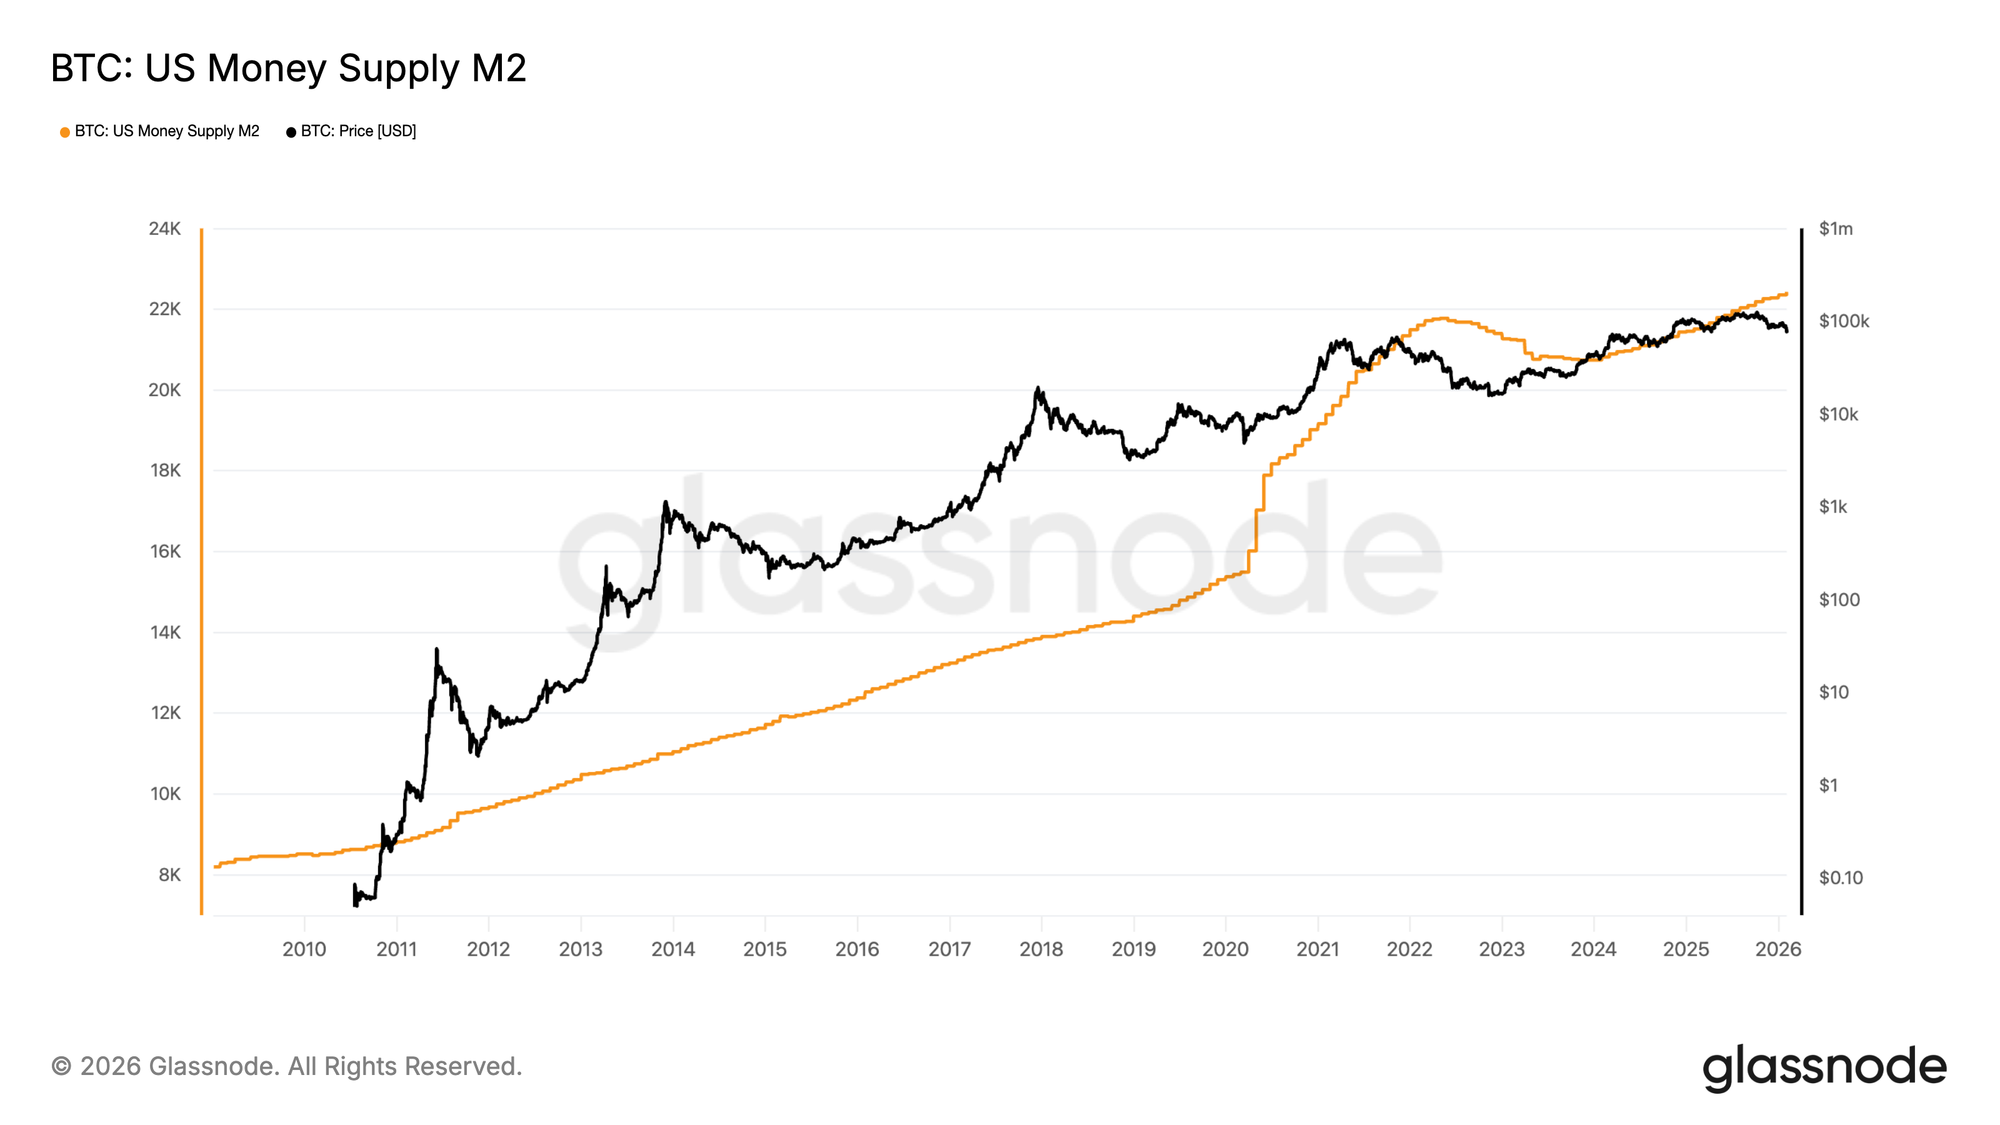
Этот аспект становится наиболее актуальным, когда центральные банки наиболее активны. Когда центральные банки расширяют свои балансы, денежная масса растет, финансовые условия становятся более поддерживающими, и у инвесторов, как правило, появляется больше капитала для распределения по рисковым активам. В такой среде Биткойн часто выигрывал наряду с другими активами, чувствительными к ликвидности.
Напротив, периоды ужесточения денежно-кредитной политики, как правило, создают более сложный фон. Более высокие ставки, сокращение балансов центральных банков и более слабые условия ликвидности обычно снижают аппетит к риску и могут оказывать давление на рынки цифровых активов.
Вот почему полезно отслеживать такие показатели, как:
- Денежная масса США (M2)
- Баланс Центрального банка США
- Денежная масса зоны евро (M2)
- Баланс Центрального банка зоны евро
Они помогают поместить движение цены Биткойна в более широкий контекст глобальных циклов ликвидности и предоставить более четкую макроэкономическую основу для интерпретации рыночных движений.
От «голубиного» к «ястребиному»: как сдвиги процентных ставок влияют на Биткойн
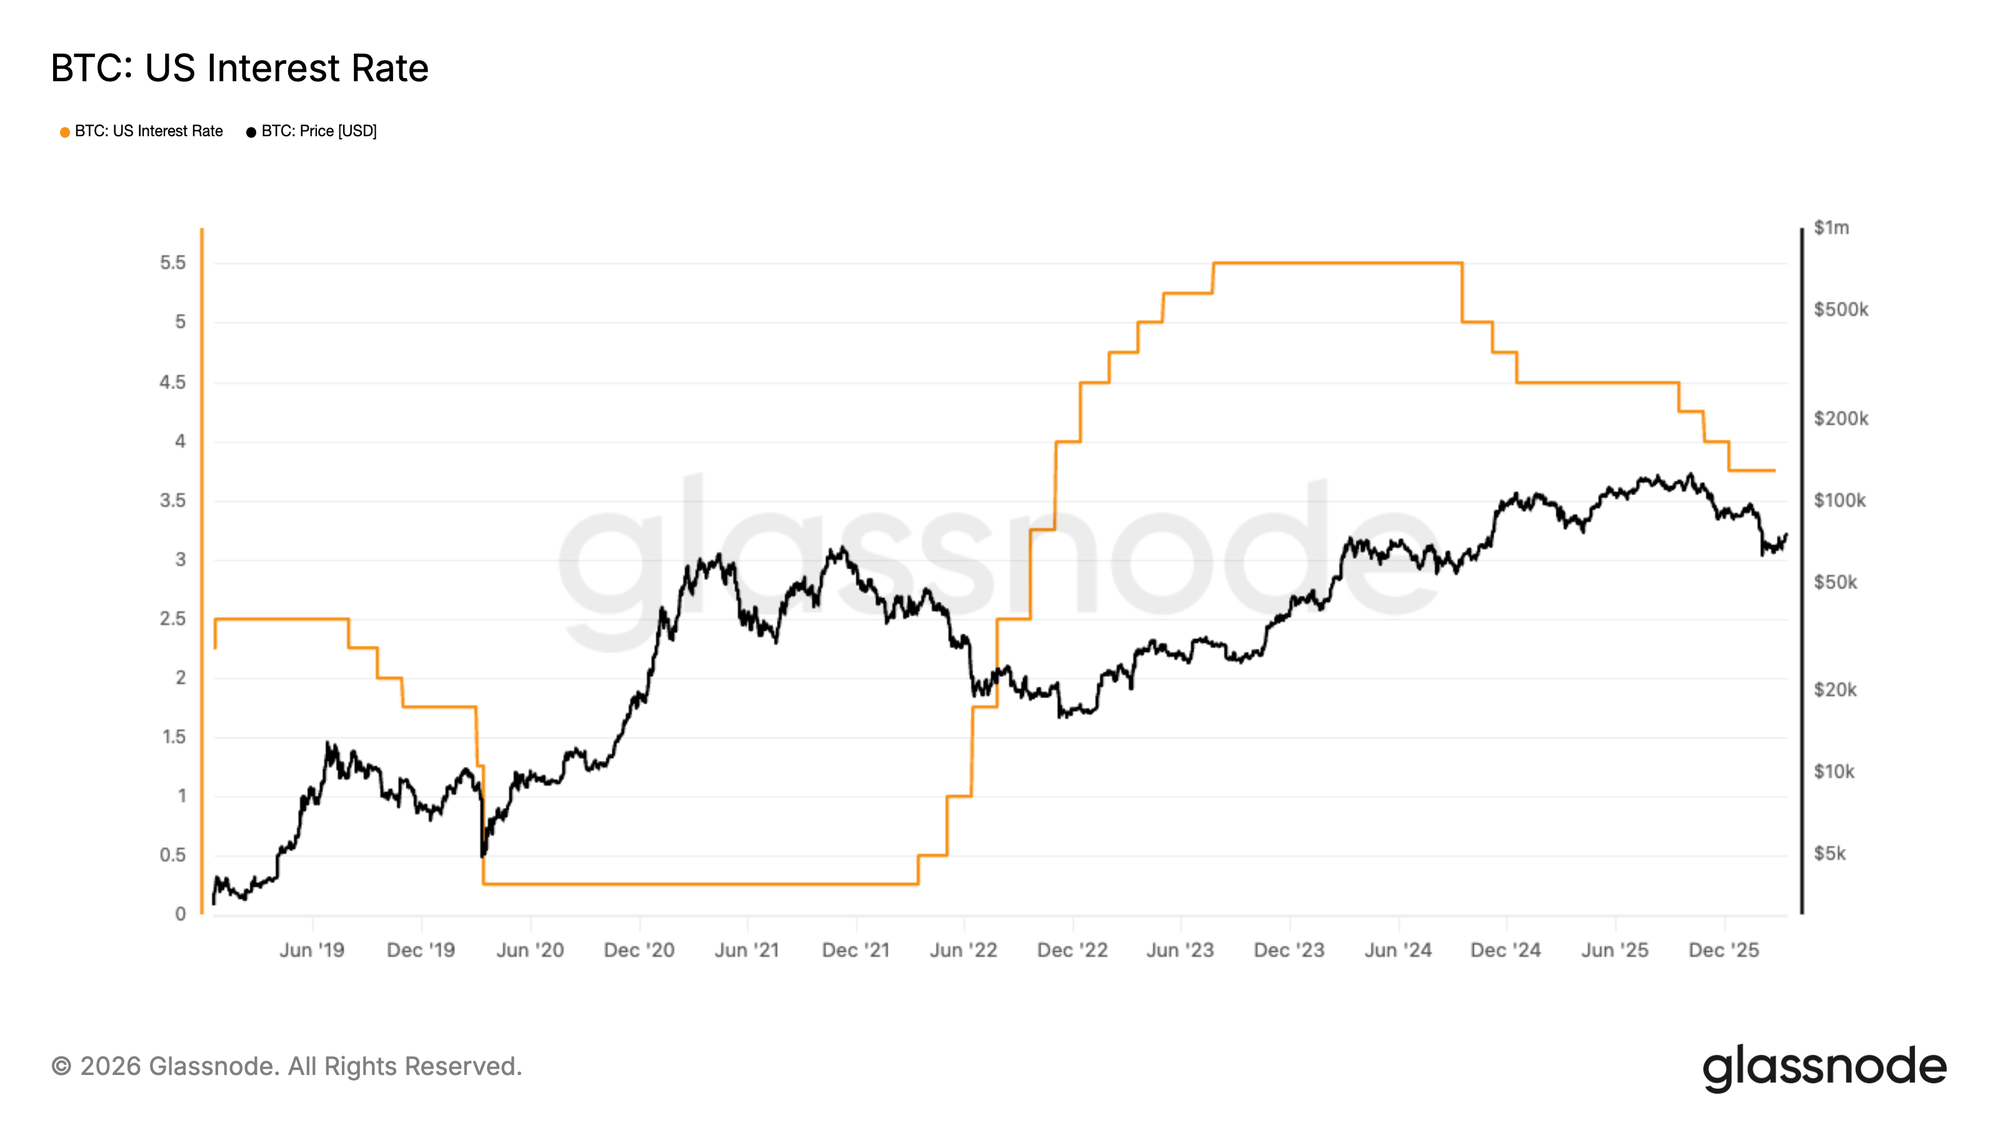
Процентные ставки – это еще один ключевой канал передачи. Биткойн не генерирует денежный поток, поэтому альтернативная стоимость его владения значительно меняется с изменением денежно-кредитной политики. В условиях ужесточения более высокие ставки, как правило, поддерживают доллар, повышают реальную доходность и снижают аппетит к спекулятивным активам. В условиях смягчения более легкие финансовые условия могут поддерживать более широкое принятие рисков. Вот почему такие показатели, как Процентная ставка США, Процентная ставка зоны евро, Доходность 10-летних гособлигаций США и Доходность 10-летних гособлигаций Германии, актуальны для инвесторов в цифровые активы, а не только для трейдеров облигациями.
Как показано выше, периоды низких процентных ставок, как правило, поддерживают Биткойн и другие рисковые активы, поскольку более дешевый капитал и более мягкие финансовые условия поощряют принятие рисков. И наоборот, рост процентных ставок увеличивает стоимость капитала и, как правило, снижает аппетит инвесторов к риску, создавая более сложную среду для динамики цены Биткойна.
Данные традиционных финансов в цифровых активах
По мере созревания рынков цифровых активов они становятся все более связанными с теми же макросилами, которые движут акциями, облигациями, валютами и товарами. Биткойн теперь торгуется в среде, формируемой процентными ставками, условиями ликвидности, силой доллара, инфляционными ожиданиями и настроениями к риску.
Как следствие, понимание рынков цифровых активов требует большего, чем просто данные блокчейна. Добавляя показатели TradFi, Glassnode предоставляет пользователям контекст, необходимый для интерпретации рыночных движений, выявления смены режимов и оценки того, является ли движение специфичным для цифровых активов или частью более широкого кросс-активного тренда.
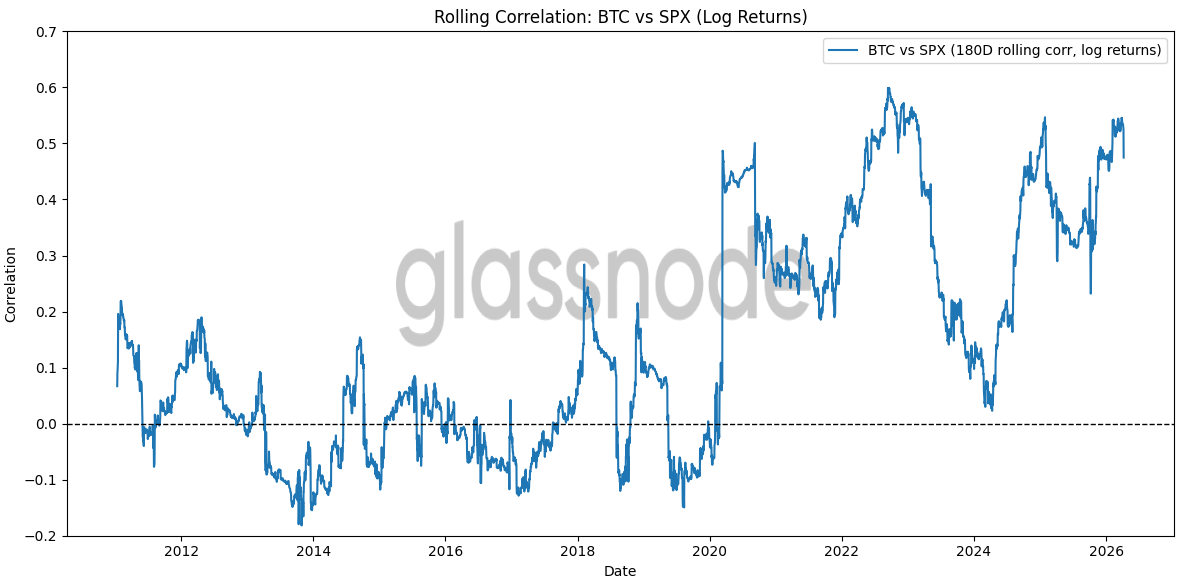
На приведенном выше графике показана 180-дневная скользящая корреляция между Биткойном и S&P 500 с использованием логарифмической доходности. Основной сигнал заключается в том, что BTC, по-видимому, со временем стал более чувствительным к макроэкономике и более широкой динамике рисковых активов. В earlier годы корреляция колебалась около нуля или иногда была отрицательной, тогда как в последние годы она часто была существенно положительной.
Это не кажется временным искажением, а структурным сдвигом, движимым тремя силами:
- приход институционального капитала, который распределяется по классам активов;
- цикл ликвидности после COVID, который одновременно надул, а затем сдул рисковые активы;
- и запуск спотовых Биткойн-ETF, которые более непосредственно встраивают BTC в потоки традиционных портфелей.
Это подтверждает точку зрения, что Биткойн больше не является исключительно самостоятельным, нативным для криптовалют активом; теперь он торгуется в соответствии с более широкими условиями ликвидности и риска чаще, чем в прошлом.
Использование показателей TradFi для контекстуализации рынков цифровых активов
Набор рыночных показателей TradFi от Glassnode помогает пользователям понять внешние силы, которые все больше влияют на рынки цифровых активов.
▷ Индикаторы ставок и кривой доходности дают представление о денежно-кредитной политике, ожиданиях роста и риске рецессии. Relevant metrics: Спред 10Y-2Y США, Спред 10Y-2Y Германии, Доходность 2Y США, Доходность 10Y США, Доходность 2Y Германии и Доходность 10Y Германии.
▷ Бенчмарки акций помогают оценить глобальный аппетит к риску и рыночный стресс. Relevant metrics: Индекс фондового рынка США 500 и Индекс фондового рынка EU50, наряду с Индексом страха США и Индексом страха ЕС
▷ Валютные меры предоставляют контекст о силе доллара и условиях ликвидности, оба из которых могут существенно влиять на производительность цифровых активов. Relevant metrics: EUR/USD и Индекс доллара США
▷ Цены на товары, включая Золото, Серебро и нефть марки WTI, добавляют еще один слой, отражая инфляционные ожидания, спрос на убежище и геополитический риск.
Одна платформа, полный рыночный контекст
Более широкая мысль заключается в том, что рынки цифровых активов созревают. Появление спотовых ETF, растущее участие институтов и более сильные связи с политикой и геополитикой означают, что цифровые активы все чаще находятся в той же информационной экосистеме, что и акции, облигации, валюта и товары. Макроэкономические категории и категории показателей TradFi от Glassnode созданы для этой среды.
Glassnode остается домом для глубокой нативной аналитики цифровых активов. В то же время, предоставление всестороннего аналитического обзора рынков теперь требует инструментов для понимания макроэкономических и традиционных финансовых сил, которые их формируют.
Исследуйте новые макроэкономические показатели и показатели TradFi в Glassnode Studio или сравните тарифные планы, чтобы получить доступ.
- Подписывайтесь на нас в X для своевременных рыночных обновлений и анализа
- Присоединяйтесь к нашему Telegram-каналу для регулярных рыночных инсайтов
- Для получения метрик блокчейна, дашбордов и оповещений посетите Glassnode Studio
Отказ от ответственности: Этот отчет предназначен только для информационных и образовательных целей. Анализ представляет собой ограниченное тематическое исследование со значительными ограничениями и не должен толковаться как инвестиционная консультация или окончательные торговые сигналы. Прошлые модели производительности не гарантируют будущих результатов. Всегда проводите тщательную комплексную проверку и учитывайте множество факторов, прежде чем принимать инвестиционные решения.