Ethereum To Follow Netflix’s Trajectory? Expert Breaks Down Some Interesting Similarities

bitcoinistОпубликовано 2026-04-08Обновлено 2026-04-08

Введение

Ethereum's current price structure is being compared to Netflix's stock performance between 2003 and 2009 by analyst Crypto Tice. The analysis highlights a similar pattern of prolonged consolidation, with both assets experiencing multiple rejections at a key resistance level—Ethereum near $4,900 and Netflix in its historical range. This repeated testing of range boundaries, now in its sixth interaction for Ethereum, suggests building pressure that historically preceded a major breakout for Netflix. For Ethereum to follow a similar trajectory, it must decisively break above resistance levels at $2,150, $2,350, $3,100, $3,900, and finally $4,900. Critics note fundamental differences, such as Netflix's consolidation occurring during business expansion with growing subscribers and revenue, while Ethereum faces unique challenges like reduced base-layer activity due to Layer 2 networks.

Ethereum’s current price structure is being compared to a phase that once played out in a major stock price, where years of sideways movement and repeated rejections eventually gave way to a powerful breakout above resistance. The comparison, shared by crypto analyst Crypto Tice on X, points out that what looks like long-term stagnation around $2,000 on Ethereum’s chart may be a setup that has appeared before in Netflix’s price history.

A Repeating Structure Inside A Range

Technical patterns have a way of resurfacing across different markets, which is why analysts often study past price behavior of one cryptocurrency to predict how another cryptocurrency could also play out in the future. In many cases, these comparisons stay within the crypto market itself or extend to traditional stores of value like precious metals, where similarities in cycles and investor behavior are easier to justify.

This analysis, however, takes a different approach by stepping outside those usual comparisons. It provides a comparison between Ethereum’s current price structure and the way Netflix, Inc. (NFLX) traded between 2003 and 2009.

The chart highlights a sequence of six distinct interactions with range boundaries in both assets. In Netflix’s case, the price spent years bouncing between support and resistance, forming a compressed structure with multiple failed breakout attempts. Each rejection added to the range but also built pressure over time.

Ethereum’s price action on a multi-year timeframe is showing a nearly identical formation. Since 2021, the Ethereum price has repeatedly pushed into resistance around $4,900, pulled back to support, and returned again for another attempt.

The current price action, which is the sixth interaction, places Ethereum near the lower boundary of the range, which is just the same stage Netflix was before its eventual breakout.

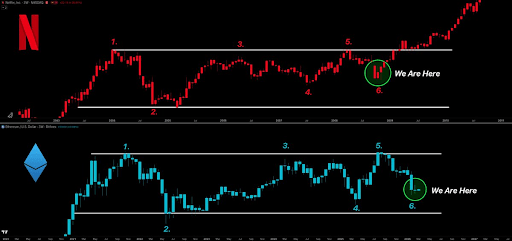
Price Chart Comparison. Source: @CryptoTice_ On X

Pressure Building. What Comes Next?

The structure outlined in the chart ultimately points to one outcome: a breakout rally. This is how Netflix broke out of the resistance trendline in 2009. The important thing for Ethereum now is reclaiming and holding above resistance above $4,900 with conviction. However, there are other intermediate price targets that Ethereum needs to break above before this move. These targets include $2,150, $2,350, $3,100, $3,900, and $4,600.

The analogy, however, is not without its critics. Some comments argue that comparing Ethereum to Netflix ignores the fundamental differences between the two. One comment, for instance, noted that Netflix’s consolidation took place during a period of steady business expansion, with clear growth in subscribers and revenue supporting its long-term trajectory.

Ethereum’s situation, on the other hand, is more layered and has a different economic regime. The rise of Layer 2 networks has moved activity away from the base layer, reducing fee generation at the protocol level. These factors, and many others, introduce unknowns that cannot be represented through chart structure.

ETH price pushes above $2,200 | Source: ETHUSDT on Tradingview.com

Связанные с этим вопросы

QWhat is the main comparison being drawn in the article between Ethereum and Netflix?

AThe article compares Ethereum's current multi-year price structure, characterized by sideways movement and repeated rejections around the $2,000-$4,900 range, to the price action of Netflix (NFLX) stock between 2003 and 2009, which also experienced a long period of consolidation before a powerful breakout.

QAccording to the analyst, what is the potential outcome suggested by the similar chart structure?

AThe similar chart structure ultimately points to one outcome: a breakout rally, similar to how Netflix broke out of its resistance trendline in 2009.

QWhat key price level does Ethereum need to reclaim and hold above for a convincing breakout?

AEthereum needs to reclaim and hold above the resistance level of $4,900 with conviction for a convincing breakout.

QWhat is one fundamental criticism mentioned against comparing Ethereum to Netflix?

AOne criticism is that Netflix's consolidation period was supported by clear fundamental growth in subscribers and revenue, whereas Ethereum's situation is more complex with factors like the rise of Layer 2 networks reducing base layer fee generation, introducing unknowns not represented on a chart.

QWhat are some of the intermediate price targets Ethereum must break before reaching the $4,900 resistance?

AThe intermediate price targets Ethereum needs to break include $2,150, $2,350, $3,100, $3,900, and $4,600.

Похожее

Торговля

Спот
Фьючерсы

Популярные статьи

Как купить S

Добро пожаловать на HTX.com! Мы сделали приобретение Sonic (S) простым и удобным. Следуйте нашему пошаговому руководству и отправляйтесь в свое крипто-путешествие.Шаг 1: Создайте аккаунт на HTXИспользуйте свой адрес электронной почты или номер телефона, чтобы зарегистрироваться и бесплатно создать аккаунт на HTX. Пройдите удобную регистрацию и откройте для себя весь функционал.Создать аккаунтШаг 2: Перейдите в Купить криптовалюту и выберите свой способ оплатыКредитная/Дебетовая Карта: Используйте свою карту Visa или Mastercard для мгновенной покупки Sonic (S).Баланс: Используйте средства с баланса вашего аккаунта HTX для простой торговли.Третьи Лица: Мы добавили популярные способы оплаты, такие как Google Pay и Apple Pay, для повышения удобства.P2P: Торгуйте напрямую с другими пользователями на HTX.Внебиржевая Торговля (OTC): Мы предлагаем индивидуальные услуги и конкурентоспособные обменные курсы для трейдеров.Шаг 3: Хранение Sonic (S)После приобретения вами Sonic (S) храните их в своем аккаунте на HTX. В качестве альтернативы вы можете отправить их куда-либо с помощью перевода в блокчейне или использовать для торговли с другими криптовалютами.Шаг 4: Торговля Sonic (S)С легкостью торгуйте Sonic (S) на спотовом рынке HTX. Просто зайдите в свой аккаунт, выберите торговую пару, совершайте сделки и следите за ними в режиме реального времени. Мы предлагаем удобный интерфейс как для начинающих, так и для опытных трейдеров.

1.2k просмотров всегоОпубликовано 2025.01.15Обновлено 2025.03.21

Как купить S

Sonic: Обновления под руководством Андре Кронье – новая звезда Layer-1 на фоне спада рынка

Он решает проблемы масштабируемости, совместимости между блокчейнами и стимулов для разработчиков с помощью технологических инноваций.

2.2k просмотров всегоОпубликовано 2025.04.09Обновлено 2025.04.09

Sonic: Обновления под руководством Андре Кронье – новая звезда Layer-1 на фоне спада рынка

HTX Learn: Пройдите обучение по "Sonic" и разделите 1000 USDT

HTX Learn — ваш проводник в мир перспективных проектов, и мы запускаем специальное мероприятие "Учитесь и Зарабатывайте", посвящённое этим проектам. Наше новое направление .

1.8k просмотров всегоОпубликовано 2025.04.10Обновлено 2025.04.10

HTX Learn: Пройдите обучение по "Sonic" и разделите 1000 USDT

Обсуждения

Добро пожаловать в Сообщество HTX. Здесь вы сможете быть в курсе последних новостей о развитии платформы и получить доступ к профессиональной аналитической информации о рынке. Мнения пользователей о цене на S (S) представлены ниже.

活动图片