Оригинальное название: Reading Perps Beyond Volume
Оригинальный автор: Prathik Desai, Token Dispatch
Перевод: Bitpush News
Как только вы начинаете думать, что финансы стали скучными, они всегда находят способ удивить. В последнее время кажется, что все перестраивают финансовую систему способами, которые мало кто предвидел, включая даже тех, кто пришел из индустрии развлечений и медиа.
Возьмем, к примеру, Джимми Дональдсона (Jimmy Donaldson, известного на YouTube как «MrBeast»). У него не только империя снэков, но и недавно он приобрел банковское приложение, чтобы обучать подростков и молодежь финансовой грамотности и управлению деньгами. Почему? Возможно, нет более прямого способа монетизировать свою аудиторию в 466 миллионов подписчиков, чем с помощью финансовых продуктов.
Этим летом крупнейший в мире рынок деривативов, CME Group, запустит фьючерсы на акции, позволяяющие торговать фьючерсами на более чем 50 ведущих американских акций, включая Alphabet, NVIDIA, Tesla и Meta.
Эти изменения показывают, как трансформируется то, как люди участвуют в финансах. И ничто за последние годы не иллюстрирует это лучше, чем взрывной рост рынка бессрочных контрактов (Perpetual Markets).
Бессрочные фьючерсы (или Perps) — это производные финансовые контракты, которые позволяют участникам рынка спекулировать на цене актива без даты истечения. Perps также позволяют быстро и дешево выражать мнение об активе. Они более привлекательны, чем традиционные рынки, потому что предлагают мгновенный доступ и кредитное плечо. В отличие от традиционных рынков, они не требуют процесса подключения брокеров, бумажной работы по юрисдикциям и не следуют «традиционным» рыночным часам.
Кроме того, ончейн-рынки бессрочных контрактов позволяют торговать любым активом (будь то традиционным или криптовалютным) без разрешения и с высоким плечом. Это делает спекуляции увлекательными, особенно когда люди не могут устоять перед соблазном делать ставки на движение волатильных активов вне традиционных торговых сессий. Это позволяет оценивать риск в реальном времени.
Вспомните, что произошло две недели назад. Когда традиционные и криптовалютные рынки одновременно рухнули, трейдеры хлынули на Hyperliquid, вызвав ажиотаж в торговле бессрочными контрактами на золото и серебро. 31 января только на Hyperliquid, на его рынке бессрочных контрактов на серебро (Silver), который работал менее месяца, пришлось 2% от мирового дневного объема торгов серебром.
Это объясняет, почему дашборды объемов торговли бессрочными контрактами все больше доминируют в криптосообществах и на форумах. Объем торгов — это абсолютное значение. Он выглядит большим, обновляется каждые несколько минут и идеально подходит для рейтингов. Но он упускает ключевой нюанс: объем торгов может отражать движение, лишенное смысла. Большой объем на рынке может быть из-за глубины, но также и из-за вознаграждений и стимулов, поощряющих более частую активность. Эта активность часто рекурсивна и мало что значит.
На этой неделе я углубился в другие показатели рынков бессрочных контрактов. В сочетании с объемом торгов они добавляют больше измерений и рассказывают совершенно другую историю, чем просто объем.
Давайте начнем.
Несколько данных
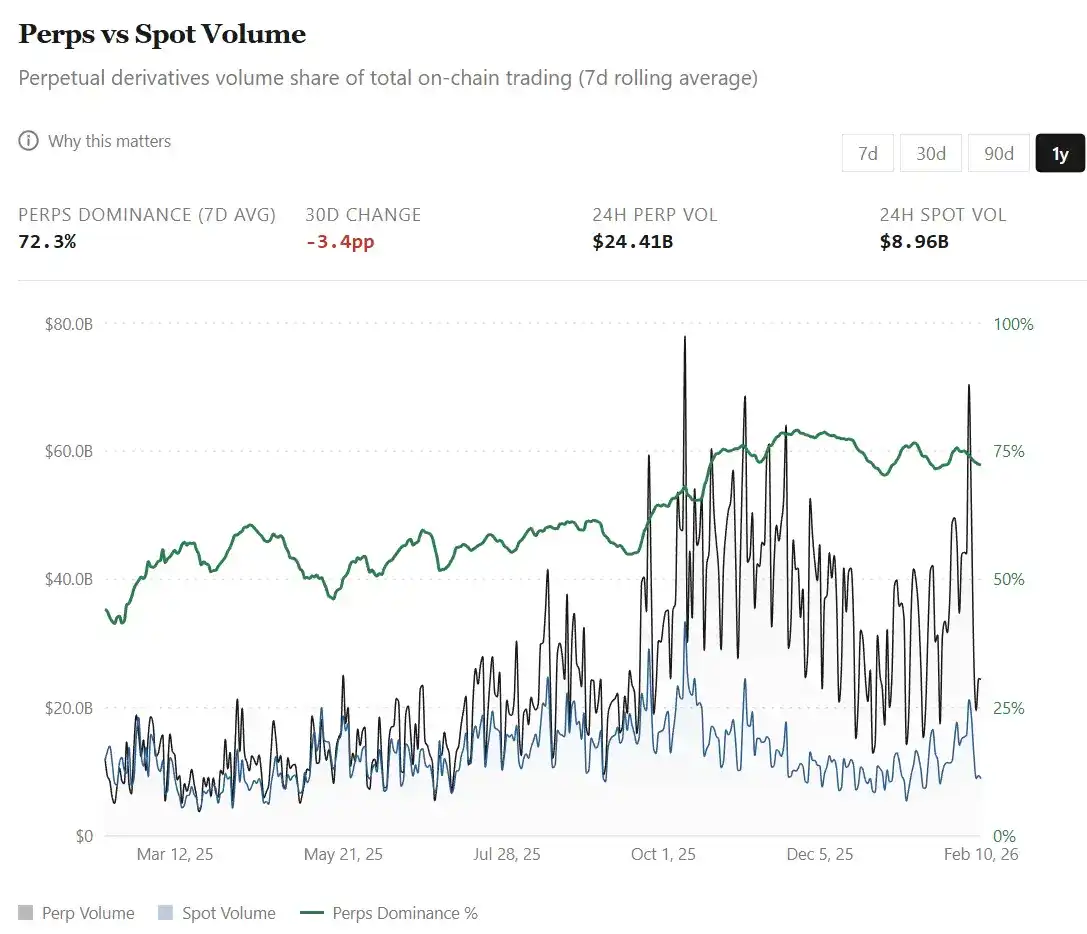
Дружелюбный пользовательский интерфейс рынков Perps сделал их низкопороговым интерфейсом по умолчанию для выражения мнений на различных рынках и глобальных активах. Широкий выбор для торговливериджными деривативами как на традиционные, так и на криптоактивы на единой платформе привел к тому, что объем торгов бессрочными контрактами превзошел объем спот-торговли на децентрализованных биржах. С 44% в феврале 2025 года доля объема Perps взлетела до примерно 75% сегодня (относительно спотового объема).
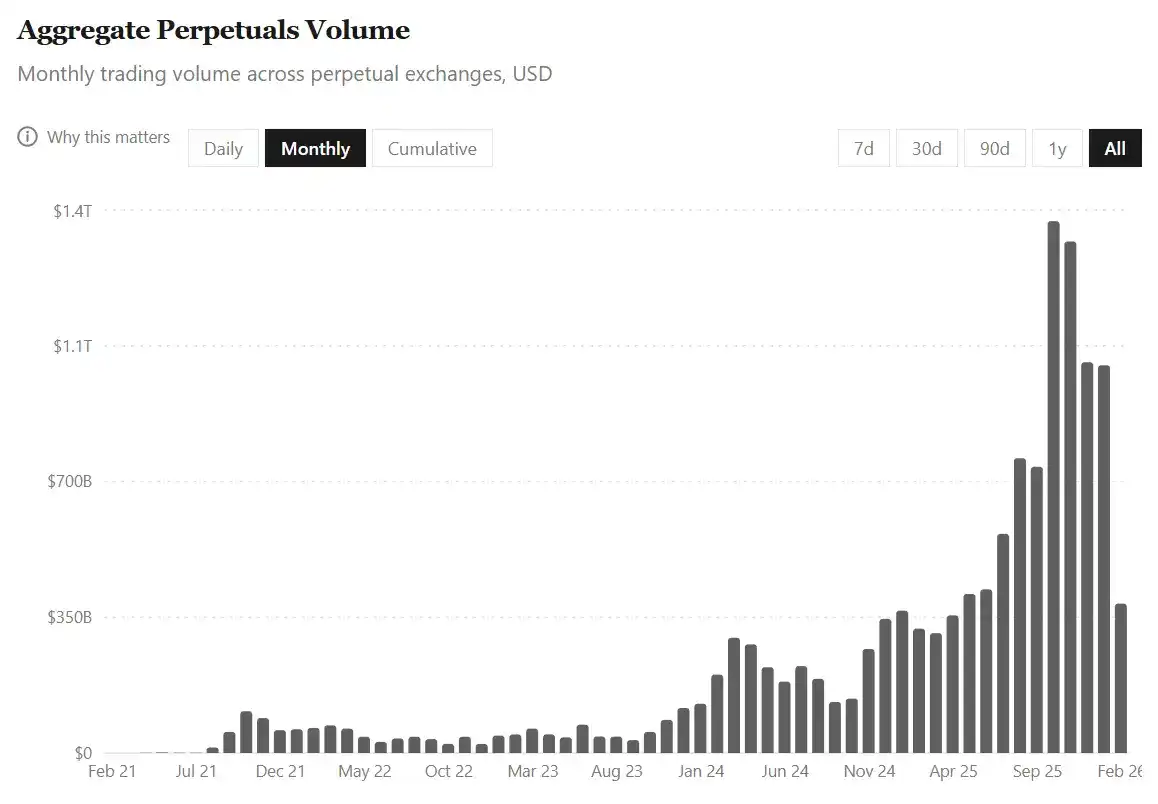
Этот рост был особенно заметен в последние месяцы:
· За четыре года по 31 июля 2025 года совокупный объем торгов Perps на всех платформах составил 6,91 трлн долларов.
· И только за последние шесть месяцев этот объем удвоился, достигнув 14 трлн долларов.
Весь этот рост произошел на фоне того, что общая рыночная капитализация криптовалют сократилась почти на 40% в период с 1 августа 2025 года по 9 февраля 2026 года. Эта активность указывает на то, что трейдеры все чаще склоняются к торговле деривативами, хеджированию и краткосрочному позиционированию, особенно когда спотовые рынки становятся чрезвычайно волатильными и медвежьими.
Но здесь есть загвоздка. При такой огромной активности легко неправильно истолковать показатель объема. Особенно потому, что торговля Perps — это не просто покупка актива и долгосрочное удержание, это также включает в себя многократное изменение размера ставок с использованием плеча в более короткие промежутки времени.
Поэтому, когда оборот рынка быстро ускоряется, в голове неизбежно возникает вопрос: отражают ли рекордные объемы приток большего капитала или тот же капитал, циркулирующий с большей скоростью?
Вот где важно наблюдать за открытым интересом (Open Interest, OI). Если объем отражает движение капитала, то OI измеряет непокрытую экспозицию риска. На платформах Perps OI — это общая долларовая стоимость активных и не settlement длинных и коротких контрактов, удерживаемых трейдерами.
Если торговля Perps будет принята массовым рынком, мы ожидаем увидеть не только большие потоки капитала, но и пропорционально растущую непокрытую экспозицию.
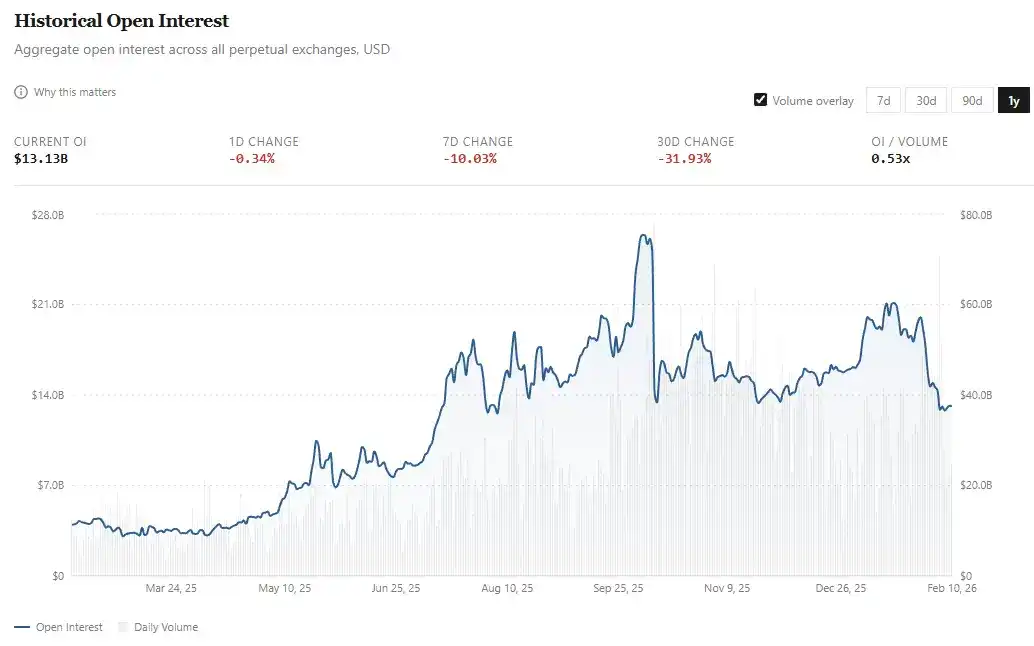
· В феврале прошлого года OI в среднем составлял около 4 млрд долларов;
· Сейчас эта цифра выросла более чем в три раза и составляет около 13 млрд долларов. Фактически, в январе в среднем было около 18 млрд долларов, а затем в первую неделю февраля упало примерно на 30%.
Хотя объем торговли Perps за последние пять месяцев удвоился, OI вырос примерно на 50% (с 13 млрд долларов до примерно 18 млрд, а затем откатился до 13 млрд). Чтобы лучше понять это, я посмотрел, как капиталоэффективность (т.е. OI в процентах от дневного объема) менялась за последний год.

Коэффициент OI/Объем вырос на 50% с 0,33x в прошлом году до 0,49x сегодня. Но этот прогресс не был гладким; на пути к этому росту на 50 базисных пунктов было несколько пиков и спадов:
· Фаза 1 (февраль-май 2025 г.): Затишье. Коэффициент OI/Объем в среднем составлял ~0,46x, средний OI ~4,8 млрд долларов, средний дневной объем ~11,5 млрд долларов.
· Фаза 2 (июнь-середина октября): Скачок. Коэффициент в среднем достиг ~0,72x. За этот период средний OI поднялся до 14,8 млрд долларов, а средний дневной объем — до 23 млрд долларов. Это ознаменовало не только рекорды объемов, но и увеличение экспозиции риска и большее вложение капитала в эти деривативы.
· Фаза 3: Разворот рынка. Начало этой фазы совпало с массовым лайквидацией 10 октября, которая за 24 часа стерла более 19 млрд долларов leveraged позиций. С середины октября до конца декабря коэффициент OI/Объем упал до ~0,38x, в основном за счет роста объема, в то время как открытый интерес в основном停滞. Октябрь, ноябрь и декабрь показали самые высокие за 2025 год трехмесячные объемы, в среднем более 1,2 трлн долларов в месяц. За тот же период OI в среднем составлял около 15 млрд долларов, что немного ниже среднего показателя за предыдущие три месяца.
На уровне протокола
Здесь я хочу добавить больше измерений для рынков Perps на уровне протокола. Это помогает нам понять, насколько эффективно платформы Perps преобразуют торговую активность в «липкий капитал» и доход.
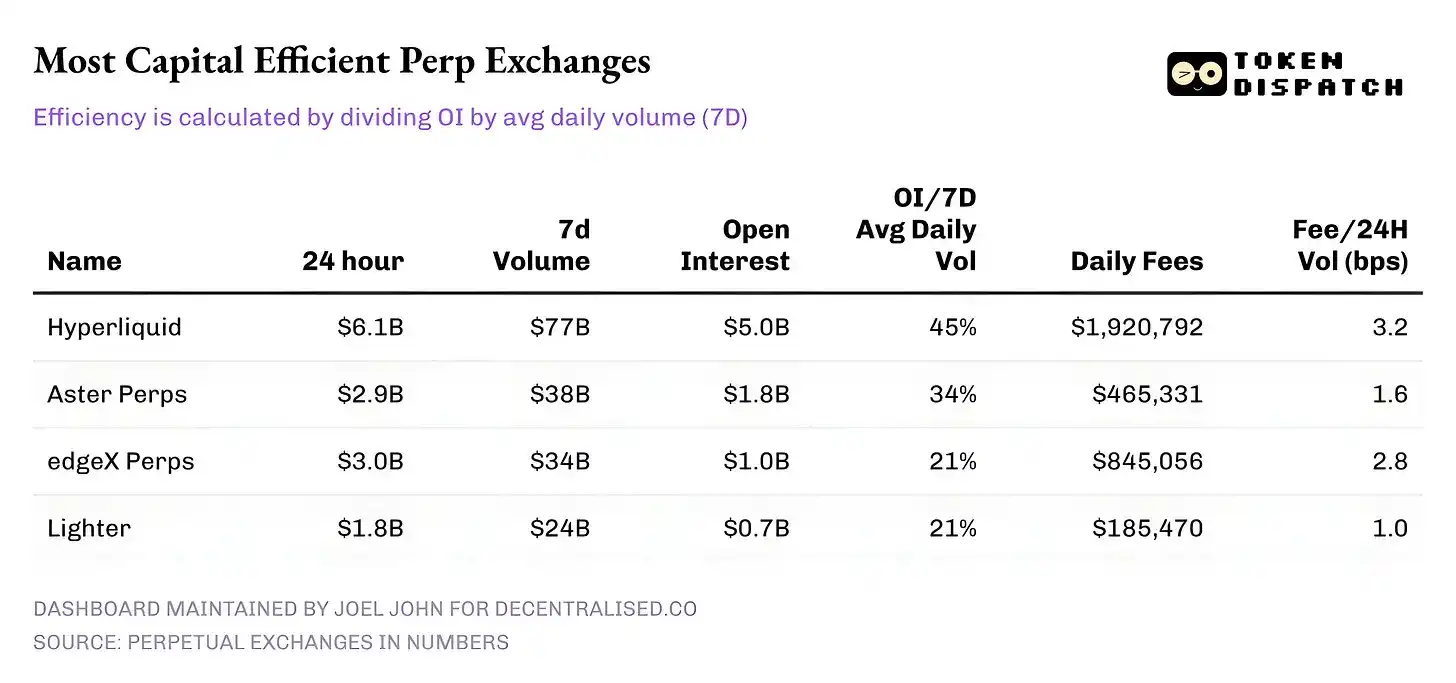
По состоянию на 10 февраля вот как выглядели топ-5 платформ Perps по 24-часовому объему:
· Hyperliquid: Его отношение OI к 7-дневному среднему дневному объему превышает 45%, что позволяет конвертировать значительную долю объема в долгосрочные позиции. Это означает, что на каждые 10 долларов, торгуемые на платформе, 4,5 доллара вкладываются в активные позиции. Это важно, потому что высокий коэффициент OI приводит к более узким спредам, большей ликвидности и уверенности в увеличении размера сделки без проскальзывания.
· Доход от комиссий Hyperliquid усиливает эту историю. Его норма монетизации (Take Rate) составляет около 3,2 базисных пункта, что позволяет конвертировать наибольшую долю 24-часового объема в комиссионный доход.
· Aster: В настоящее время занимает второе место, с приличной капиталоэффективностью 34% (OI/Vol), несмотря на то, что объем почти вдвое меньше, чем у Hyperliquid. Однако его способность к монетизации привлекает внимание — с низкой нормой монетизации (~1,6 bps) Aster явно отдает приоритет удержанию капитала на своей платформе, а не максимизации комиссий.
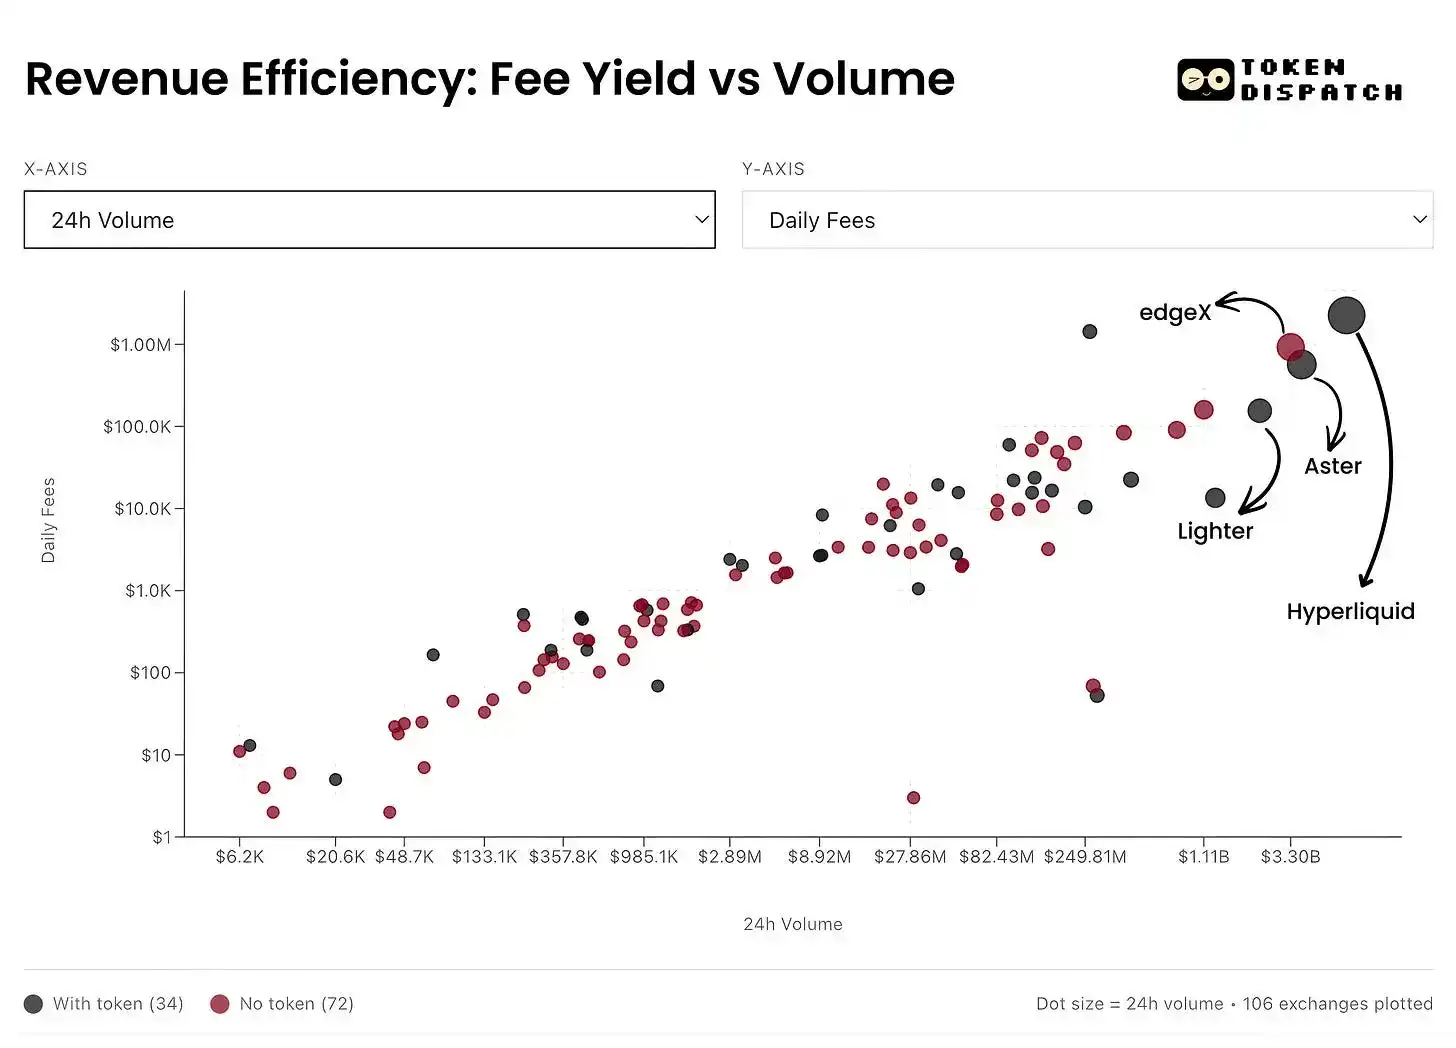
· edgeX и Lighter: Оба показали схожие результаты по капиталоэффективности с OI/Vol на уровне 21%. Однако edgeX сравнялся с Hyperliquid по монетизации комиссий, показав 2,8 bps.
Вывод
Примечательно, что сегодняшний рынок бессрочных контрактов — это уже не простая история роста, он требует тонкого прочтения множества показателей. На макроуровне объемы торговли взрывно растут: прирост совокупного объема Perps за шесть месяцев превысил общий объем за предыдущие четыре года. Но картина проясняется только при совместном рассмотрении OI и объема.
Более явная победа заключается в росте коэффициента OI/Объем. Это прямой сигнал о том, что «терпеливый капитал» готов доверять и делать ставки на различные продукты и рынки, появляющиеся на торговых платформах Perps.
В будущем более важно будет следить за тем, как будут развиваться отдельные игроки и что они выберут для оптимизации. Со временем платформы, которые смогут оптимизировать «убежденность (Conviction)» в торговле и обеспечить устойчивую монетизацию, станут гораздо более важными, чем те, которые полагаются исключительно на вознаграждения и стимулы для доминирования в рейтингах по объему.