Chainlink’s price looks weak, but there’s more to the story – 2 reasons why

ambcryptoОпубликовано 2026-03-31Обновлено 2026-03-31

Введение

Chainlink (LINK) has shown signs of recovery with a 3.47% price increase, trading at $8.76 after a four-day decline. On-chain data reveals a significant drop in exchange reserves, suggesting accumulation and investor confidence in a potential rebound. Derivatives data supports this shift, with a high long/short ratio of 1.06 indicating bullish sentiment. Additionally, U.S. Spot LINK ETFs continue to see steady inflows, reinforcing positive market outlook. Technically, LINK is trading within an ascending channel pattern, and if it holds above the $8.19 support level, it could potentially surge by 14.50% to $10.08. However, the weak Average Directional Index (ADX) suggests limited trend strength and cautious market momentum.

Chainlink [LINK] has shown a mild recovery after four consecutive days of decline. According to CoinMarketCap, as of the 30th of March, the asset gained over 3.47% in the past 24 hours and was trading at $8.76.

The improving on-chain data, along with derivatives data, is currently reinforcing optimism around LINK and suggests that the asset’s ongoing upside move could continue in the coming days.

On-chain and derivatives data signal a shift in sentiment

The data from the analytics tool CryptoQuant shows that investor interest in the asset has improved notably despite the recent decline.

According to Chainlink’s exchange reserve across all exchanges, a massive drop of 331K LINK has been recorded over the past 48 hours.

Source: CryptoQuant

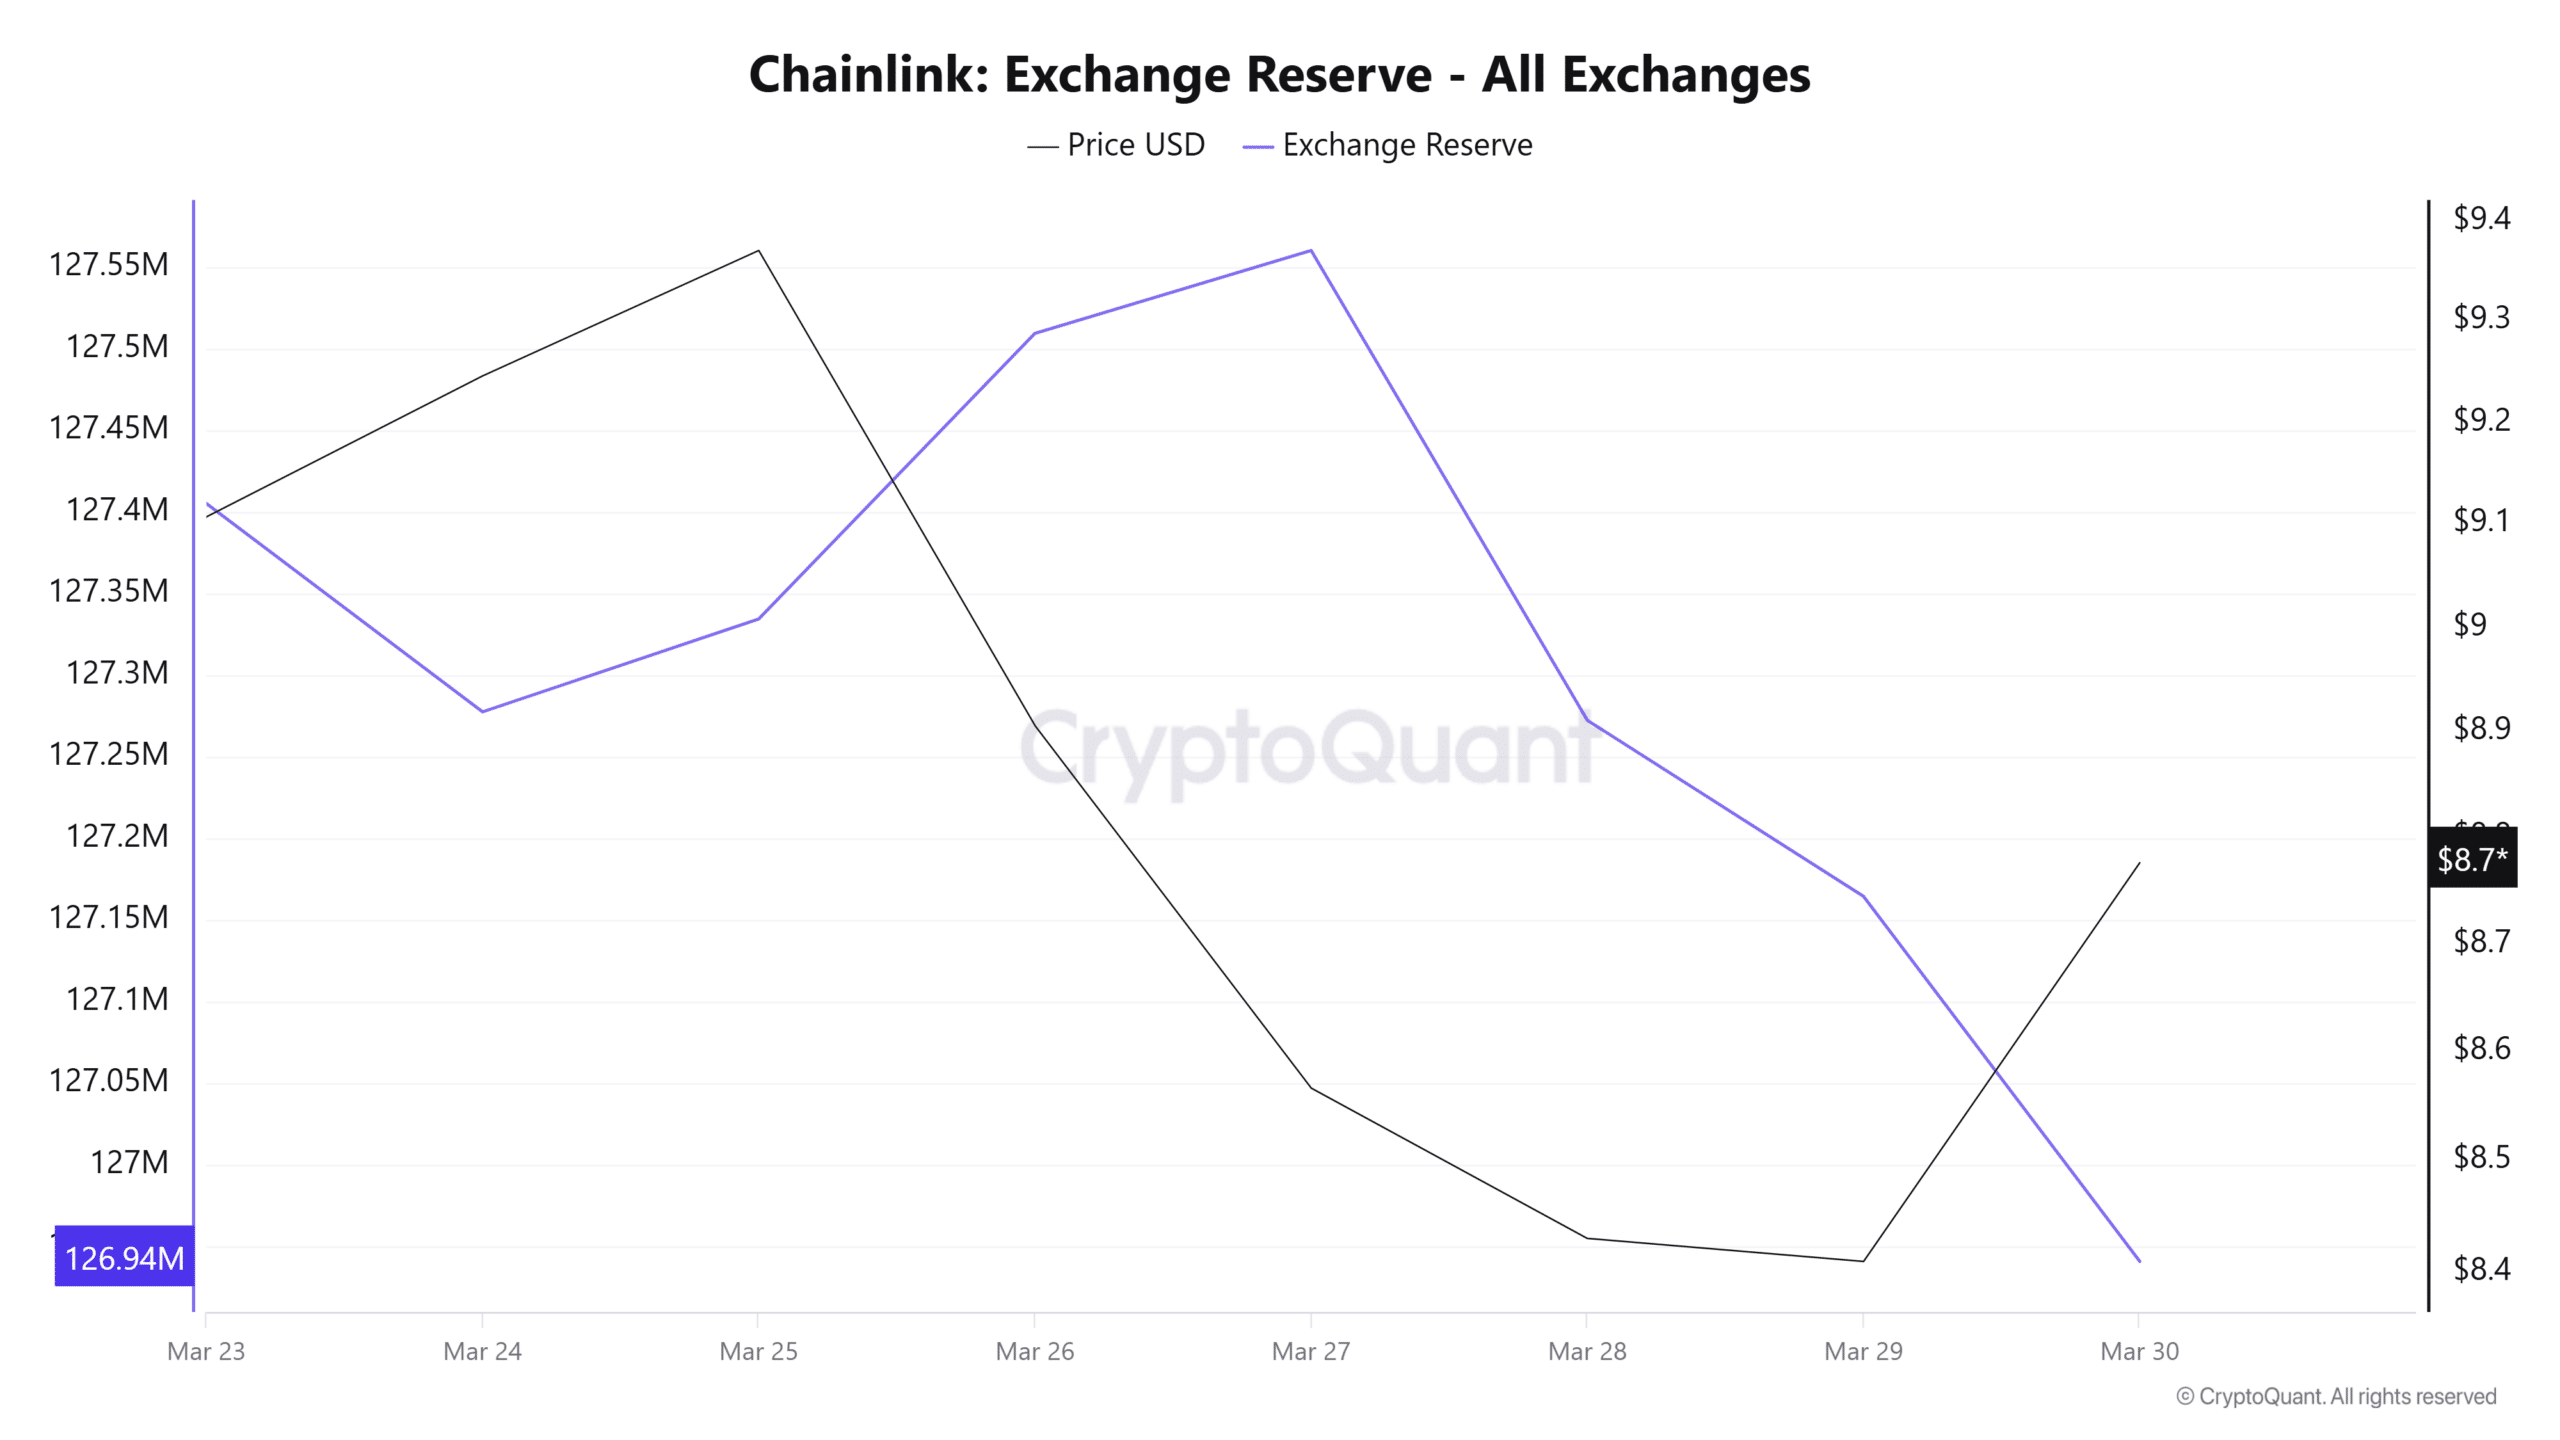
A declining exchange reserve typically suggests accumulation. When this occurs at a price level that has historically shown signs of reversal, it indicates that investors are not only expecting a potential rebound but may also be taking advantage of the dip.

On the derivatives side, it appears that intraday traders are following the market trend.

Data from CoinGlass’s LINK exchange liquidation map shows that, amid this recovery, traders are showing interest around $8.60 on the lower end and $8.83 on the upper end.

Source: CoinGlass

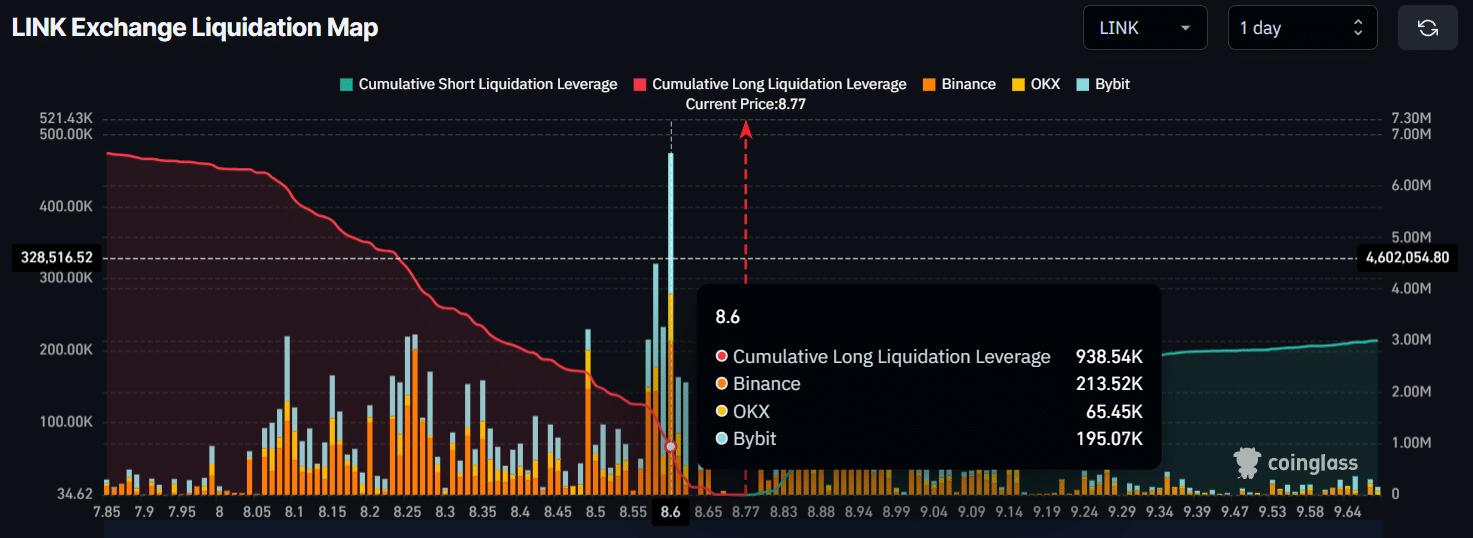
These are not just key levels; traders at these zones are highly overleveraged, having built $938.54K worth of long positions and $268K worth of short positions. This indicates a shift in market sentiment amid the ongoing recovery.

Meanwhile, LINK’s Long/Short Ratio has reached 1.06, its highest level in a month. A ratio above 1 reflects bullish sentiment among traders, as a larger number of participants are betting on the price to move upward.

In fact, LINK’s ongoing optimism is further supported by U.S. Spot LINK ETFs. Data from SoSoValue shows that these ETFs continue to record steady inflows despite ongoing market uncertainty.

Source: SoSoValue

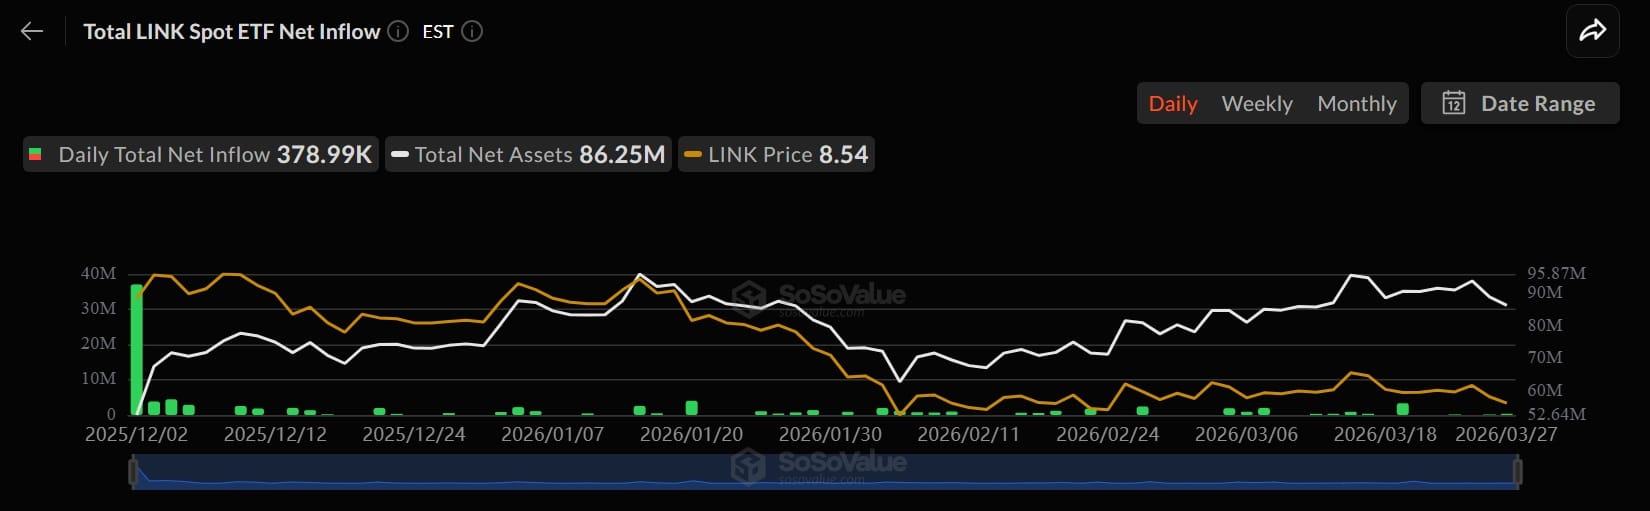
This not only strengthens LINK’s outlook but also indicates steady and growing demand for the asset in the traditional market.

LINK eyes a potential 14.50% jump

On the daily chart, LINK appeared poised for a significant price uptick. The price action showed that LINK has been moving within an ascending channel pattern between its upper and lower boundaries since the 6th of February.

Since then, whenever the price has touched the lower boundary, it has recorded a strong rebound, something that LINK appears to be doing again.

Source: TradingView

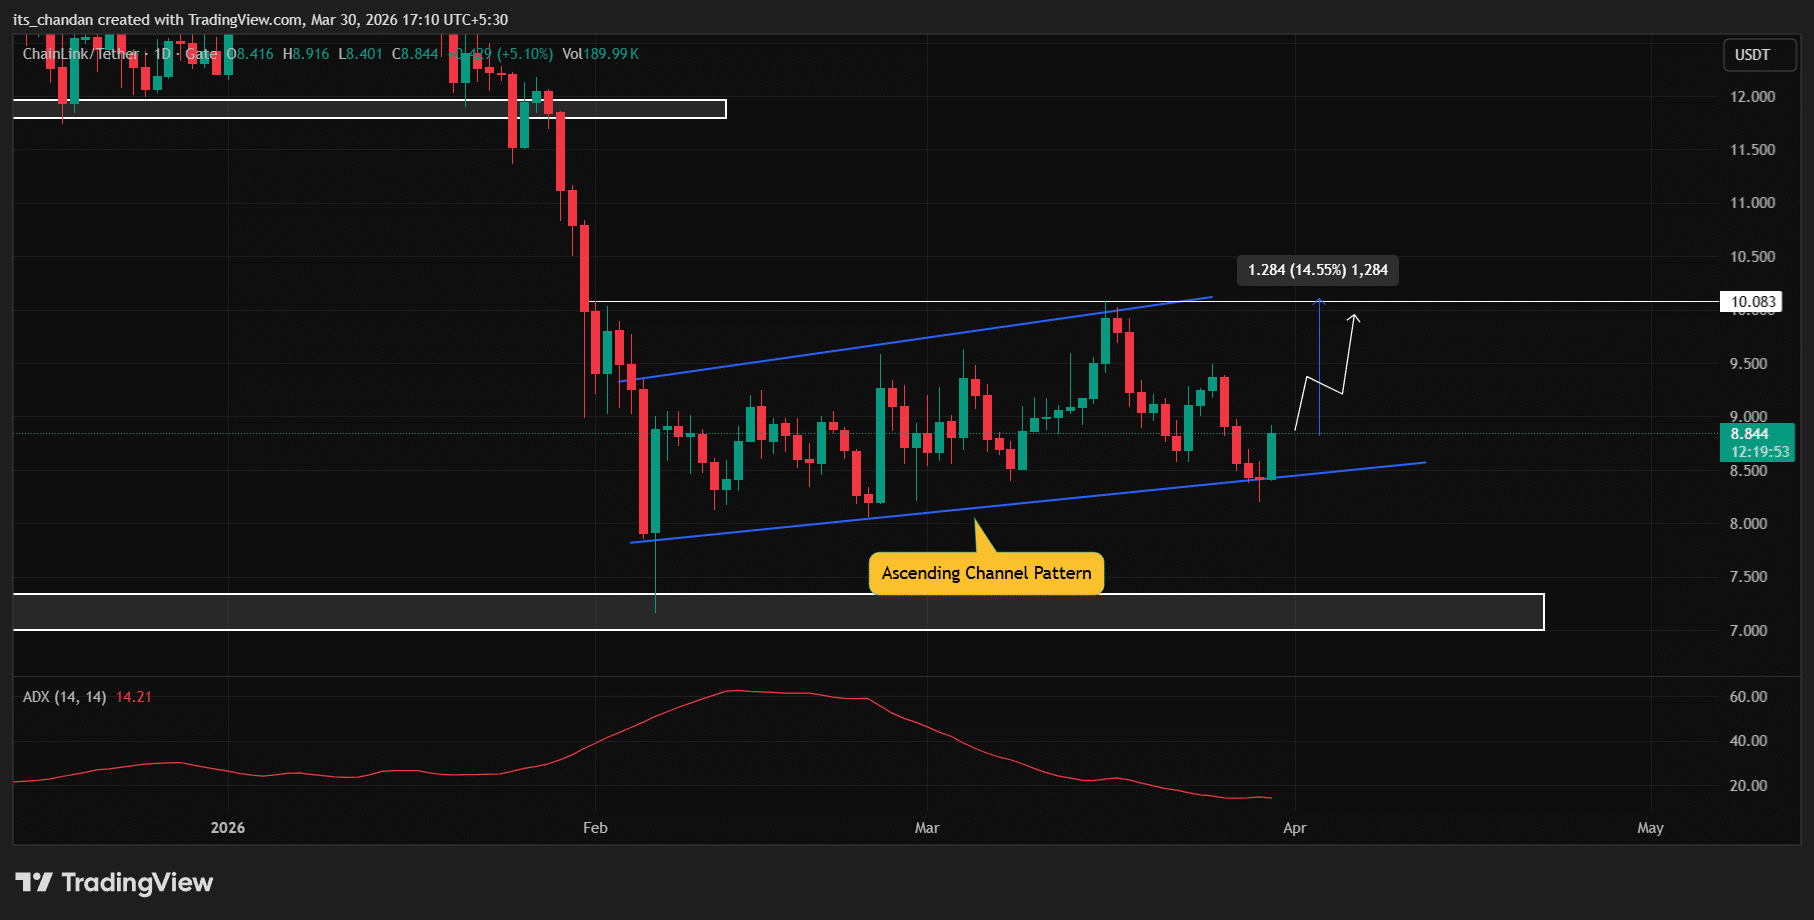
Based on this historical pattern, if LINK remains above the lower boundary at the $8.19 level, it has strong potential to register a price increase of over 14.50% and could reach the $10.08 level in the coming days.

However, the Average Directional Index (ADX), an indicator that measures trend strength, has dropped to 14.43, well below the key threshold of 25, indicating weak trend momentum and a lack of strong directional bias in the market.


Final Summary

  • Chainlink has jumped 3.47%, increasing the chances of a price rebound as it is currently trading near the lower boundary of an ascending channel pattern.
  • Improving on-chain data, along with derivatives data, suggests that LINK could continue its upward momentum in the coming days.

Связанные с этим вопросы

QWhat are the two main reasons why Chainlink's price might continue to rise despite looking weak?

AThe two main reasons are: 1) Improving on-chain data, specifically a massive drop in exchange reserves indicating accumulation, and 2) Bullish derivatives data, including a high Long/Short Ratio and significant leveraged long positions at key price levels.

QWhat does a declining exchange reserve for an asset like LINK typically indicate?

AA declining exchange reserve typically indicates accumulation, suggesting that investors are moving their assets off exchanges, expecting a potential price rebound, and are likely buying the dip.

QAccording to the technical analysis, what is the potential price target for LINK if it holds above the $8.19 level?

AIf LINK remains above the $8.19 level (the lower boundary of its ascending channel), it has the potential to register a price increase of over 14.50%, reaching the $10.08 level.

QWhat does Chainlink's Long/Short Ratio of 1.06 signify for market sentiment?

AA Long/Short Ratio above 1 reflects bullish sentiment among traders, indicating that a larger number of participants are betting on the price to move upward. A ratio of 1.06 is its highest level in a month.

QWhat external factor, beyond on-chain and derivatives data, is also supporting optimism for LINK?

AU.S. Spot LINK ETFs are supporting optimism, as data shows they continue to record steady inflows despite market uncertainty, indicating steady and growing demand for the asset in the traditional market.

Похожее

Торговля

Спот
Фьючерсы

Популярные статьи

Как купить S

Добро пожаловать на HTX.com! Мы сделали приобретение Sonic (S) простым и удобным. Следуйте нашему пошаговому руководству и отправляйтесь в свое крипто-путешествие.Шаг 1: Создайте аккаунт на HTXИспользуйте свой адрес электронной почты или номер телефона, чтобы зарегистрироваться и бесплатно создать аккаунт на HTX. Пройдите удобную регистрацию и откройте для себя весь функционал.Создать аккаунтШаг 2: Перейдите в Купить криптовалюту и выберите свой способ оплатыКредитная/Дебетовая Карта: Используйте свою карту Visa или Mastercard для мгновенной покупки Sonic (S).Баланс: Используйте средства с баланса вашего аккаунта HTX для простой торговли.Третьи Лица: Мы добавили популярные способы оплаты, такие как Google Pay и Apple Pay, для повышения удобства.P2P: Торгуйте напрямую с другими пользователями на HTX.Внебиржевая Торговля (OTC): Мы предлагаем индивидуальные услуги и конкурентоспособные обменные курсы для трейдеров.Шаг 3: Хранение Sonic (S)После приобретения вами Sonic (S) храните их в своем аккаунте на HTX. В качестве альтернативы вы можете отправить их куда-либо с помощью перевода в блокчейне или использовать для торговли с другими криптовалютами.Шаг 4: Торговля Sonic (S)С легкостью торгуйте Sonic (S) на спотовом рынке HTX. Просто зайдите в свой аккаунт, выберите торговую пару, совершайте сделки и следите за ними в режиме реального времени. Мы предлагаем удобный интерфейс как для начинающих, так и для опытных трейдеров.

1.2k просмотров всегоОпубликовано 2025.01.15Обновлено 2025.03.21

Как купить S

Sonic: Обновления под руководством Андре Кронье – новая звезда Layer-1 на фоне спада рынка

Он решает проблемы масштабируемости, совместимости между блокчейнами и стимулов для разработчиков с помощью технологических инноваций.

2.2k просмотров всегоОпубликовано 2025.04.09Обновлено 2025.04.09

Sonic: Обновления под руководством Андре Кронье – новая звезда Layer-1 на фоне спада рынка

HTX Learn: Пройдите обучение по "Sonic" и разделите 1000 USDT

HTX Learn — ваш проводник в мир перспективных проектов, и мы запускаем специальное мероприятие "Учитесь и Зарабатывайте", посвящённое этим проектам. Наше новое направление .

1.8k просмотров всегоОпубликовано 2025.04.10Обновлено 2025.04.10

HTX Learn: Пройдите обучение по "Sonic" и разделите 1000 USDT

Обсуждения

Добро пожаловать в Сообщество HTX. Здесь вы сможете быть в курсе последних новостей о развитии платформы и получить доступ к профессиональной аналитической информации о рынке. Мнения пользователей о цене на S (S) представлены ниже.

活动图片