Sequoia берет интервью у Демиса Хассабиса: Информация — это сущность Вселенной, ИИ откроет совершенно новые научные дисциплины
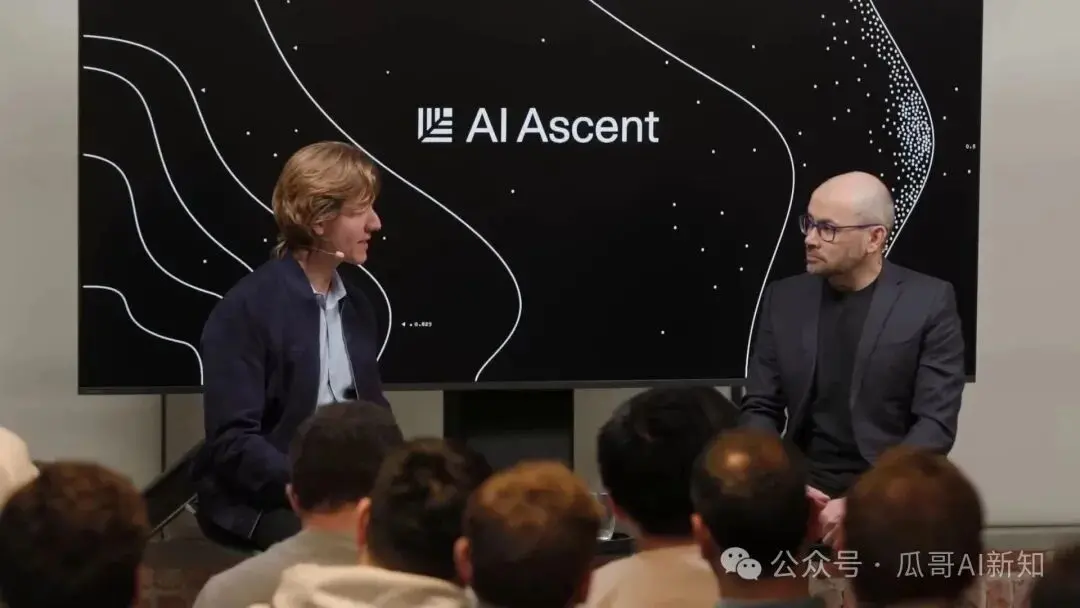
Интервью с Демисом Хассабисом, сооснователем и CEO Google DeepMind, проведенное Sequoia Capital в 2026 году. Хассабис обсуждает путь к созданию искусственного общего интеллекта (ИОИ) и его будущее влияние.
Он рассказывает, как его ранняя карьера в игровой индустрии (разработка таких игр, как Theme Park) и исследования в нейробиологии подготовили почву для основания DeepMind в 2009 году. Тогда компания объединила глубокое обучение и обучение с подкреплением, предвидя ключевую роль вычислительных мощностей.
Миссия DeepMind состоит из двух этапов: 1) решить проблему интеллекта, создав ИОИ, и 2) использовать ИОИ для решения всех остальных проблем, особенно в науке. Прорыв AlphaFold в предсказании структуры белков, отмеченный Нобелевской премией по химии 2024 года, является примером этого подхода. Хассабис верит, что ИИ радикально ускорит открытие лекарств, сократив цикл с лет до недель или дней, и откроет путь к персонализированной медицине.
Он предсказывает, что ИОИ будет достигнут к 2030 году и приведет к возникновению новых научных дисциплин. Во-первых, для понимания сложных систем ИИ потребуется новая «инженерная наука», такая как механистическая интерпретируемость. Во-вторых, симуляторы на базе ИИ позволят проводить контролируемые эксперименты в сложных областях, таких как экономика или биология, что может привести к открытию новых фундаментальных законов.
Хассабис выдвигает философскую идею о том, что информация, а не материя или энергия, может быть фундаментальной сущностью вселенной, что придает исследованиям ИИ更深ий смысл. Он также считает, что классические вычислительные системы (машины Тьюринга), подобные нашему мозгу, могут моделировать явления, которые ранее считались доступными только для квантовых вычислений.
Отвечая на вопросы о сознании ИИ, он предлагает сначала создать ИОИ как мощный инструмент, а затем использовать его для исследования самой природы сознания. В быстрых ответах Хассабис называет AlphaFold своим самым гордым достижением, книгу Дэвида Дойча «Структура реальности» — рекомендуемой литературой для эпохи ИОИ, а Джона фон Неймана — идеальным ученым-партнером для стратегической игры.
链捕手05/12 02:22