Unicorn Report: Within an Hour's Drive of the Bay Area, 90% of the World's AI Market Value is Concentrated

marsbitОпубликовано 2026-04-23Обновлено 2026-04-23

Введение

The 2025 Unicorn Report by Elad Gil reveals a dramatic concentration of AI unicorn value in the San Francisco Bay Area, which now holds 91% of the global generative AI unicorn market capitalization within a one-hour drive radius. The U.S. dominates globally with 65% of all unicorn value, a significant increase from previous years. While the rate of new unicorn creation has slowed post-2022, the average valuation of existing unicorns has reached a six-year high, driven overwhelmingly by AI companies. Generative AI unicorns saw an average valuation increase of $2.2 billion, far outpacing non-AI unicorns. The data indicates a powerful clustering effect, with the Bay Area solidifying its position as the world's premier AI hub, while other U.S. cities like New York and Los Angeles specialize in fintech/crypto and aerospace/defense, respectively.

Author: Elad Gil (Data Analysis: Shreyan Jain)

Compiled by: Deep Tide TechFlow

Deep Tide Guide: Elad Gil's team has been tracking the distribution of global unicorn market value for six consecutive years. The 2025 data points to a clear conclusion: the San Francisco Bay Area is becoming a supercluster for generative AI, with 91% of the world's AI unicorn market value concentrated within a one-hour drive. Meanwhile, the birth rate of new unicorns is slowing, but the average valuation of existing unicorns has hit a six-year high. This report uses hard data to reveal that the global startup ecosystem's center of power is accelerating its tilt towards the United States and the Bay Area.

All data is as of December 31 of the respective year. "2025" below refers to the market value as of December 31, 2025 / January 1, 2026.

Over the past two years, we have experienced a market correction in the post-zero interest rate era, the explosive rise of frontier AI labs like OpenAI and Anthropic, and ongoing debates about the "AI bubble." The data shows that the San Francisco Bay Area has evolved into an AI supercluster, with 91% of the world's private AI market value concentrated within a one-hour drive radius.

Previous analyses can be referenced: 2019, 2020, 2021, 2023.

Key Findings

  1. Generative AI has turned the Bay Area into a supercluster. The Bay Area now accounts for about 39% of global unicorn market value, more than 4 times that of the second-ranked city. A year ago, this figure was only 29%. Looking solely at generative AI unicorns, the Bay Area's share is as high as 91%.
  2. Absolute dominance of US unicorns. The US added nearly $1.2 trillion in unicorn market value over the past year, accounting for about 65% of the global total. Europe has surpassed China in market value share but still only holds around 10%.
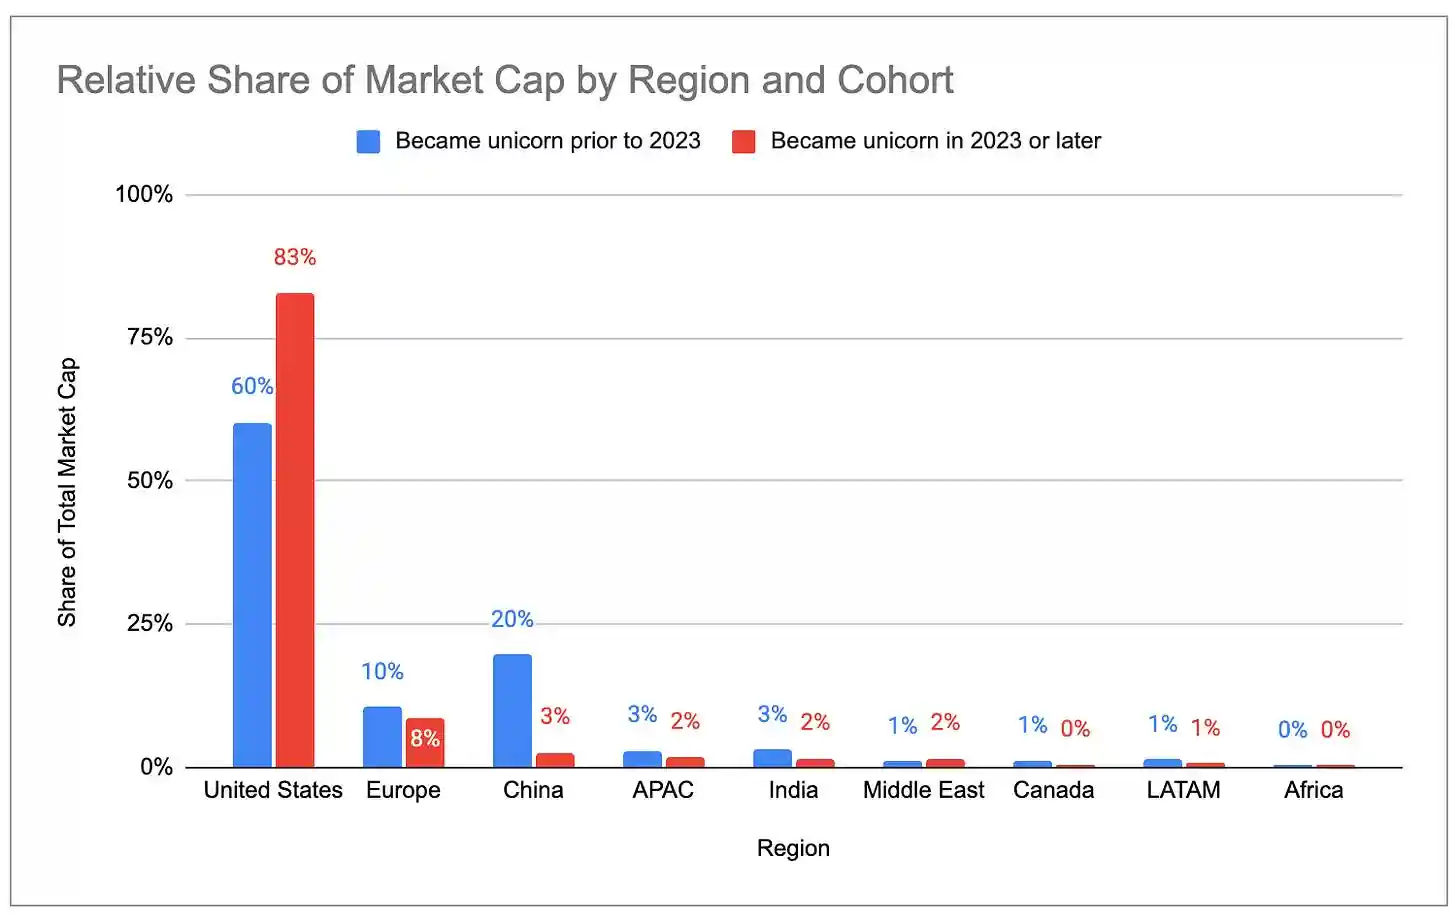
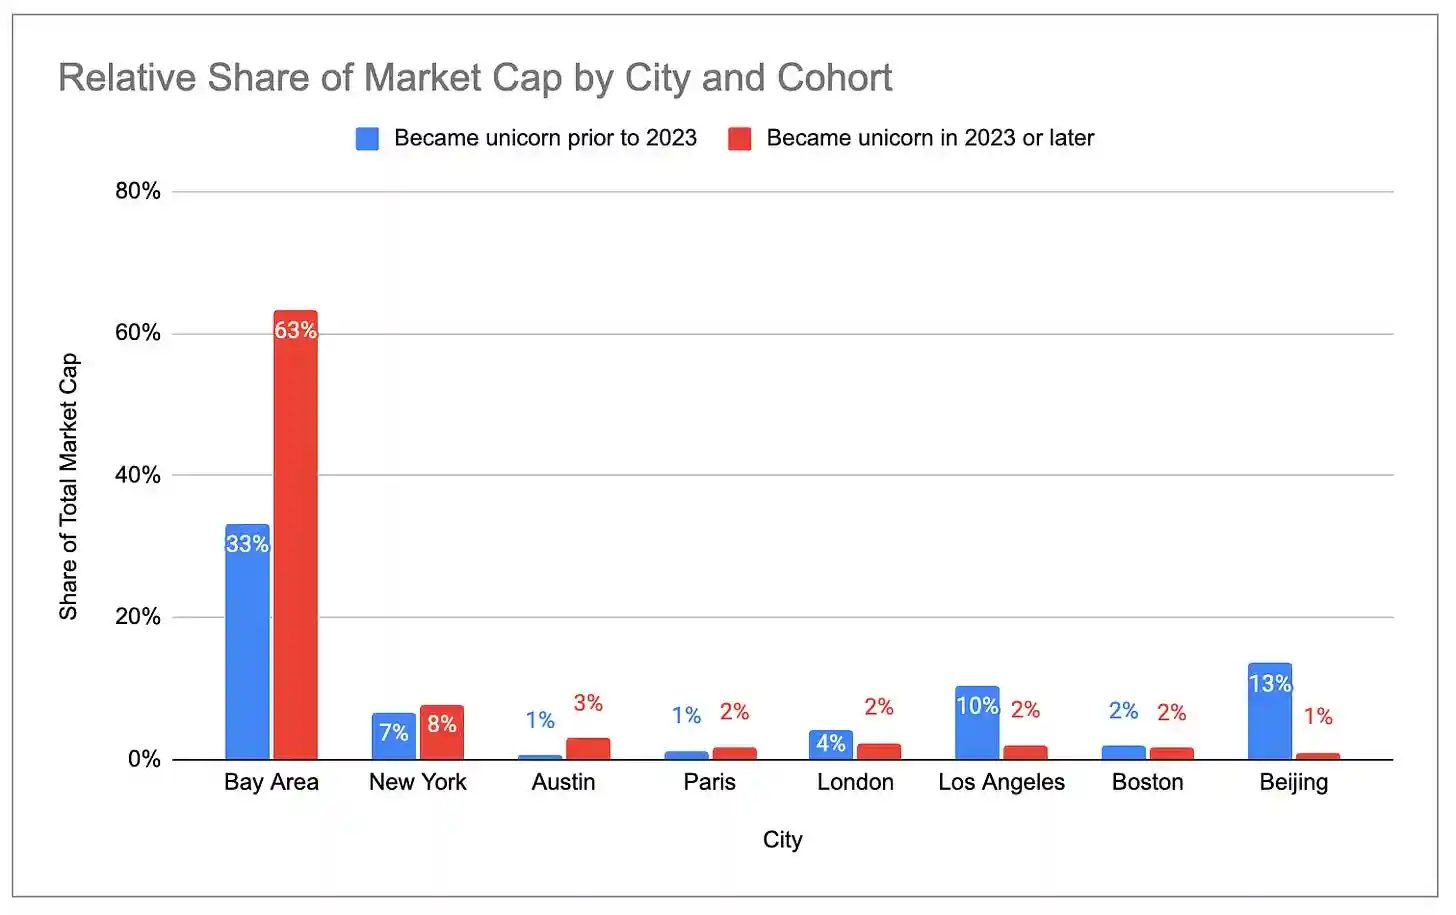
  3. Newer unicorns are more concentrated in the US and the Bay Area. Among unicorns born in 2023 and later, the US accounts for 83% of the total market value, compared to only 60% for those born in 2022 and earlier. The Bay Area's share is even more dramatic: 63% for the new generation vs. 33% for the old generation.
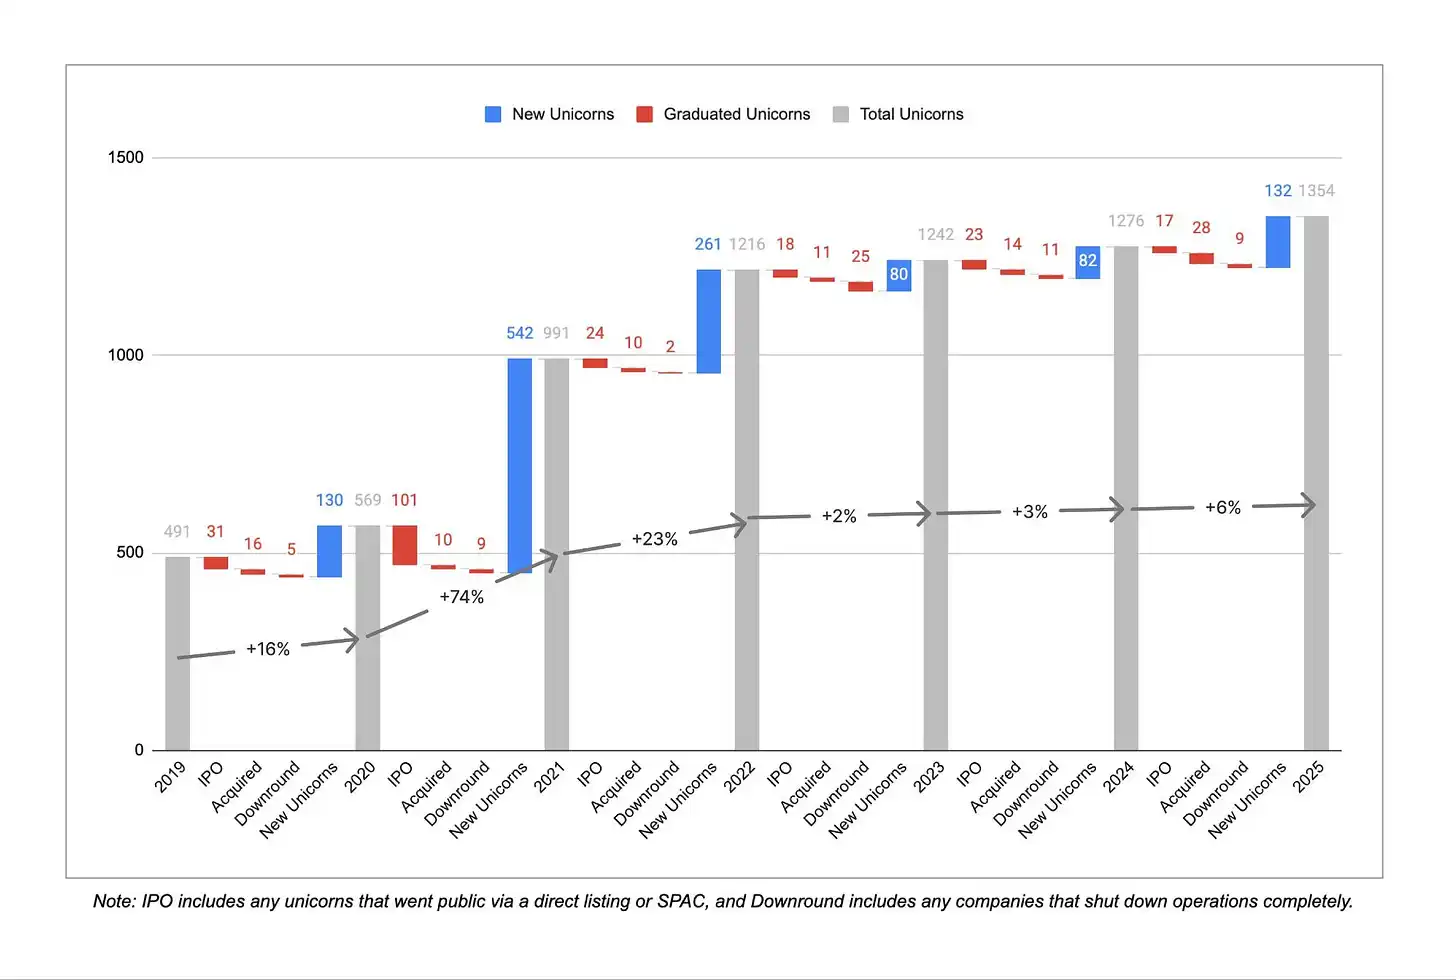
  4. The birth rate of new unicorns is slowing down. Only about 300 new unicorns were added between 2022 and 2025, compared to over 900 in the previous three years.
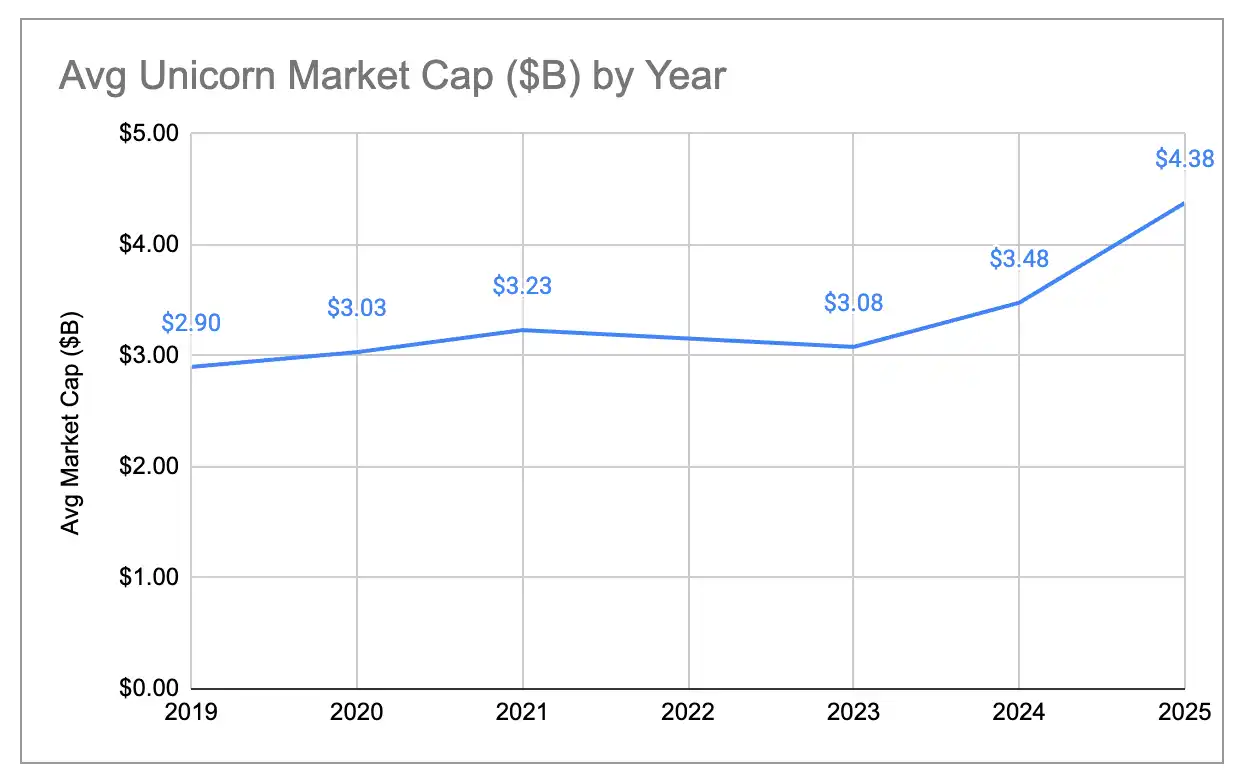
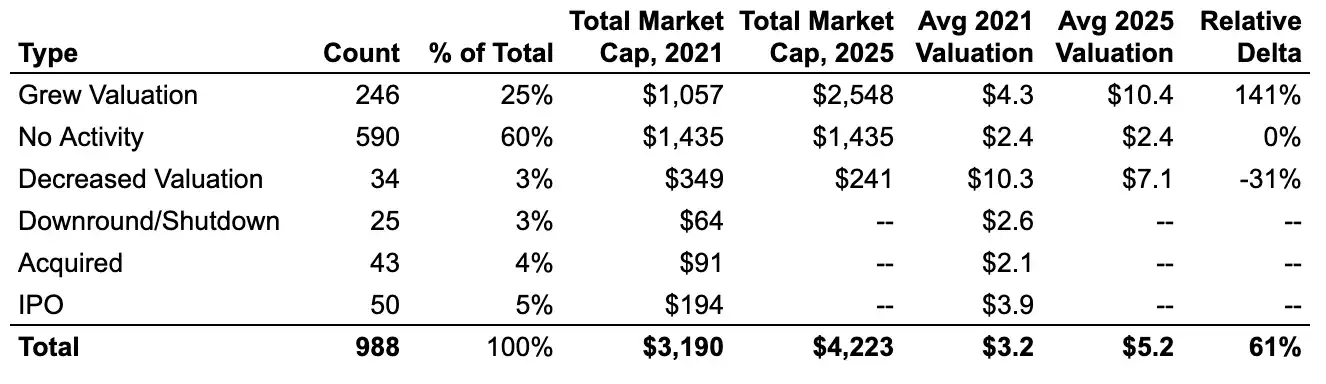
  5. But existing unicorns are more valuable than ever. The total number of unicorns increased by only 6% year-on-year, but the total market value grew by 33%. The average market value per unicorn reached its highest level in six years.
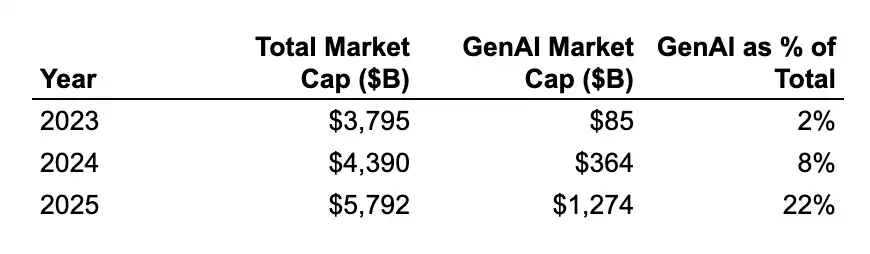
  6. Valuation growth is primarily driven by AI companies. In 2025, the valuation of generative AI unicorns grew by an average of about $2.2 billion year-on-year, compared to only about $400 million for non-AI unicorns. The share of generative AI in the global unicorn market value surged from 2% in 2024 to 22%. The concentration in the Bay Area will only continue to increase.
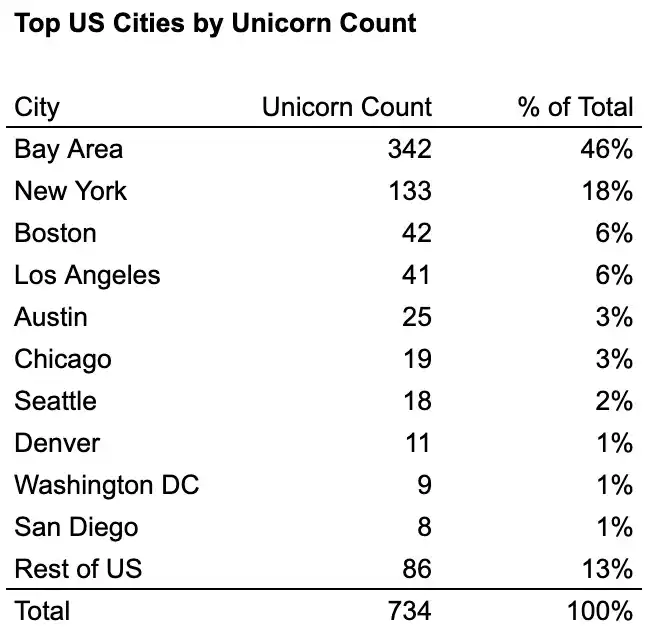
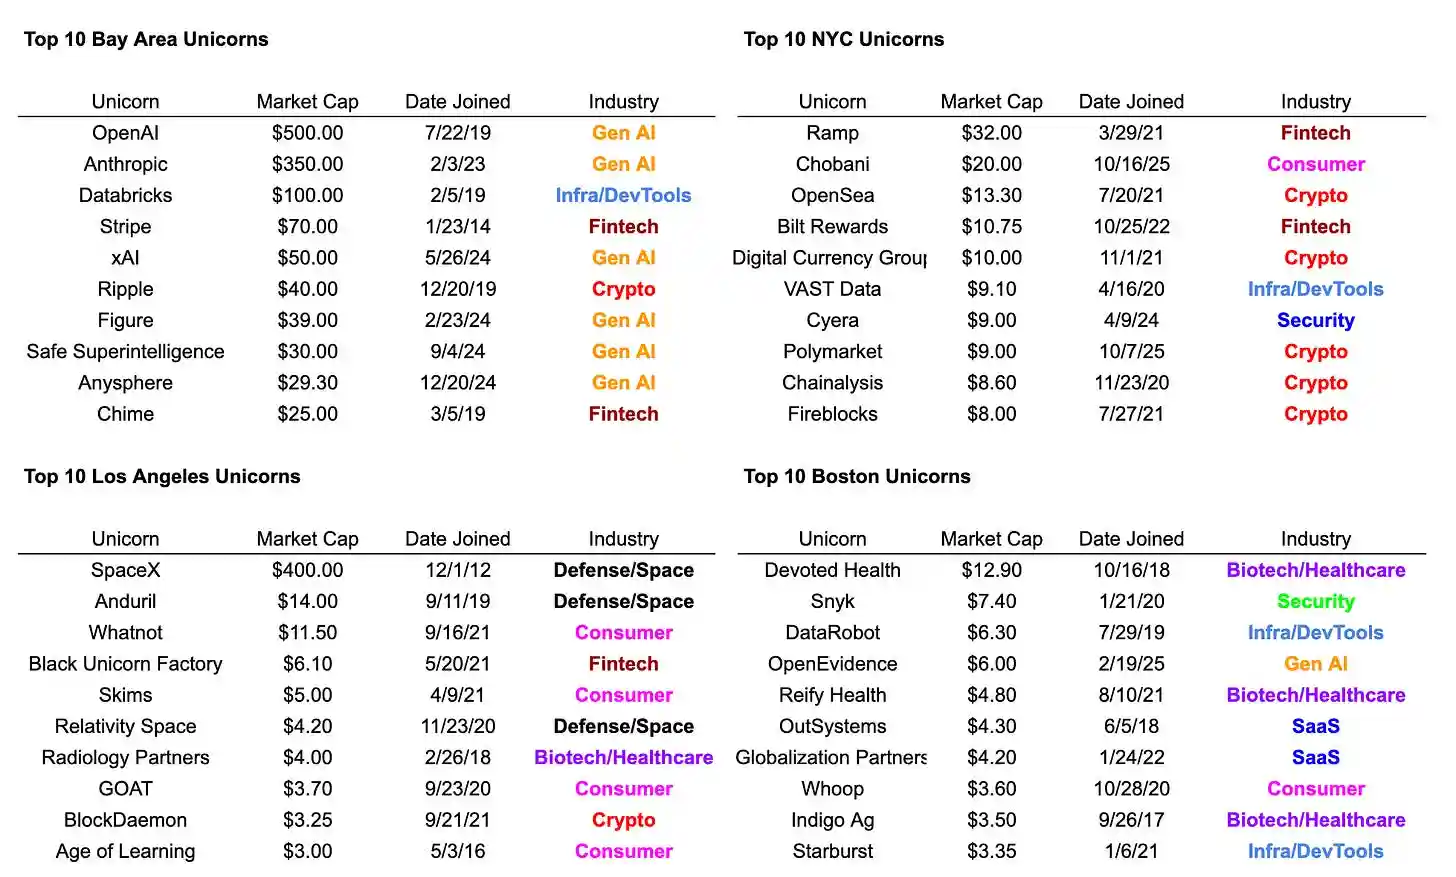
  7. Unicorn hubs cluster around specific industries. 6 of the Bay Area's top 10 unicorns are AI companies; 7 of New York's top 10 are fintech/crypto companies; 3 of Los Angeles' top 5 are defense/space companies (SpaceX, Anduril, Relativity, accounting for 83% of LA's total market value), and its top 10 includes 4 consumer companies.

Data Notes

All raw data comes from CB Insights, viewable here. A few points to note:

There is a lag in updating private financing rounds in public datasets; some unicorn valuations may not be the latest. For example, the latest funding rounds for Anduril, Stripe, and SpaceX are not reflected in the data.

Unicorn market value is, at best, a rough, lagging proxy indicator of startup ecosystem activity, and there are inevitable errors in mapping companies to valuations, cities, and industries. But we believe the data is accurate in its broad direction.

Unicorn Concentration

The geographical concentration of global unicorn market value is at an all-time high. The US accounts for 65% of all unicorn market value, up from 58% a year ago and 44% in 2020. The US share is about 4 times that of China, the second-ranked country.

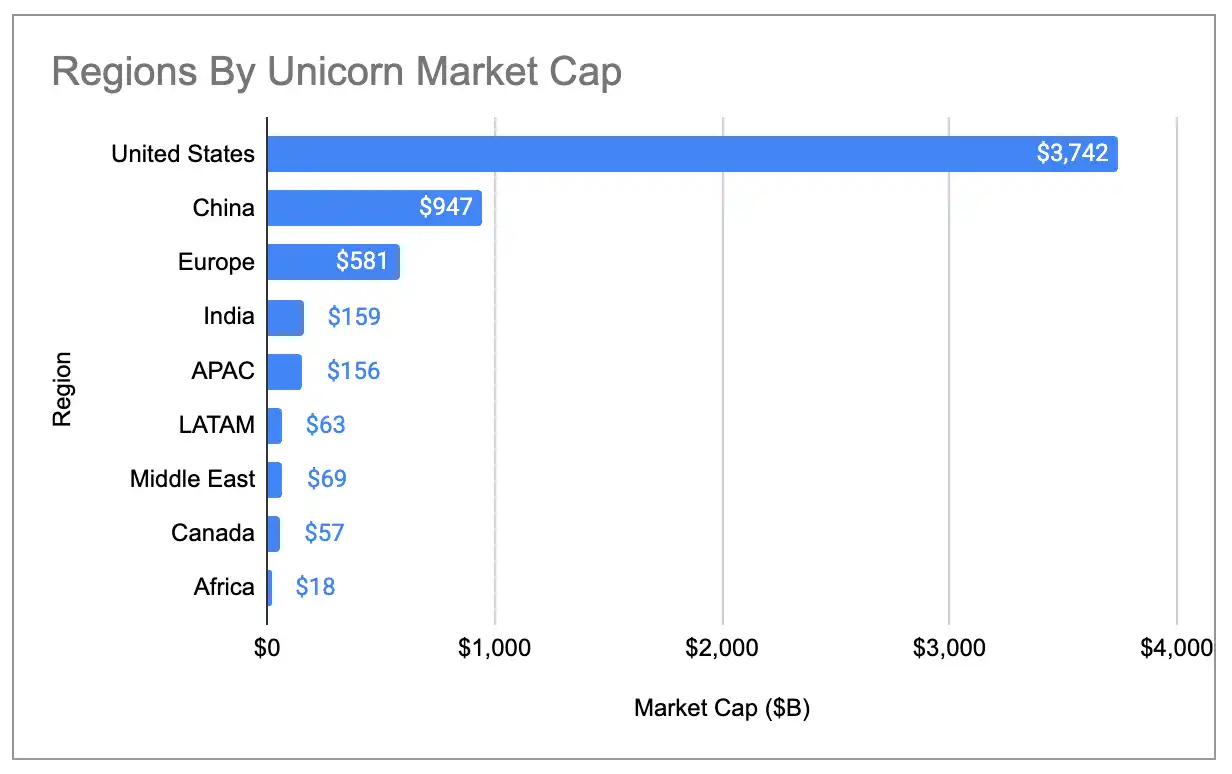
Caption: Global share of unicorn market value by country (including three outliers)

The Bay Area's unicorn market value is more than 4 times that of the second-ranked city, with its global share growing from 29% in 2024 to 39%:

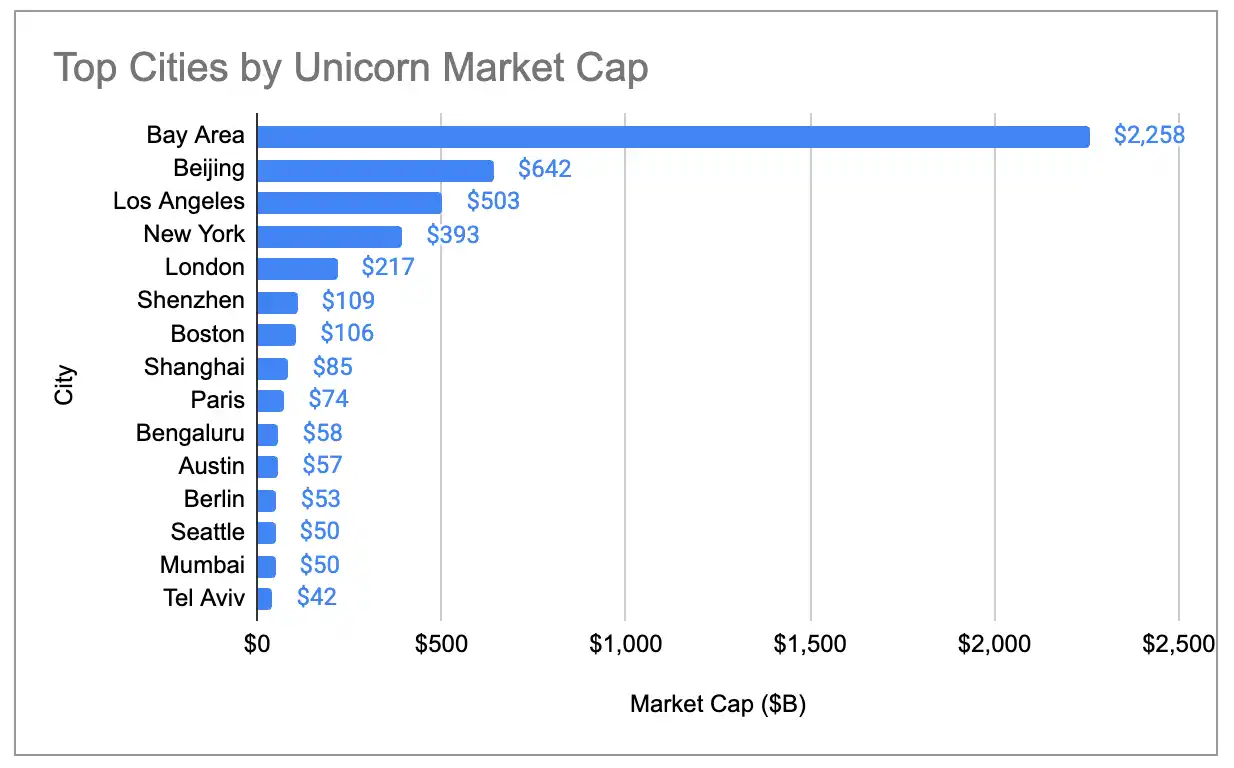
Caption: Global share of unicorn market value by city (including three outliers)

Even after removing the three largest outliers—OpenAI ($500B), SpaceX ($400B), and ByteDance ($300B)—the major ecosystems have continued to concentrate since 2019. The US share has steadily risen, while China's has steadily declined. Europe's total unicorn market value surpassed China's in 2024, and New York and London have also overtaken Beijing.

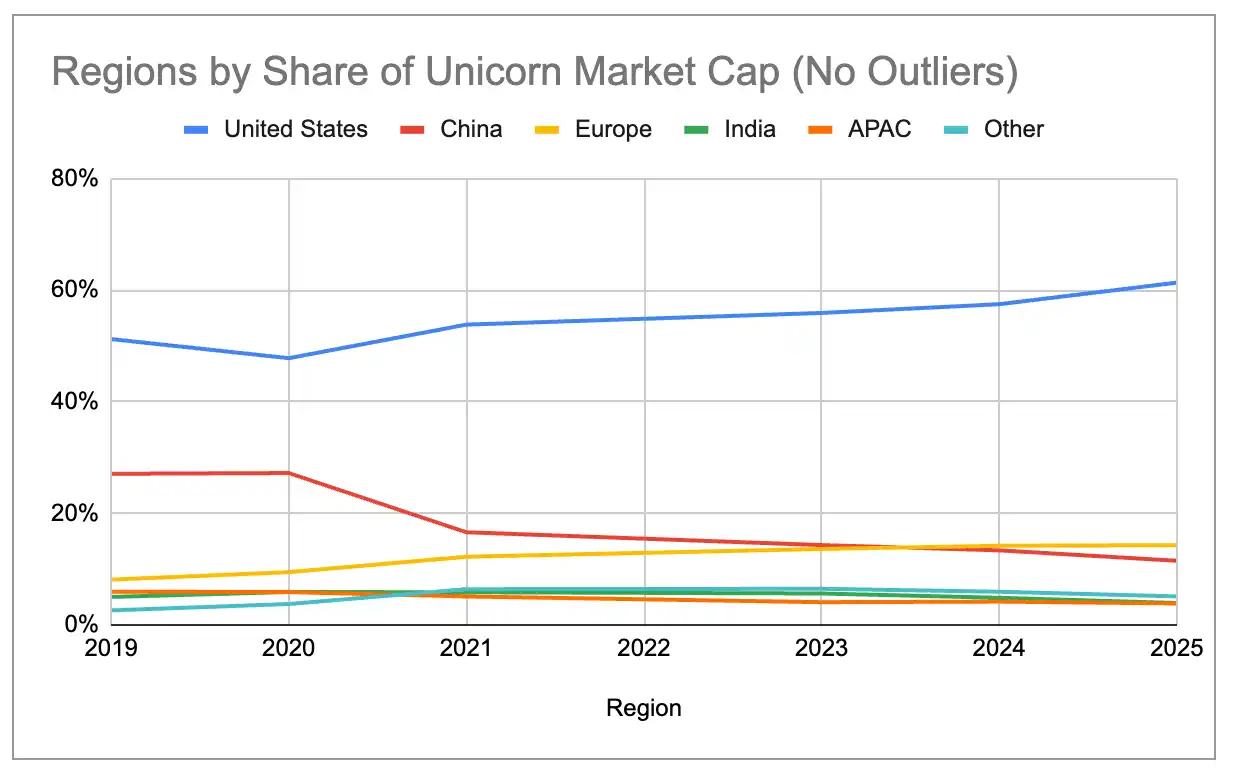
Caption: Global share of unicorn market value by country (excluding three outliers)

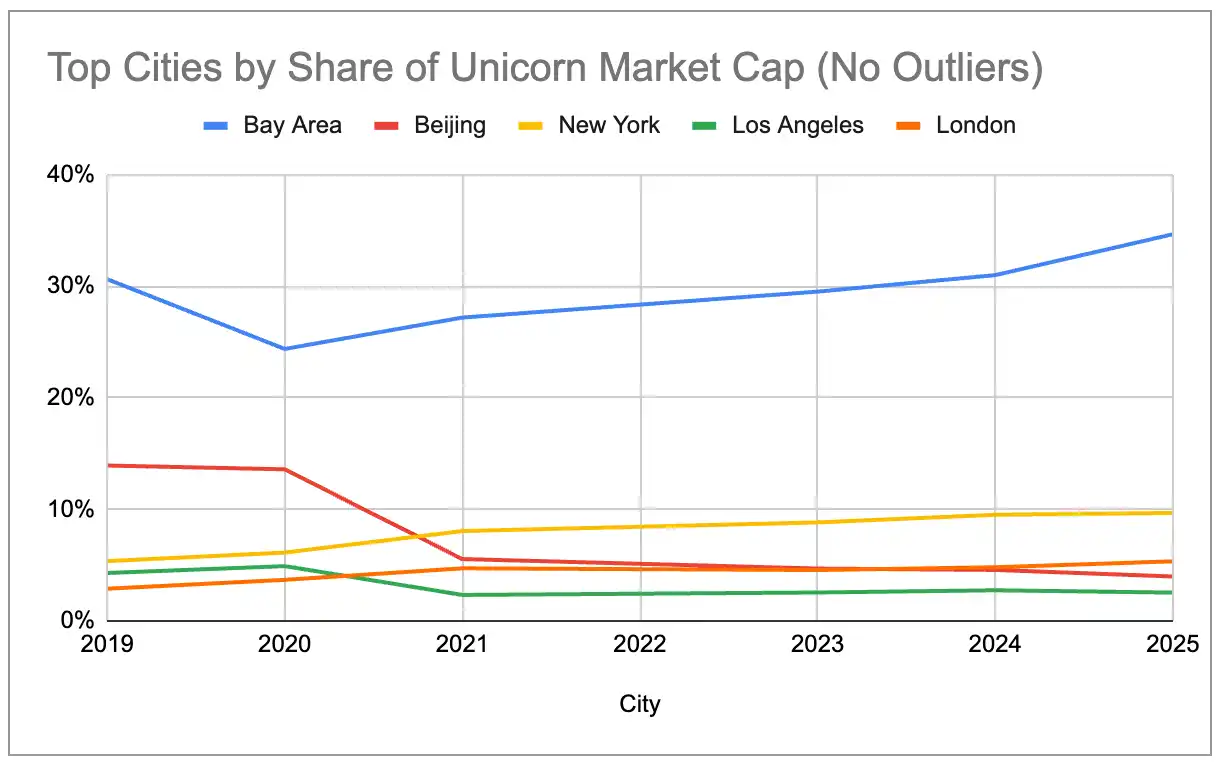
Caption: Global share of unicorn market value by city (excluding three outliers)

Super Concentration of Generative AI

Looking solely at the 97 unicorns whose core revenue comes from generative AI products/services, the cluster effect in the Bay Area is even more extreme. The Bay Area holds 91% of the global AI unicorn market value, with no other city exceeding 2%.

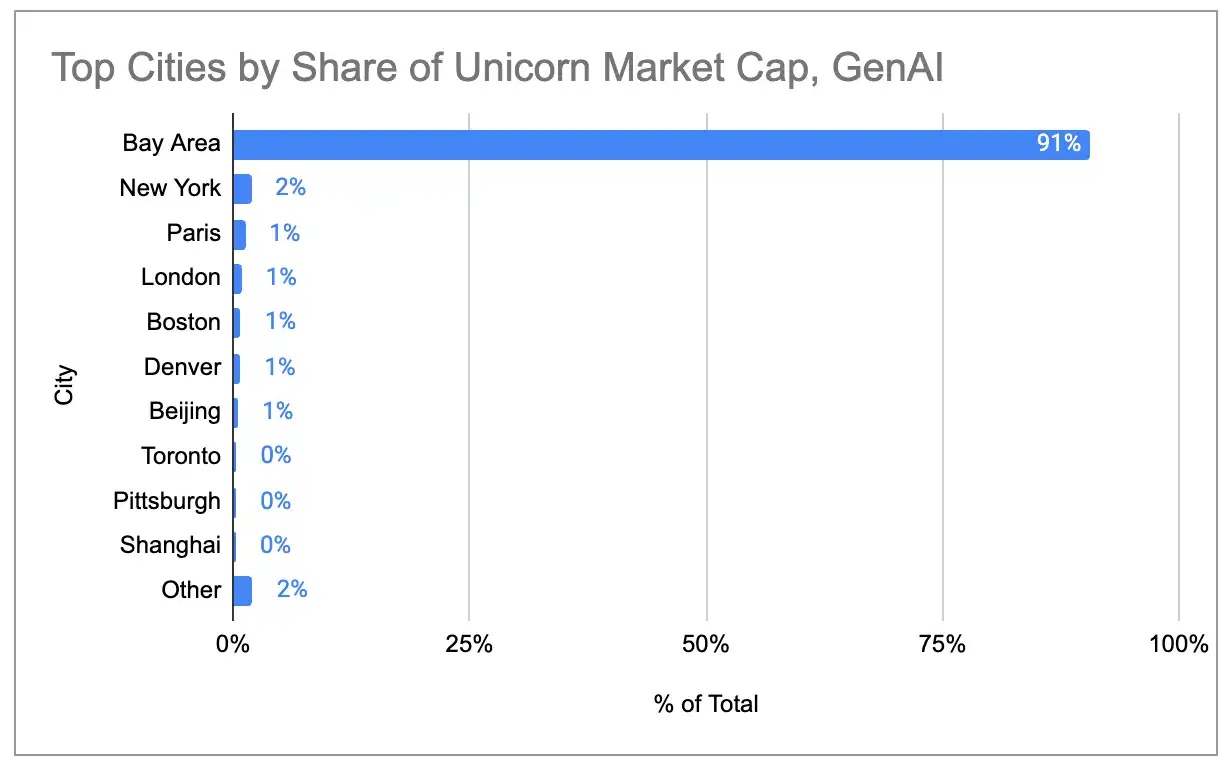
Caption: City distribution of generative AI unicorn market value

The total market value of generative AI unicorns has grown exponentially, with almost all the增量 coming from the US, especially the Bay Area.

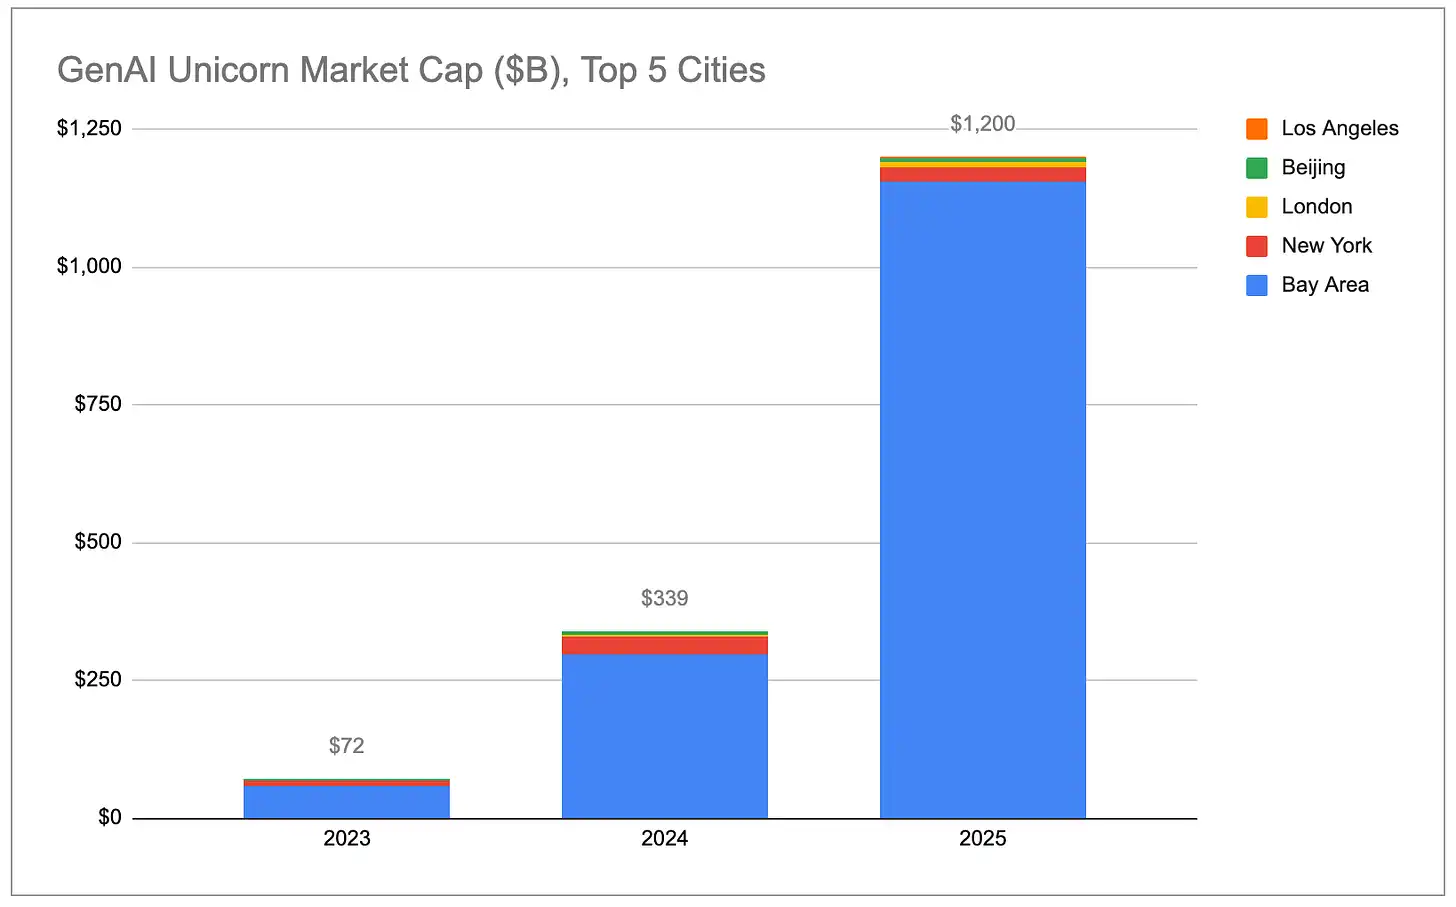
Caption: Total market value of generative AI unicorns (by country)

Caption: Total market value of generative AI unicorns (by city)

AI unicorn valuation growth far outpaces non-AI unicorns. The 48 AI companies that were unicorns throughout 2025 saw their total market value grow by $778 billion during the year. This figure exceeds the combined market value increase of the remaining 1100+ non-AI unicorns. Even excluding OpenAI (~$343B increase) and Anthropic (~$334B increase), the average year-on-year valuation growth for generative AI unicorns was about $2.2 billion, 5 times the average growth of non-AI unicorns (~$440 million).

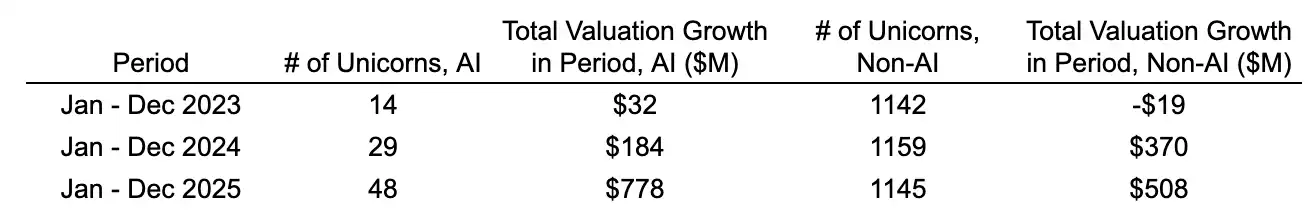
Caption: Market value growth comparison: AI unicorns vs. non-AI unicorns

In relative terms, generative AI companies grew from 2% of the global unicorn market value in 2023 to 22%. If this trend continues, the Bay Area's share of the global unicorn market value will continue to expand, thanks to its de facto monopoly on top AI companies and talent.

<极div>

Caption: Change in the proportion of generative AI in total unicorn market value

(Note: We only classify companies whose primary revenue comes directly from generative AI as "generative AI." A full list of companies can be viewed here. We included chip/hardware companies like Cerebras and TensTorrent, and infrastructure companies like CoreWeave and Crusoe, but did not include data infrastructure companies like Databricks that more broadly support AI/ML workloads, nor robotics/defense companies like Anduril that use AI/ML for autonomous systems.)

New Unicorns

Caption: Number of new unicorns per year

After three years of high growth, the birth rate of new unicorns has slowed significantly over the past three years. Between December 2019 and December 2022, an average of over 300 companies became unicorns for the first time each year. From December 2022 to December 2025, this number dropped to about 100 per year, although 2025 saw a rebound compared to the previous two years.同时, over the past three years, 45 companies lost their unicorn status due to valuation markdowns or shutdowns, compared to only 16 in the previous three years, indicating that the correction of inflated valuations from the 2021/2022 zero-interest rate era is ongoing.

Caption: Trend of unicorn count vs. total market value

Although the number of unicorns has remained largely flat, the total market value has grown significantly. Over the past year, the global unicorn total market value grew from about $4.4 trillion to about $5.8 trillion, an increase of 33%. This is a strong rebound, especially relative to 2023 when the total market value actually shrank year-on-year. Historically, market value growth was driven more by new companies becoming unicorns, but in 2025, about 80% of the market value growth came from valuation increases of existing unicorns. The result is that the average market value per unicorn rose from about $3 billion to about $4.4 billion, the highest value in the six years we have been doing this analysis. It has become harder to become a unicorn, but once past the $1 billion threshold, these companies are, on average, more valuable and growing faster.

Caption: Trend in average unicorn market value

New Generation vs. Old Generation Unicorns

One way to剔除 the influence of inflated valuations from the zero-interest rate era is to look only at unicorns born after 2023. Here is a comparison of the market value distribution between the two batches of unicorns before and after 2023:

Caption: Market value distribution of unicorns born before 2023 (by country/city)

Caption: Market value distribution of unicorns born in 2023 and later (by country/city)

New generation unicorns are more concentrated in the US, with shares declining for Europe and China. Among unicorns added since 2023, the Bay Area accounts for 63% of the market value, compared to only 33% for the older batch of unicorns.

"Zombie" Unicorns

Of the nearly 1000 unicorns in December 2021, about 60% have maintained their unicorn status but have not completed any new funding rounds. These "zombie" unicorns raised enough money during the zero-interest rate era to survive至今 but have been unable to surpass their previous valuations. They collectively account for about $1.4 trillion of the current global unicorn market value, nearly 25% of the global total.

Caption: Proportion of "Zombie" vs. "Active" among 2021 Unicorns

The proportion of "active" unicorns (those that have completed new funding rounds since 2021) in the US and the Bay Area is much higher than that of "zombie" unicorns. In contrast, Europe, India, Latin America, and New York have a higher concentration of "zombie" unicorns.

Caption: Market value distribution of "Zombie" vs. "Active" unicorns by country

Caption: Market value distribution of "Zombie" vs. "Active" unicorns by city

Four Major US Unicorn Clusters

Within the US, four "industry cities" account for about 76% of the unicorn count and about 87% of the unicorn market value: the Bay Area, New York, Los Angeles, and Boston. The Bay Area is the absolute leader, with more than twice the number of unicorns of the second-ranked city and more than four times the market value.

Caption: Number of unicorns in major US cities

Caption: Unicorn market value in major US cities

Looking at the industry distribution of the top 10 unicorns in each city, the clustering effect of industry cities is clear:

  • Bay Area = AI Cluster (6 of the top 10 are generative AI)
  • New York = Fintech/Crypto Cluster (7 of the top 10)
  • Los Angeles = Defense/Space + Consumer Cluster (3 of the top 6 are defense/space, 4 of the top 10 are consumer)
  • Boston = Relatively balanced, but偏向 biotech/healthcare (3 of the top 10)

Caption: Industry distribution of Top 10 unicorns in four major US cities

Связанные с этим вопросы

QAccording to the report, what percentage of the world's generative AI unicorn market value is concentrated within an hour's drive of the San Francisco Bay Area?

A91% of the world's generative AI unicorn market value is concentrated within an hour's drive of the San Francisco Bay Area.

QWhat is the United States' share of the global unicorn market value as of the end of 2025, and how does this compare to the previous year?

AThe United States' share of the global unicorn market value is about 65% as of the end of 2025, which is an increase from 58% the previous year.

QHow has the average valuation of a unicorn company changed, reaching what is described as a six-year high?

AThe average valuation of a unicorn company has risen to approximately $4.4 billion, which is the highest level in the six years the analysis has been conducted.

QWhat major trend is identified regarding the birth rate of new unicorns between 2022-2025 compared to the preceding three-year period?

AThe birth rate of new unicorns has slowed significantly. Only about 300 new unicorns were added between 2022 and 2025, compared to over 900 in the previous three-year period (2019-2022).

QWhich specific industry clusters are identified for the top unicorns in New York and Los Angeles?

AIn New York, the top unicorns form a FinTech/Crypto cluster (7 out of the top 10). In Los Angeles, the top unicorns form a Defense/Aerospace cluster (3 of the top 5) and a Consumer cluster (4 of the top 10).

Похожее

Торговля

Спот
Фьючерсы

Популярные статьи

Как купить S

Добро пожаловать на HTX.com! Мы сделали приобретение Sonic (S) простым и удобным. Следуйте нашему пошаговому руководству и отправляйтесь в свое крипто-путешествие.Шаг 1: Создайте аккаунт на HTXИспользуйте свой адрес электронной почты или номер телефона, чтобы зарегистрироваться и бесплатно создать аккаунт на HTX. Пройдите удобную регистрацию и откройте для себя весь функционал.Создать аккаунтШаг 2: Перейдите в Купить криптовалюту и выберите свой способ оплатыКредитная/Дебетовая Карта: Используйте свою карту Visa или Mastercard для мгновенной покупки Sonic (S).Баланс: Используйте средства с баланса вашего аккаунта HTX для простой торговли.Третьи Лица: Мы добавили популярные способы оплаты, такие как Google Pay и Apple Pay, для повышения удобства.P2P: Торгуйте напрямую с другими пользователями на HTX.Внебиржевая Торговля (OTC): Мы предлагаем индивидуальные услуги и конкурентоспособные обменные курсы для трейдеров.Шаг 3: Хранение Sonic (S)После приобретения вами Sonic (S) храните их в своем аккаунте на HTX. В качестве альтернативы вы можете отправить их куда-либо с помощью перевода в блокчейне или использовать для торговли с другими криптовалютами.Шаг 4: Торговля Sonic (S)С легкостью торгуйте Sonic (S) на спотовом рынке HTX. Просто зайдите в свой аккаунт, выберите торговую пару, совершайте сделки и следите за ними в режиме реального времени. Мы предлагаем удобный интерфейс как для начинающих, так и для опытных трейдеров.

1.2k просмотров всегоОпубликовано 2025.01.15Обновлено 2025.03.21

Как купить S

Sonic: Обновления под руководством Андре Кронье – новая звезда Layer-1 на фоне спада рынка

Он решает проблемы масштабируемости, совместимости между блокчейнами и стимулов для разработчиков с помощью технологических инноваций.

2.2k просмотров всегоОпубликовано 2025.04.09Обновлено 2025.04.09

Sonic: Обновления под руководством Андре Кронье – новая звезда Layer-1 на фоне спада рынка

HTX Learn: Пройдите обучение по "Sonic" и разделите 1000 USDT

HTX Learn — ваш проводник в мир перспективных проектов, и мы запускаем специальное мероприятие "Учитесь и Зарабатывайте", посвящённое этим проектам. Наше новое направление .

1.8k просмотров всегоОпубликовано 2025.04.10Обновлено 2025.04.10

HTX Learn: Пройдите обучение по "Sonic" и разделите 1000 USDT

Обсуждения

Добро пожаловать в Сообщество HTX. Здесь вы сможете быть в курсе последних новостей о развитии платформы и получить доступ к профессиональной аналитической информации о рынке. Мнения пользователей о цене на S (S) представлены ниже.

活动图片

Топ вопросы

Популярные категорииright-arrow

Популярные тегиright-arrow