BofA's Hartnett: Brace for the 'June Storm', US CPI to 'Burst the Bubble'

marsbitОпубликовано 2026-06-08Обновлено 2026-06-08

Введение

Bank of America strategist Hartnett warns of a potential "June storm" for markets, with an unexpectedly high US CPI print set to be the key catalyst. Historical data shows that when CPI surpasses 4%, the S&P 500 has historically fallen by an average of 4% over the next 3 months and 7% over 6 months. A confluence of risks threatens to puncture the tech asset bubble. Global central banks, notably the Fed under Chair Warsh, are tilting hawkish to combat inflation, risking a sharp rise in long-term bond yields. Market sentiment is at an extreme, with BofA's internal indicators flashing a strong "sell signal." Further pressure comes from record liquidity drainage due to mega IPOs like SpaceX, alongside key non-economic events. Hartnett concludes that risk assets are in an extremely fragile position, facing a severe test from macro events, policy shifts, and tightening liquidity in June.

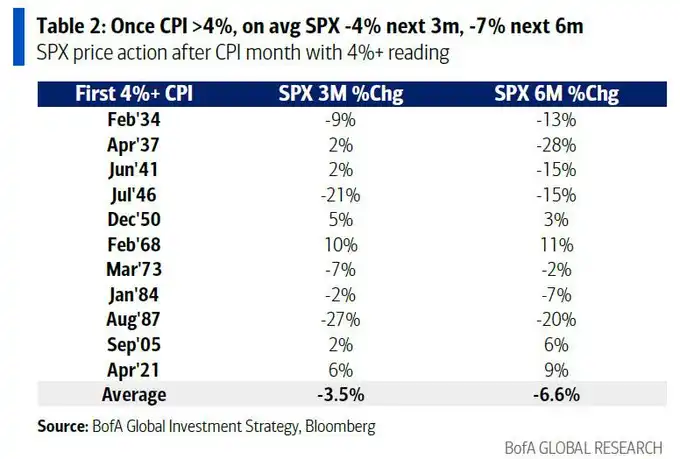
BofA strategist Hartnett issued a warning: if upcoming inflation data exceeds expectations, it will directly trigger a sell-off in risk assets. Historical data shows that over the past 100 years, once CPI breaks above 4%, the S&P 500 index has fallen by an average of 4% over the next 3 months and 7% over 6 months.

Furthermore, market "sell signals" are strengthening, with mega IPOs like SpaceX set to drain record liquidity, combined with risks of a hawkish pivot by global central banks, leaving the tech bubble in an extremely fragile moment.

U.S. stocks face a severe stress test in June. Bank of America strategist Michael Hartnett warns that a series of concentrated macro event risks and a sharp withdrawal of market liquidity could drive global bond yields significantly higher, thereby bursting the current technology asset bubble.

According to Flow Trading Desk, Hartnett stated in his latest research report that the upcoming U.S. CPI data is the core catalyst for this "June storm". If the latest inflation data exceeds expectations, it will directly trigger the mechanism for selling risk assets. Historical data shows that when inflation breaks through key warning levels, it often triggers a deep correction in U.S. benchmark stock indices in the following months.

Simultaneously, intensive resolutions and statements from global central banks are steering the market's direction. Particularly, the Federal Open Market Committee (FOMC) meeting led by the new Fed Chair Wash is a key event. Its policy stance, whether hawkish or dovish, will determine the fate of U.S. stocks and long-term bond yields. Any unexpectedly tight signal will hit investors hard.

Against a backdrop of extremely euphoric bullish sentiment, Bank of America's internal sentiment indicators have issued a strong "sell signal." Coupled with the unprecedented liquidity drain from imminent mega tech IPOs, current risk assets are in an extremely vulnerable position.

Key Inflation Data Approaches, U.S. Stocks Face Historic Pullback Risk

The U.S. CPI data to be released on June 10th is the first major test for the market.

Over the past three months, this data has averaged a month-on-month increase of 0.6%; over the past six months, the average is 0.4%. If May's CPI month-on-month growth exceeds 0.4% (the current market expectation is 0.5%), it means the U.S. CPI year-on-year growth rate will break above 4% and could head towards 5% before the U.S. midterm elections. This trend would make risk assets extremely uneasy.

Historical data shows that over the past 100 years, once CPI breaks above 4%, the S&P 500 index has fallen by an average of 4% over the next 3 months and 7% over 6 months.

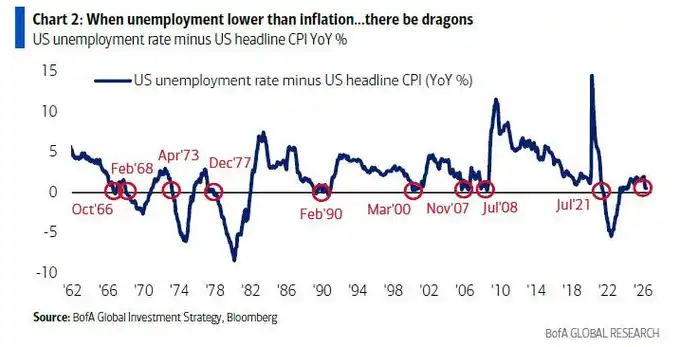
Another inflation indicator that cannot be ignored is the crossover between the unemployment rate and CPI.

In May, there is a "small probability but high-impact possibility" that the U.S. unemployment rate (consensus expectation 4.3%) could equal or fall below the inflation rate (consensus expectation 4.2%). This would be only the 7th occurrence since 1960. In years when inflation is close to or higher than unemployment (such as 1966, 1973, 2008, and 2021), the Federal Reserve typically resorts to interest rate hikes, and Wall Street's memories of these years are often painful.

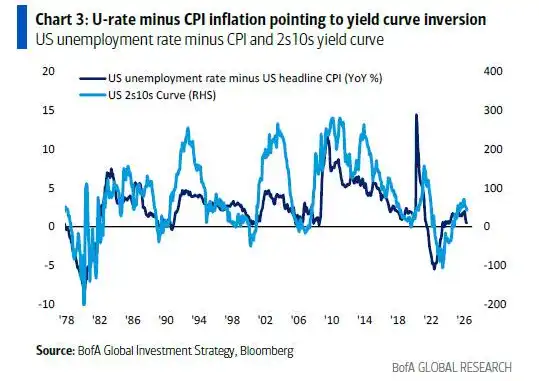
Furthermore, the spread between the unemployment rate and CPI is highly correlated with the U.S. yield curve and is currently pointing towards a near-term curve inversion, which is another signal with negative implications for risk assets.

Global Central Bank Meetings Dense, Bond Yields May End the Boom

"Booms and bubbles are ultimately ended by bonds," Michael Hartnett reiterated this logic in the report.

He warns that a series of events in June could push the UK 30-year bond yield above 6%, the U.S. above 5%, and Japan above 4%. With the market saturated with bullish positions and optimistic earnings expectations, a surge in yields would undoubtedly be negative for risk assets.

Global central banks are currently significantly lagging behind the inflation curve. Among 68 global central banks, 46 currently have inflation levels exceeding their target or the absolute median of their target range. Against this backdrop, the European Central Bank (ECB) has a 98% probability of raising rates by 25 basis points, while the probability of the Bank of Japan (BoJ) raising rates by 25 basis points also reaches 83%, with the latter urgently needing this to prevent the yen from breaking below the "Maginot Line" of 160 per dollar.

The June 17th FOMC meeting led by Wash is seen as one of the two most important events this month.

The market currently faces a policy dilemma: if Wash is too dovish, long-term yields will head towards 6%; if too hawkish, the S&P 500 risks a correction towards the 7000-point zone; while a "Goldilocks"-style moderate stance could propel the NYSE Composite Index (NYA) to break above the all-time high of 24000 points.

As Wash stated back in 2024, global central banks seem complacent with inflation nearing 3%, and the 2% inflation target is no longer taken seriously. This compromise is extremely dangerous.

Wealth Effect Fuels Inflation, Extreme Sentiment Triggers "Sell Signal"

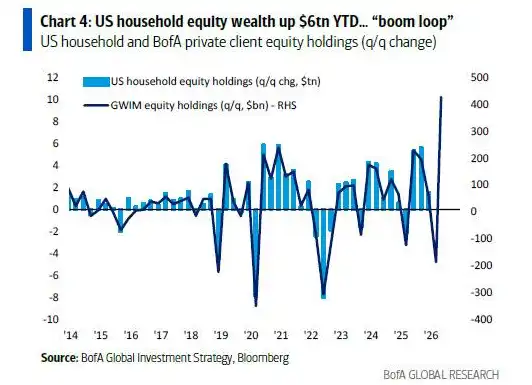
From a macroeconomic perspective, the U.S. is experiencing a K-shaped recovery driven by a "wealth-stock market virtuous cycle."

U.S. household stock wealth has increased by $6 trillion year-to-date. This "wealth-price spiral" directly exacerbates inflationary pressures. Despite economic prosperity, voters' perceptions are not uniform. Currently, Trump's approval rating on inflation is already lower than Biden's lowest levels.

In terms of fund flows, investors have recently shown an extreme tendency to chase the tech bubble. Last week's data showed a massive $122 billion flowing into cash, $39 billion into bonds (a record high), and $23.1 billion into equities. Meanwhile, cryptocurrencies saw outflows of $2 billion and gold outflows of $3.1 billion, indicating investors are selling other assets to chase technology and semiconductor sectors.

The extreme fund flows have caused Bank of America's Bull/Bear indicator to rise further from 8.5 to 8.7, making the "sell signal" triggered two weeks ago even stronger.

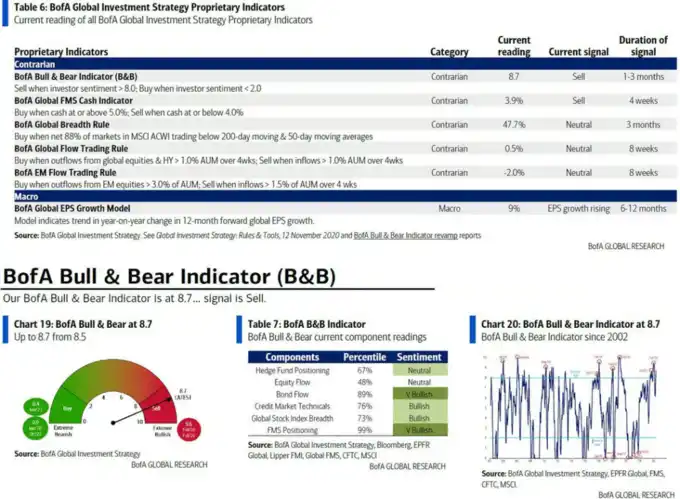
Historical data shows that among the 17 "sell signals" since 2002, global stocks have lost an average of 2% to 3% over the subsequent 2 to 3 months, with maximum drawdowns reaching 15% to 20%. Additionally, global breadth indicators show that 48% of global stocks are in overbought territory.

Mega IPOs Drain Liquidity, Non-Economic Events Intensify Market Turmoil

Beyond macroeconomic data, the biggest non-economic event risk in June comes from massive capital market supply.

SpaceX's initial public offering (IPO) is set to start trading next Friday. Along with Anthropic and OpenAI's offerings and the end of related lock-up periods, this will drain record liquidity from the market. The impact of this scale of liquidity tightening as a market catalyst may even surpass the decisions of central banks.

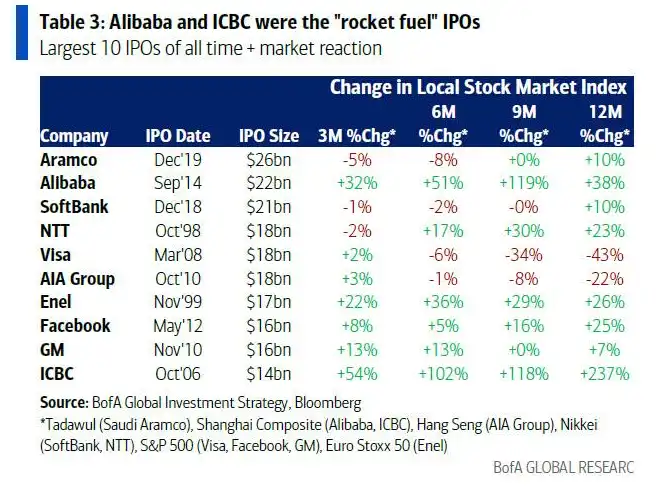
The impact of historical mega IPOs on the market is mixed.

While IPOs like Alibaba and ICBC once acted as market boosters, the listings of Visa and AIA marked market "tops," with the S&P 500 and the Hang Seng Index declining significantly within 9 to 12 months after these IPOs.

Hartnett believes that this political shift is the core reason why Latin American bond yields and spreads are at historic lows (falling to 217 basis points, the lowest since November 2007). A similar trend of political rightward shift is also evident in Europe.

For investors, this means a profound, substantive reassessment of global economic policy preferences is underway in the near term.

Связанные с этим вопросы

QAccording to Michael Hartnett of Bank of America, what is the potential impact on the S&P 500 if the upcoming CPI data exceeds expectations?

AAccording to Michael Hartnett, if the upcoming CPI data exceeds expectations, it could directly trigger a sell-off in risk assets. Historical data shows that once CPI surpasses 4%, the S&P 500 index has historically fallen an average of 4% over the subsequent three months and 7% over six months.

QWhat is Hartnett's view on the relationship between bond yields and the end of market booms or bubbles?

AHartnett reiterates the logic that 'booms and bubbles are ultimately ended by bonds.' He warns that events in June could cause yields on UK 30-year gilts to break above 6%, US yields above 5%, and Japanese yields above 4%, which would be bearish for risk assets.

QWhat does the Bank of America's internal sentiment indicator currently signal, and what is its historical implication?

ABank of America's internal sentiment indicator, the Bull/Bear indicator, has triggered a strong 'sell signal,' rising further from 8.5 to 8.7. Historically, since 2002, following the 17 previous 'sell signals,' global equities have lost an average of 2% to 3% over the subsequent two to three months, with maximum drawdowns reaching 15% to 20%.

QAside from macro data, what significant non-economic event risk does Hartnett identify for June, and what is its potential market impact?

AHartnett identifies the massive capital market supply from mega IPOs, specifically mentioning SpaceX's upcoming IPO launch, as a significant non-economic event risk for June. He states it could drain record liquidity from the market, with its catalytic power potentially even exceeding central bank decisions.

QWhat specific policy dilemma does Hartnett outline for the June FOMC meeting chaired by the new Fed Chair, and what are the potential market outcomes for each scenario?

AHartnett outlines a policy dilemma for the FOMC meeting: if the new Chair is too dovish, long-term yields could head towards 6%; if too hawkish, the S&P 500 risks a correction towards the 7000-point area; a 'Goldilocks' or just-right stance could push the NYSE Composite Index to a new all-time high above 24,000 points.

Похожее

Trump in Talks with AI Companies Over Profit Sharing, A Narrative Pressure of Industrial Revolution Scale Begins

In recent AI market discussions, a new dimension beyond growth and profits has emerged: the question of how the immense wealth potentially generated by AI should be shared with the wider public. Triggered by reports of White House officials discussing "voluntary equity transfers" with top AI firms, similar to models like Alaska's Permanent Fund, the conversation focuses on public wealth funds. OpenAI's own whitepaper proposes such funds, allowing households without direct tech stock ownership to benefit from AI gains. More radical proposals, like Bernie Sanders' call for high public equity stakes and board seats, represent an extreme end of the spectrum. Currently, these are early-stage policy probes, not enacted laws. OpenAI's initiative is seen as an attempt to secure "social license" for its future expansion, mitigating risks of public backlash, stricter regulation, or anti-trust actions as AI's economic impact grows. The core market implication is the introduction of a "policy discount" to AI valuations, particularly for private model companies like OpenAI, Anthropic, and xAI. Investors must now consider not just future earnings but also what portion might be allocated to public mechanisms. The impact varies greatly based on the mechanism. A small, voluntary transfer of non-voting economic rights (e.g., 5%) acts as a quantifiable long-term cost. Government acquisition of economic rights via warrants tied to support differs from direct equity with governance power. The most disruptive scenario would be forced high-percentage public ownership affecting control and innovation incentives. Key signals to watch include whether other AI companies follow suit, if the White House formalizes proposals, related disclosures in future IPO documents, and any market price reactions. For now, this represents a shift from pricing pure AI growth to pricing its potential distribution. A manageable, voluntary economic share is akin to an insurance cost for societal acceptance, while a forced shift toward control and governance would fundamentally alter valuation logic.

marsbit3 мин. назад

Trump in Talks with AI Companies Over Profit Sharing, A Narrative Pressure of Industrial Revolution Scale Begins

marsbit3 мин. назад

From Record Highs to a Two-Week Low: Why Did AI Concept Stocks Suddenly Pull Back?

From Record Highs to Two-Week Lows: Why Did AI Stocks Suddenly Pull Back? U.S. stock indices, led by the tech-heavy Nasdaq 100, fell sharply to two-week lows. This marked a reversal from earlier in the week when AI infrastructure and semiconductor stocks had propelled major indices to record highs. Investors are rotating out of these previously high-flying tech sectors into other areas. The sell-off was driven by profit-taking and concerns that the AI rally had become overextended, exacerbated by chipmaker Broadcom's sales outlook falling short of lofty market expectations. The decline accelerated following a stronger-than-expected U.S. May nonfarm payrolls report, which showed 172,000 jobs added versus an estimated 88,000. This data sparked a jump in bond yields, with the 10-year Treasury yield rising to 4.553%, as it reinforced market speculation that the Federal Reserve's next move could be a rate hike rather than a cut. Globally, equities also declined, with European and Asian markets falling. Within the U.S. market, chip and AI-related stocks like Super Micro Computer and Arm Holdings led the losses, dropping over 7%. Cryptocurrency-linked stocks and mining shares also fell sharply amid drops in Bitcoin and commodity prices. While the overall Q1 earnings season remained solid, with 83% of S&P 500 companies beating estimates, the weakness was concentrated in tech. Excluding the tech sector, Q1 earnings growth was around 3%, the weakest in two years.

marsbit3 мин. назад

From Record Highs to a Two-Week Low: Why Did AI Concept Stocks Suddenly Pull Back?

marsbit3 мин. назад

JP Morgan Mid-Year Research Report Analysis: The AI Supercycle is Not Over, Reduce Cash Holdings + Allocate to Real Assets

JP Morgan's 2026 Mid-Year Outlook argues the AI supercycle is far from over, despite market pessimism. The report advises clients to reduce cash holdings, increase allocations to real assets as an inflation hedge, and focus on emerging markets. Key conclusions include: 1. **AI Supercycle Intact**: Hyperscalers' 2026 capex forecasts exceed $650B, with AI contributing to GDP growth. However, their financial profile is shifting toward heavy investment, compressing free cash flow. 2. **SaaS Disruption**: Traditional software companies are being negatively impacted by AI, with significant stock declines and pressure in credit markets. 3. **Persistent Inflation**: Core inflation is structurally higher post-pandemic. Holding excess cash and bonds leads to real wealth erosion. Recommendations include commodities, infrastructure, real estate, and gold. 4. **Geopolitical Shocks & Opportunities**: The Hormuz Strait blockade caused a major oil shock, but JP Morgan views the subsequent equity market pullback as a buying opportunity. "Fragmentation" is creating pockets of value, notably in resource-rich Latin America, AI-supply-chain-linked East Asia, and deeply discounted Chinese equities, where a policy shift could trigger a re-rating. 5. **Regional Views**: The firm is cautious on Europe due to high energy costs and lower innovation investment, preferring US and select EM exposures. In short, JP Morgan sees market volatility as an entry point but recommends a portfolio pivot: favor AI infrastructure, real assets, and EM, while avoiding excess cash, vulnerable software firms, and traditional 60/40 stock-bond allocations.

marsbit28 мин. назад

JP Morgan Mid-Year Research Report Analysis: The AI Supercycle is Not Over, Reduce Cash Holdings + Allocate to Real Assets

marsbit28 мин. назад

Торговля

Спот
Фьючерсы

Популярные статьи

Как купить S

Добро пожаловать на HTX.com! Мы сделали приобретение Sonic (S) простым и удобным. Следуйте нашему пошаговому руководству и отправляйтесь в свое крипто-путешествие.Шаг 1: Создайте аккаунт на HTXИспользуйте свой адрес электронной почты или номер телефона, чтобы зарегистрироваться и бесплатно создать аккаунт на HTX. Пройдите удобную регистрацию и откройте для себя весь функционал.Создать аккаунтШаг 2: Перейдите в Купить криптовалюту и выберите свой способ оплатыКредитная/Дебетовая Карта: Используйте свою карту Visa или Mastercard для мгновенной покупки Sonic (S).Баланс: Используйте средства с баланса вашего аккаунта HTX для простой торговли.Третьи Лица: Мы добавили популярные способы оплаты, такие как Google Pay и Apple Pay, для повышения удобства.P2P: Торгуйте напрямую с другими пользователями на HTX.Внебиржевая Торговля (OTC): Мы предлагаем индивидуальные услуги и конкурентоспособные обменные курсы для трейдеров.Шаг 3: Хранение Sonic (S)После приобретения вами Sonic (S) храните их в своем аккаунте на HTX. В качестве альтернативы вы можете отправить их куда-либо с помощью перевода в блокчейне или использовать для торговли с другими криптовалютами.Шаг 4: Торговля Sonic (S)С легкостью торгуйте Sonic (S) на спотовом рынке HTX. Просто зайдите в свой аккаунт, выберите торговую пару, совершайте сделки и следите за ними в режиме реального времени. Мы предлагаем удобный интерфейс как для начинающих, так и для опытных трейдеров.

1.4k просмотров всегоОпубликовано 2025.01.15Обновлено 2026.06.02

Как купить S

Sonic: Обновления под руководством Андре Кронье – новая звезда Layer-1 на фоне спада рынка

Он решает проблемы масштабируемости, совместимости между блокчейнами и стимулов для разработчиков с помощью технологических инноваций.

2.3k просмотров всегоОпубликовано 2025.04.09Обновлено 2025.04.09

Sonic: Обновления под руководством Андре Кронье – новая звезда Layer-1 на фоне спада рынка

HTX Learn: Пройдите обучение по "Sonic" и разделите 1000 USDT

HTX Learn — ваш проводник в мир перспективных проектов, и мы запускаем специальное мероприятие "Учитесь и Зарабатывайте", посвящённое этим проектам. Наше новое направление .

1.8k просмотров всегоОпубликовано 2025.04.10Обновлено 2025.04.10

HTX Learn: Пройдите обучение по "Sonic" и разделите 1000 USDT

Обсуждения

Добро пожаловать в Сообщество HTX. Здесь вы сможете быть в курсе последних новостей о развитии платформы и получить доступ к профессиональной аналитической информации о рынке. Мнения пользователей о цене на S (S) представлены ниже.

活动图片