Bitcoin price declined over 15% and even traded below $16,000. BTC remains at a risk of more losses if it breaks the $15,000 support zone.
”“
- Bitcoin remained in a bearish zone after the FTX collapse and declined below $16,000.
- The price is trading below $17,500 and the 100 hourly simple moving average.
- There is a major bearish trend line forming with resistance near $16,500 on the hourly chart of the BTC/USD pair (data feed from Kraken).
- The pair could continue to move down if it stays below the $16,500 and $17,000 levels.
”“
Bitcoin Price Tumbles
“”
Bitcoin price remained in a bearish zone after it settled below the $20,000 support zone. Binance opted out to bail FTX, resulting in an increase in selling pressure. BTC declined below the $18,500 and $17,000 levels.
“”
The crypto market is bleeding and many altcoins such as ethereum, bnb, ripple are down over 15%. Bitcoin price also gained bearish momentum and traded below the $16,000 support level. The price traded as low as $15,555 and is currently consolidating losses.
“”
It is trading below $17,500 and the 100 hourly simple moving average. There is also a major bearish trend line forming with resistance near $16,500 on the hourly chart of the BTC/USD pair.
“”
On the upside, an immediate resistance is near the $16,400 level. The first major resistance is near the $16,650 level. It is near the 23.6% Fib retracement level of the recent decline from the $20,671 swing high to $15,555 low.
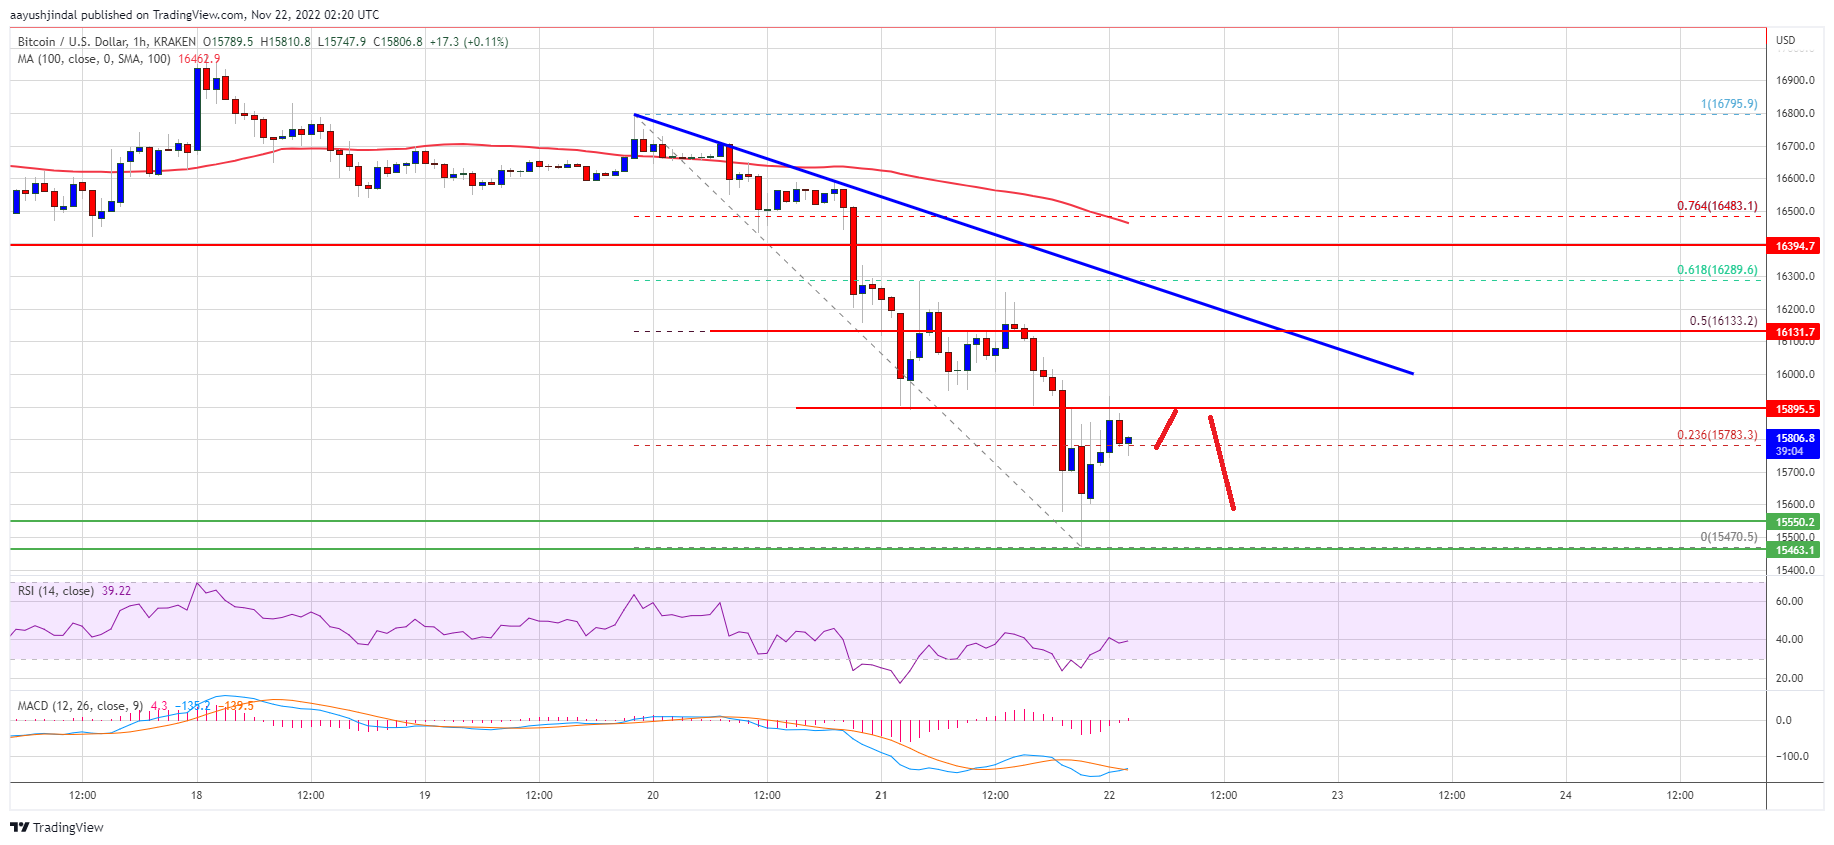
Source: BTCUSD on TradingView.com
“”
A clear move above the trend line resistance and $16,675 might start a decent recovery wave. The next major resistance is near $18,000 or the 50% Fib retracement level of the recent decline from the $20,671 swing high to $15,555 low, above which the price could test the $20,000 zone.
“”
More Losses in BTC?
“”
If bitcoin fails to start a recovery wave above the $16,500 resistance zone, it could continue to move down. An immediate support on the downside is near the $15,800 level.
“”
The next major support is near the $15,500 zone. A clear move below the $15,500 support might push the price further lower. In this case, the price may perhaps decline below the $15,000 support zone.
“”
Technical indicators:
“”
Hourly MACD – The MACD is now gaining pace in the bearish zone.
Hourly RSI (Relative Strength Index) – The RSI for BTC/USD is now below the 30 level.
Major Support Levels – $15,800, followed by $15,500.
Major Resistance Levels – $16,500, $16,675 and $18,000.