Post-ATH Indecisiveness

insights.glassnodeОпубликовано 2025-08-05Обновлено 2025-08-06

Executive Summary

  • After peaking above $123k in mid‑July, BTC has since entered a phase of indecision, with the price trading below the supply cluster with a base at $116k.
  • On July 31, price broke below the lower boundary of this cluster, slipping into a relatively low‑liquidity “air gap”, which persists down to $110k. Opportunistic buying has emerged, but the market is yet to reclaim key resistance levels.
  • Short‑term holder profitability has dropped, although around 70% of their supply is still held in profit. Without a quick rebound in demand, confidence amongst these new investors may start to weaken, prompting further sell pressure.
  • The ETFs experienced an outflow of ‑1.5k BTC, which was the largest since April 2025.
  • Funding rates across major perpetual swap markets have slid lower, signalling a reduction in excess leverage and a reluctance to pay high premiums for opening new leveraged long positions.
💡
View all charts in this edition in The Week On-chain Dashboard.

Drifting Into An Air Gap

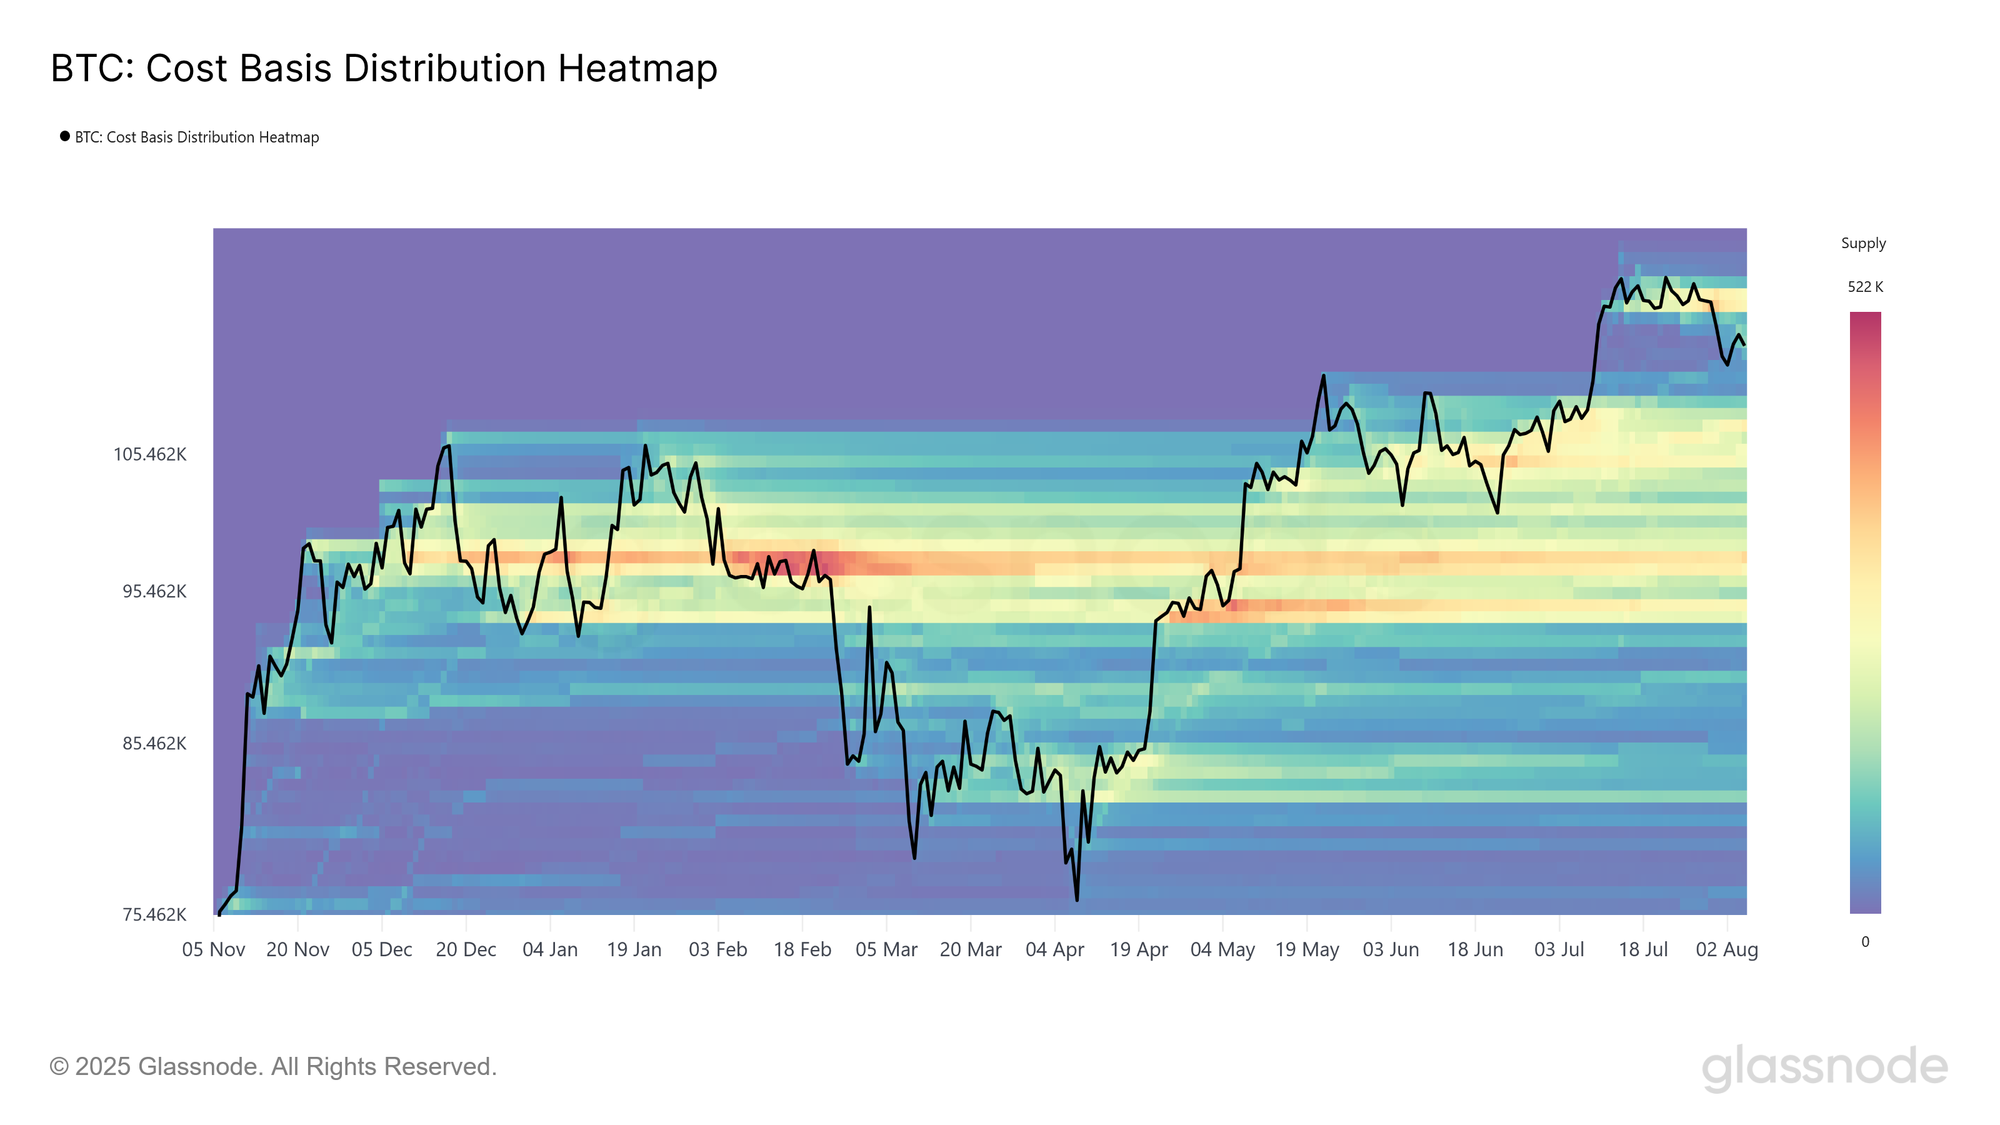
After reaching a new all-time high of $123k in mid-July, the market has since pulled back to $113k, putting many new investors underwater on their recent buys. This has formed a large supply cluster with a cost basis above $116k.

The lower bound of this cluster was tested multiple times prior to the market breaking lower, with each retest prompting a price rebound and finding support. However, on 31 July, the price broke decisively below this support level, entering the “air gap” highlighted in WoC 30.

Historically, such low-liquidity price ranges often evolve into new accumulation zones, as opportunistic buyers step in to acquire BTC at a perceived discount to the latest ATH.

Live Chart

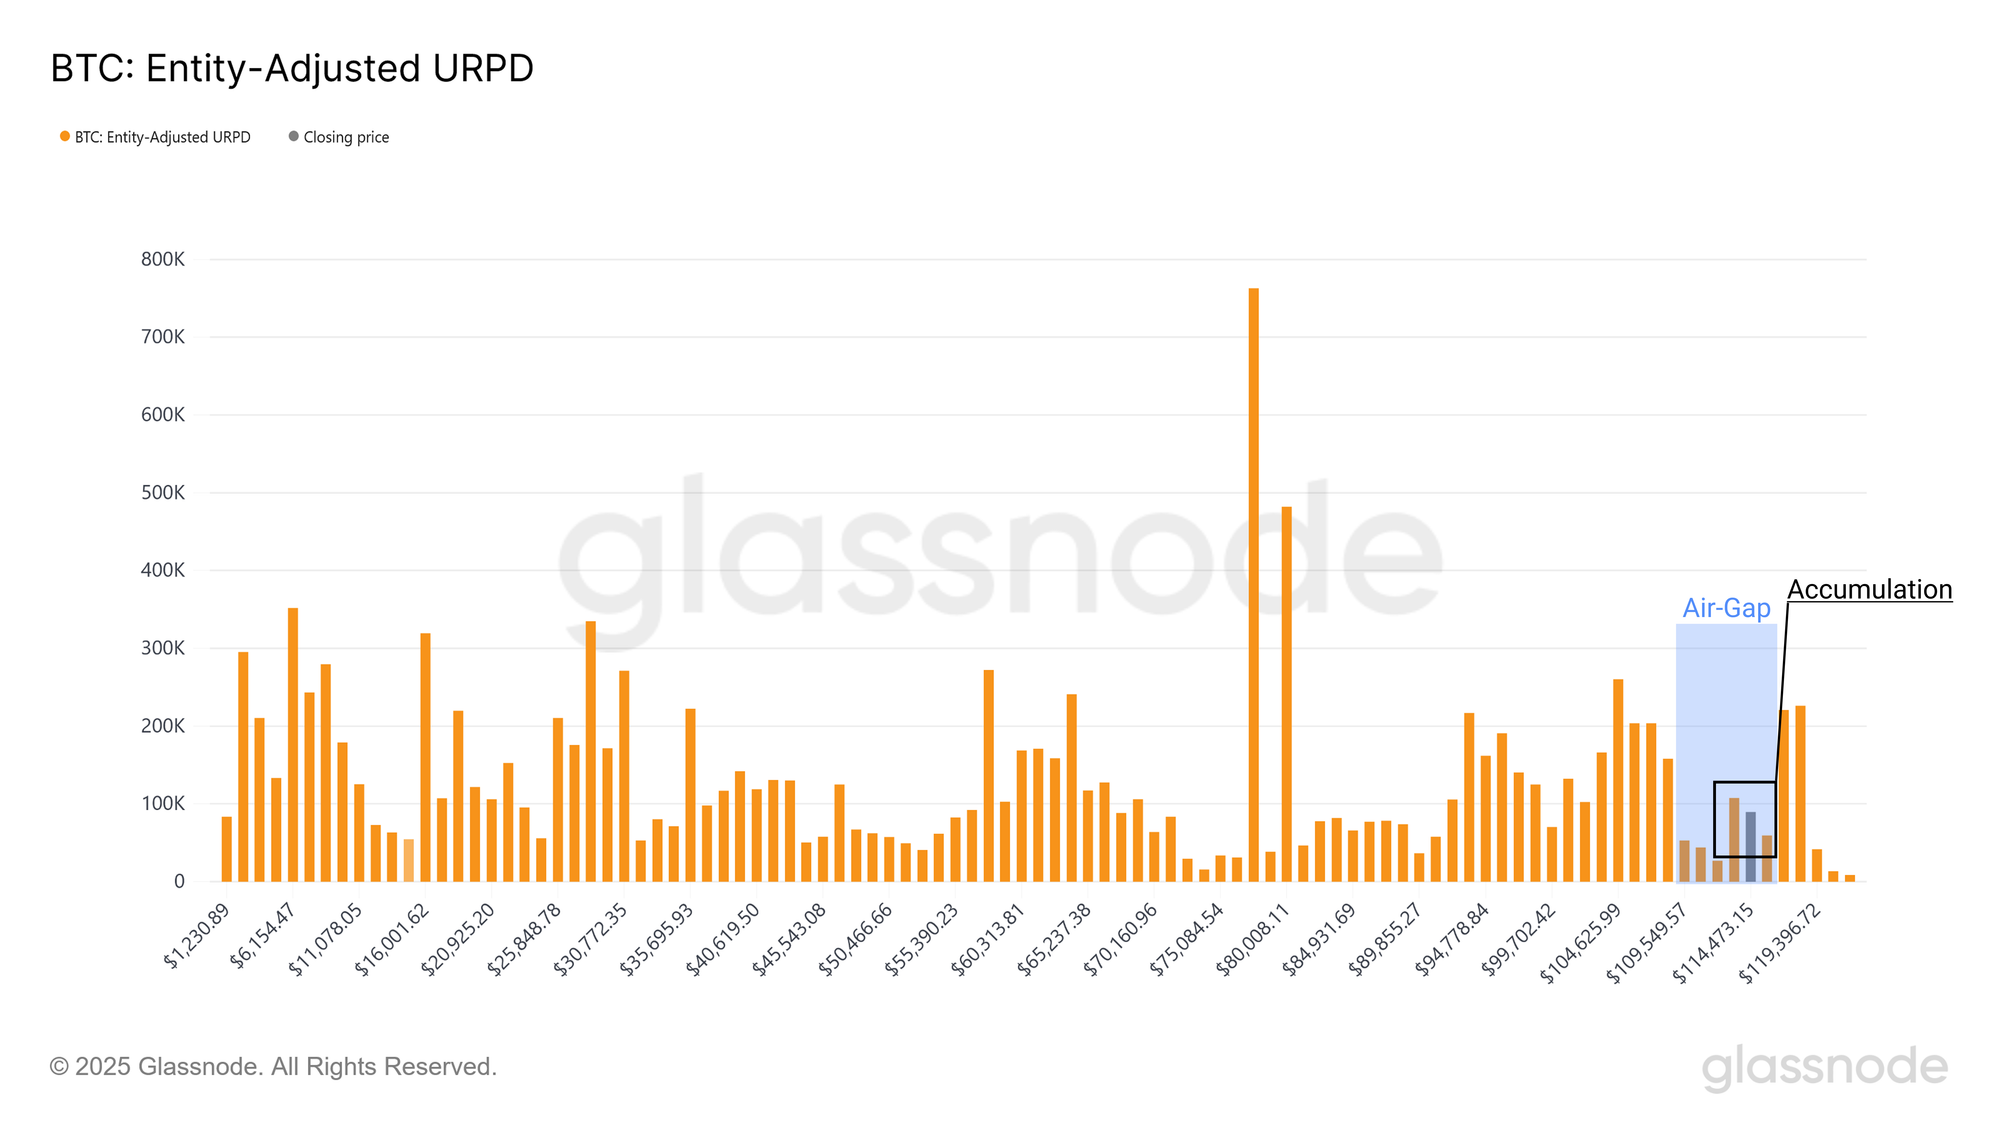
To evaluate how aggressively opportunistic buyers stepped in after the price slipped lower, we can compare the Entity-Adjusted URPD as of 31 July to that of 4 August.

The UTXO Realized Price Distribution (URPD) maps out where the set of Bitcoin UTXOs were created as of that date, with each bar showing the volume of supply which last moved within each specific price bucket.

This comparison shows that after rebounding from a low of ~$112k, roughly ~120k BTC was acquired by investors, suggesting buy-the-dip behaviour by investors, and pushing the price back above $114k.

However, this air gap between $110k and $116k remains relatively light in terms of aggregate supply, and a period of accumulation within this zone could, over time, establish a sufficiently strong base to support the next move higher.

Live Chart

A Decisive New Resistance

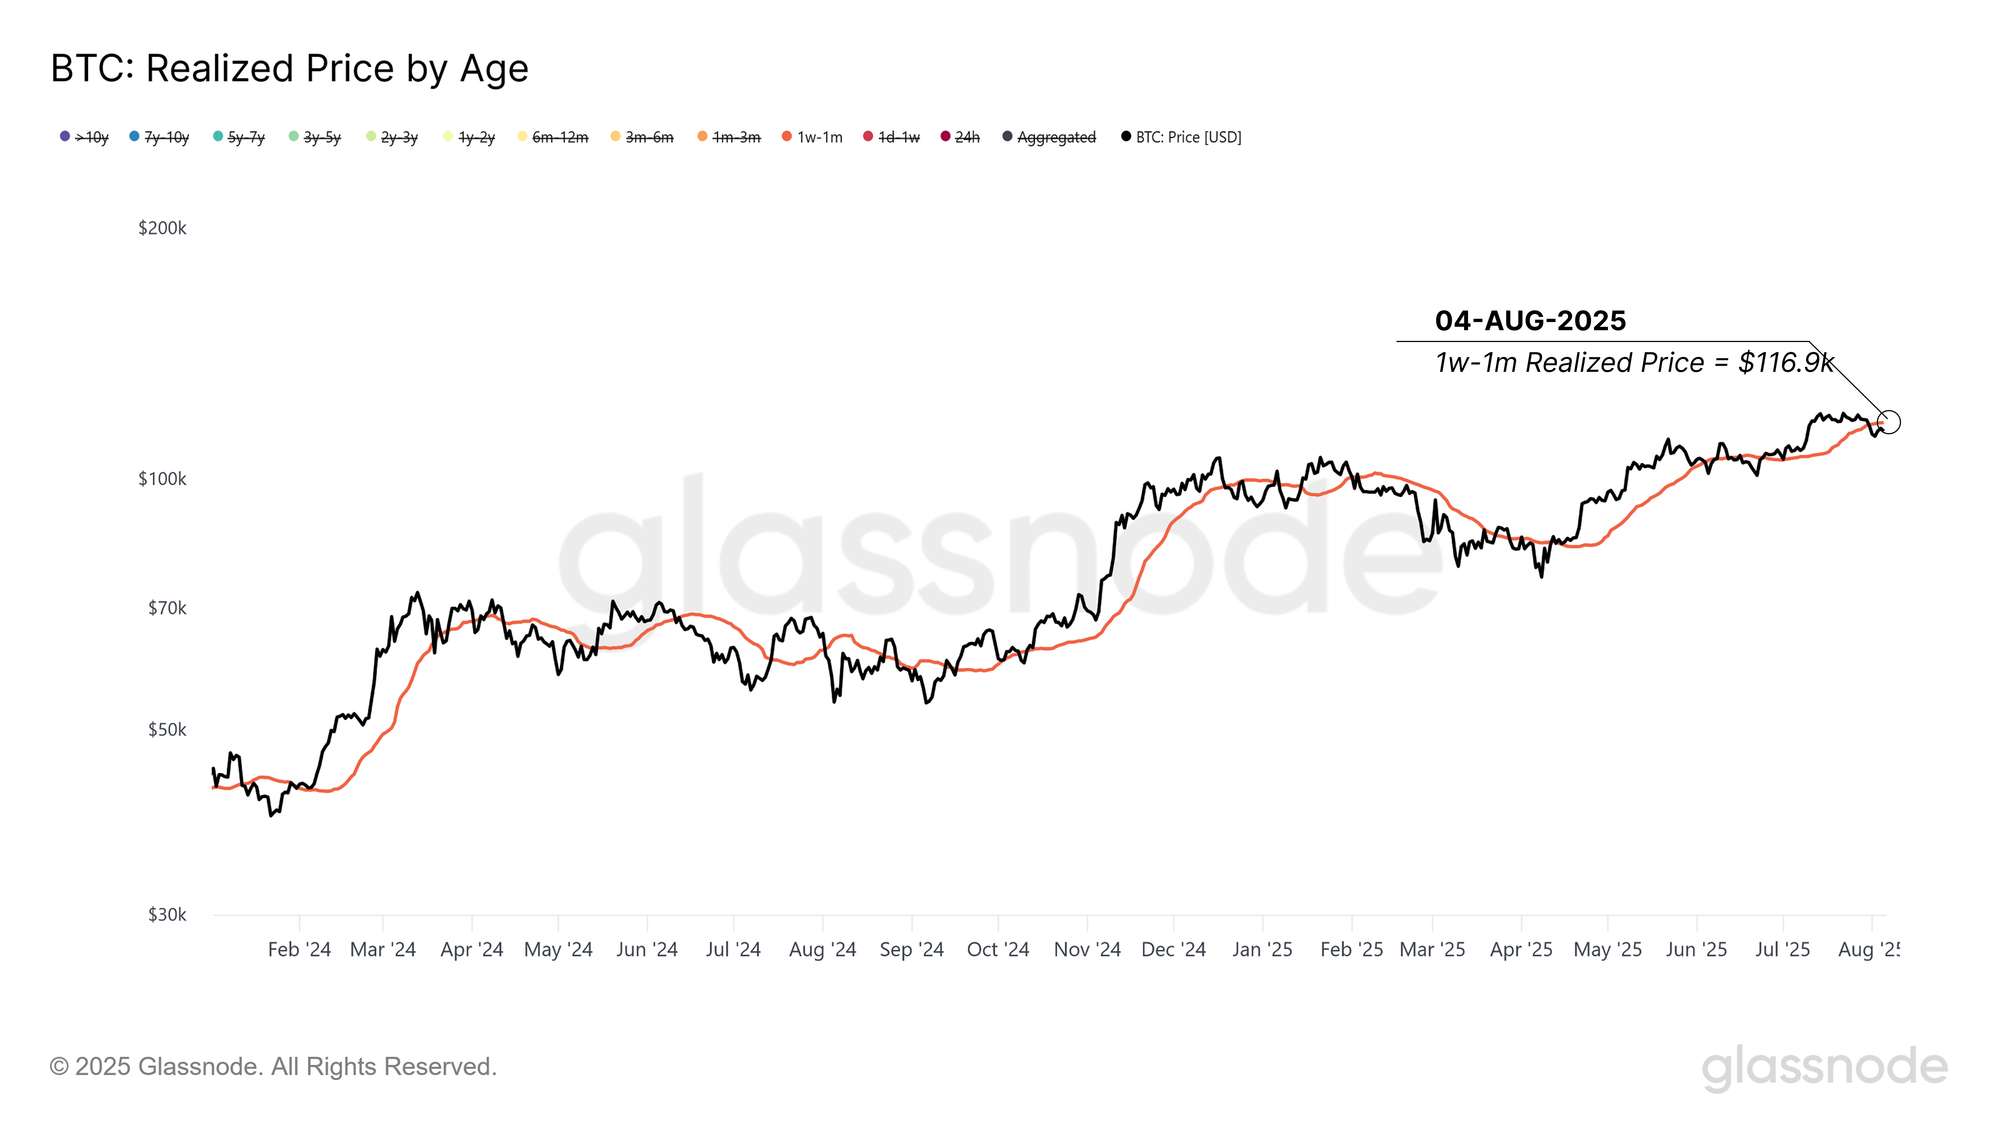
Despite the accumulation which has occurred over the last week, the market rebound has thus far lacked sufficient strength to reclaim the cost basis of local top buyers who entered over the past month. For this 1w–1m holder cohort, their cost basis now acts as a resistance level, and is located around 116.9k.

A sustained price move above this threshold would signal that the demand side is regaining control and offer early confirmation that the market has found its footing. Conversely, if the price remains below this level for a longer period, it increases the risk of a deeper correction, likely toward the lower bound of the air gap near $110k.

Live Chart

Bull/Bear Frontline

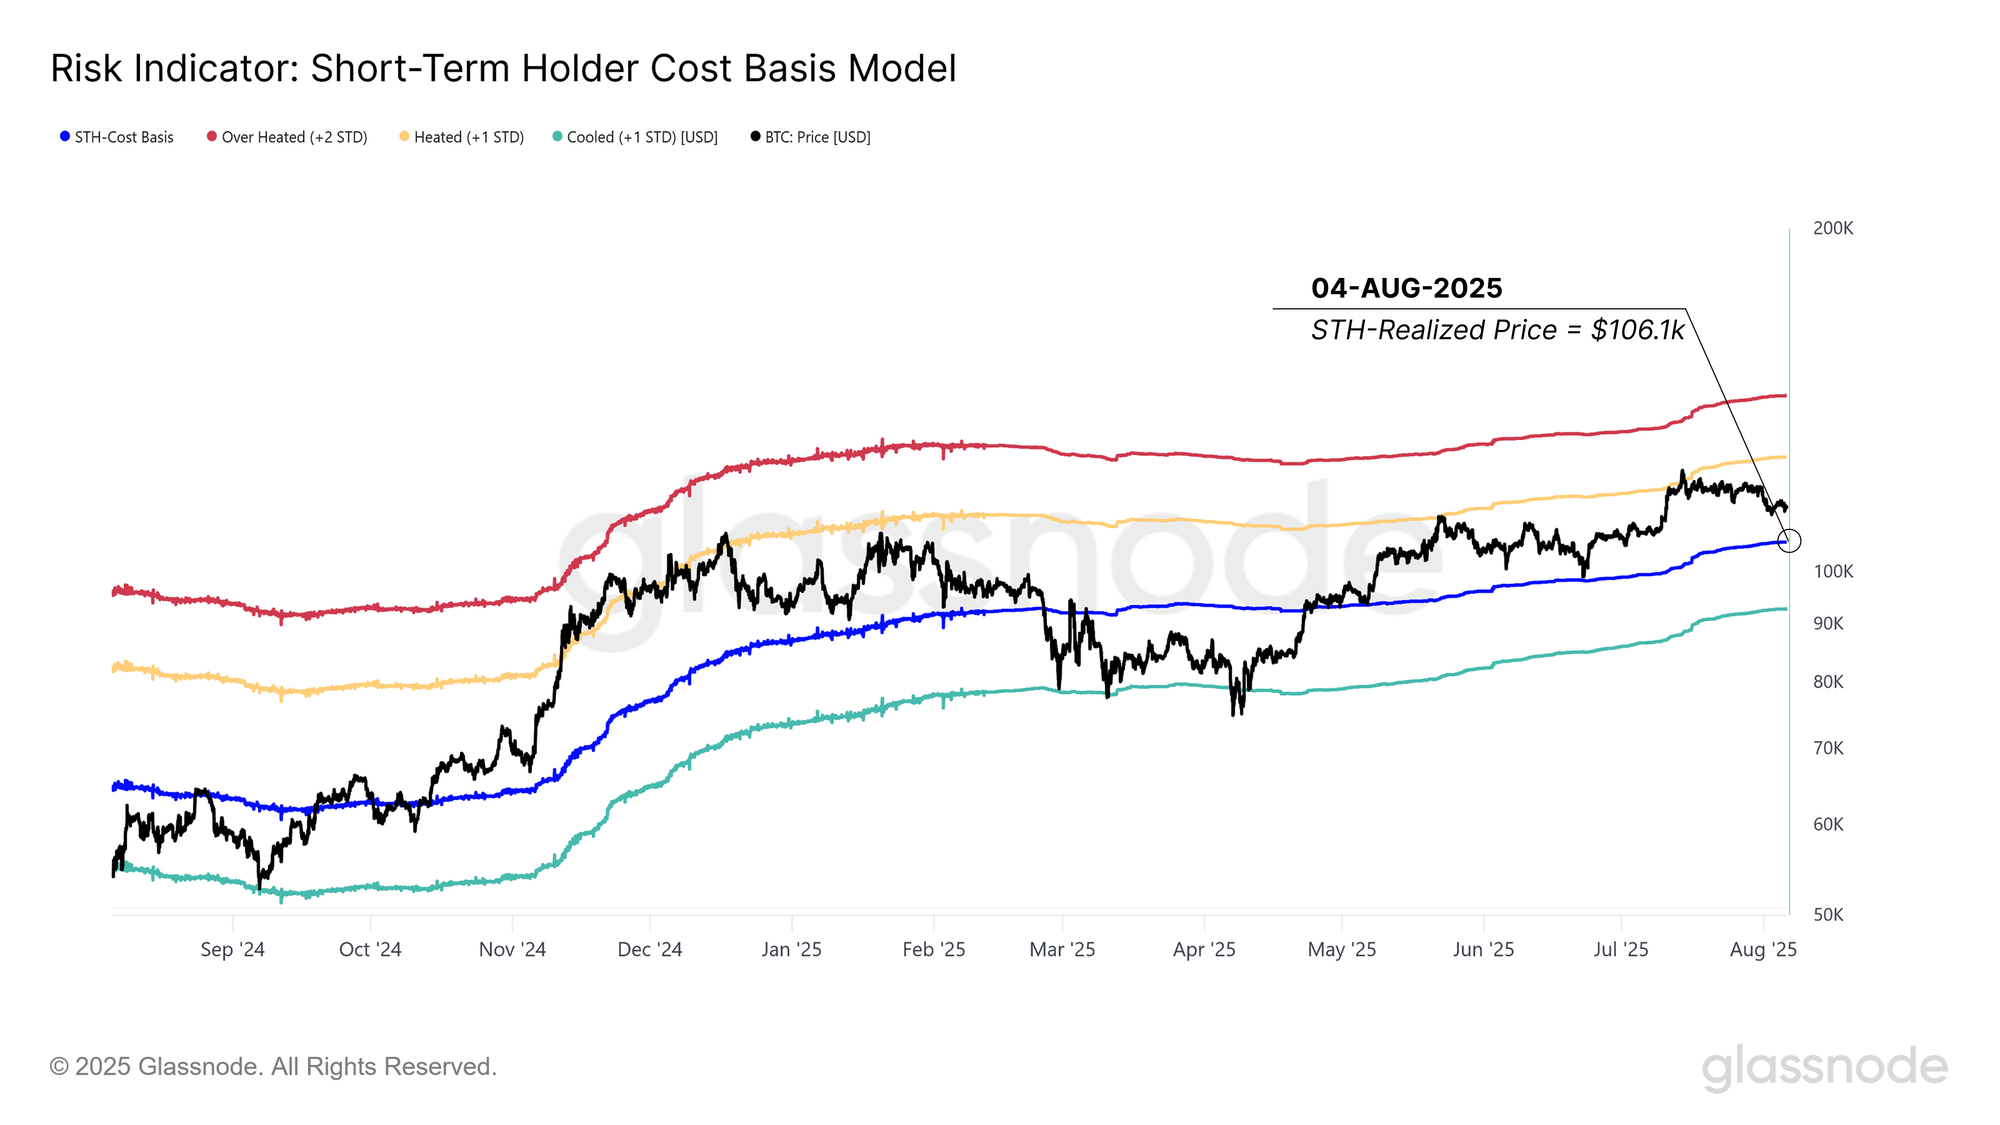
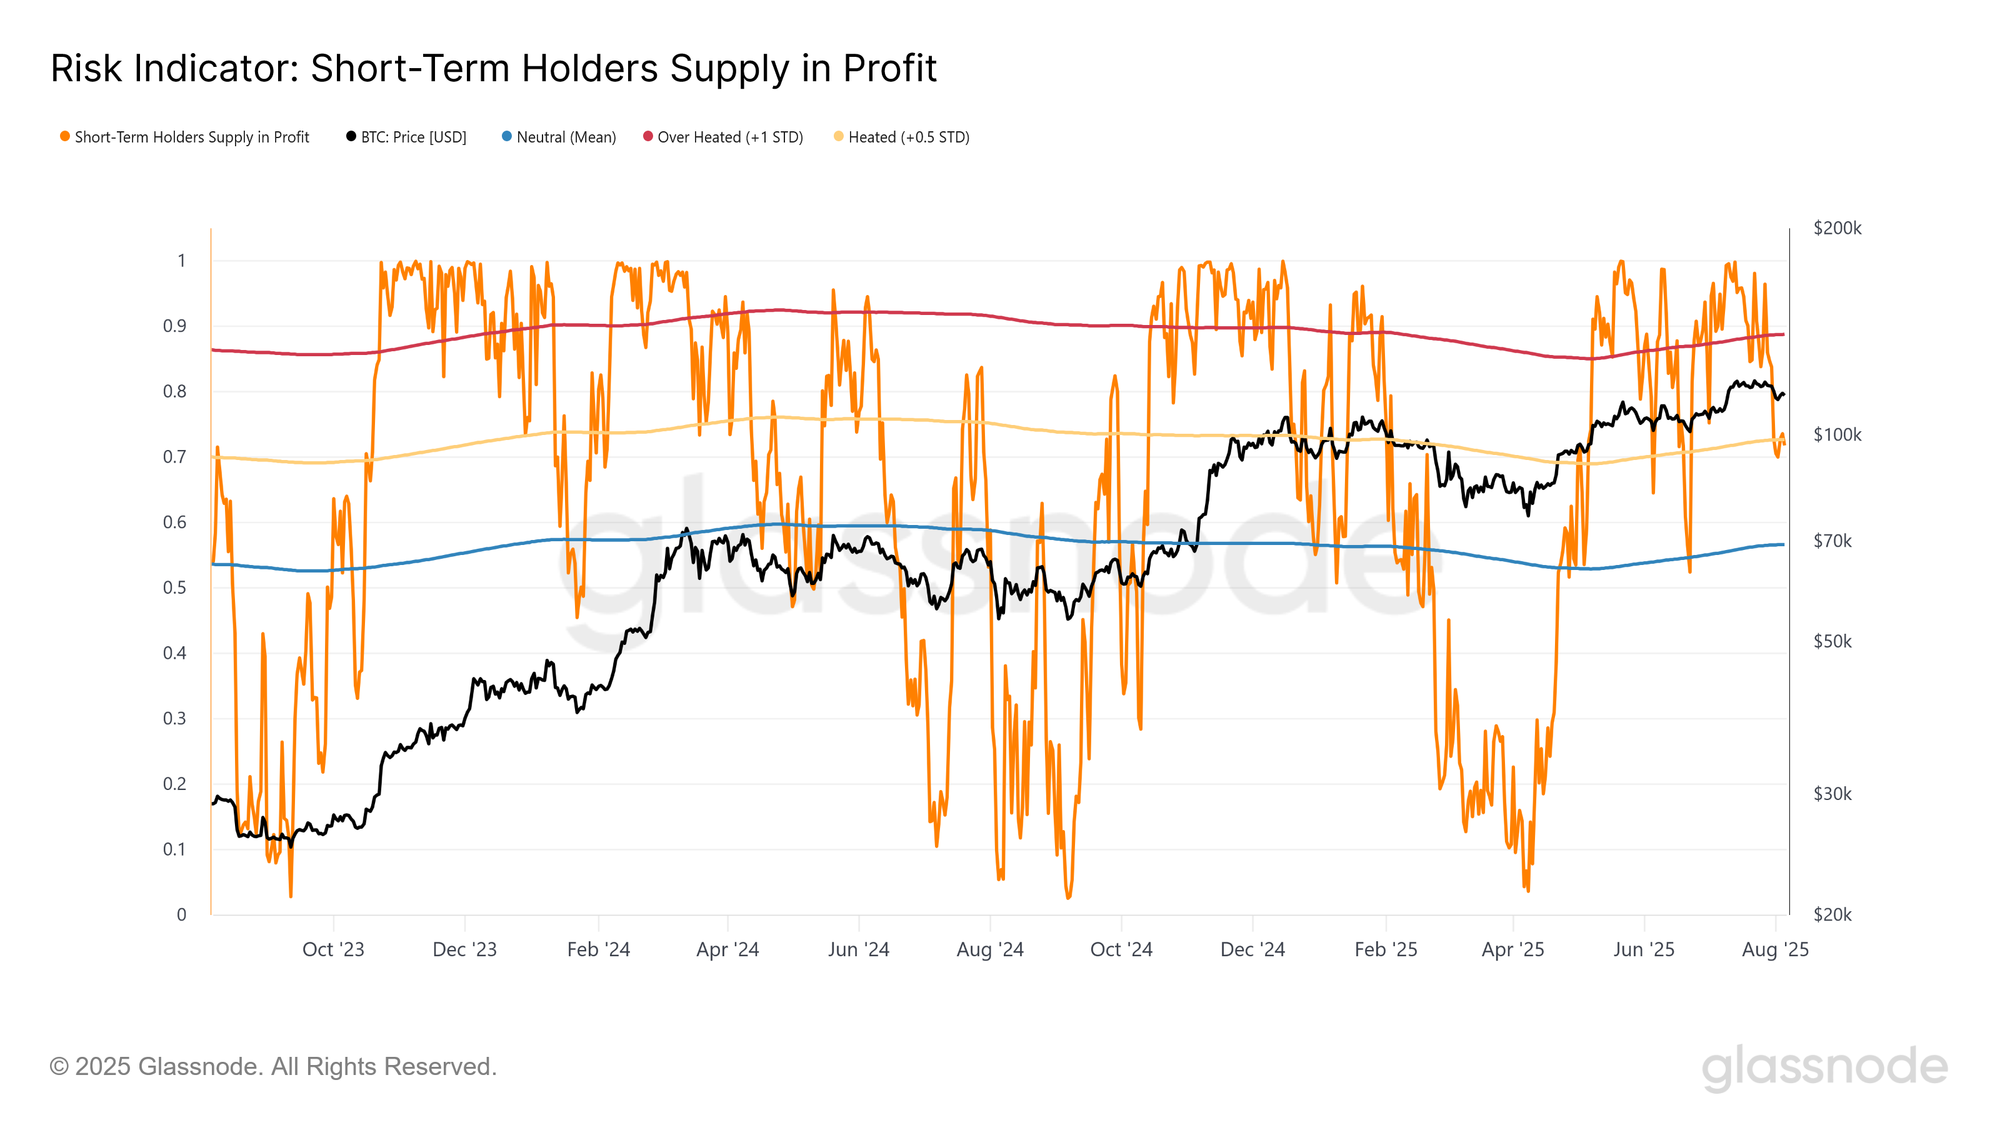
Zooming out, we can construct a set of statistical bands derived from the short-term holder cost basis, which can provide a compass for navigating the current market structure.

The Bitcoin price is currently trading within the warm, but not overheated zone, and is still above the short-term holder cost basis located at $106k. This setup is quite normal for a Bitcoin bull market, and the STH cost basis historically serves as an important threshold separating near-term bullish and bearish trends.

Live Chart

Profitability Around The Mid-line

Given the market is currently within a typical post-ATH corrective phase, we can utilize indicators of on-chain investor behaviour to gauge where short-term biases may be leaning. First, we examine how the profitability of new investors has changed, as this reflects a primary driver of their confidence in the trend and a key determinant of their next decision.

For short-term holders, the percent of their supply held in profit has declined from 100% to 70% during this price pull-back. This is a level which aligns with the midline of prior bull phases, and is again not an atypical condition.

The deeper the correction, the more supply is likely to fall into loss, which can slowly erode investor confidence. However, given the market is trading within a relatively thin air-gap, the most likely source of this additional supply would be from late-stage profit-taking, should it occur.

Live Chart

A Need for New Demand

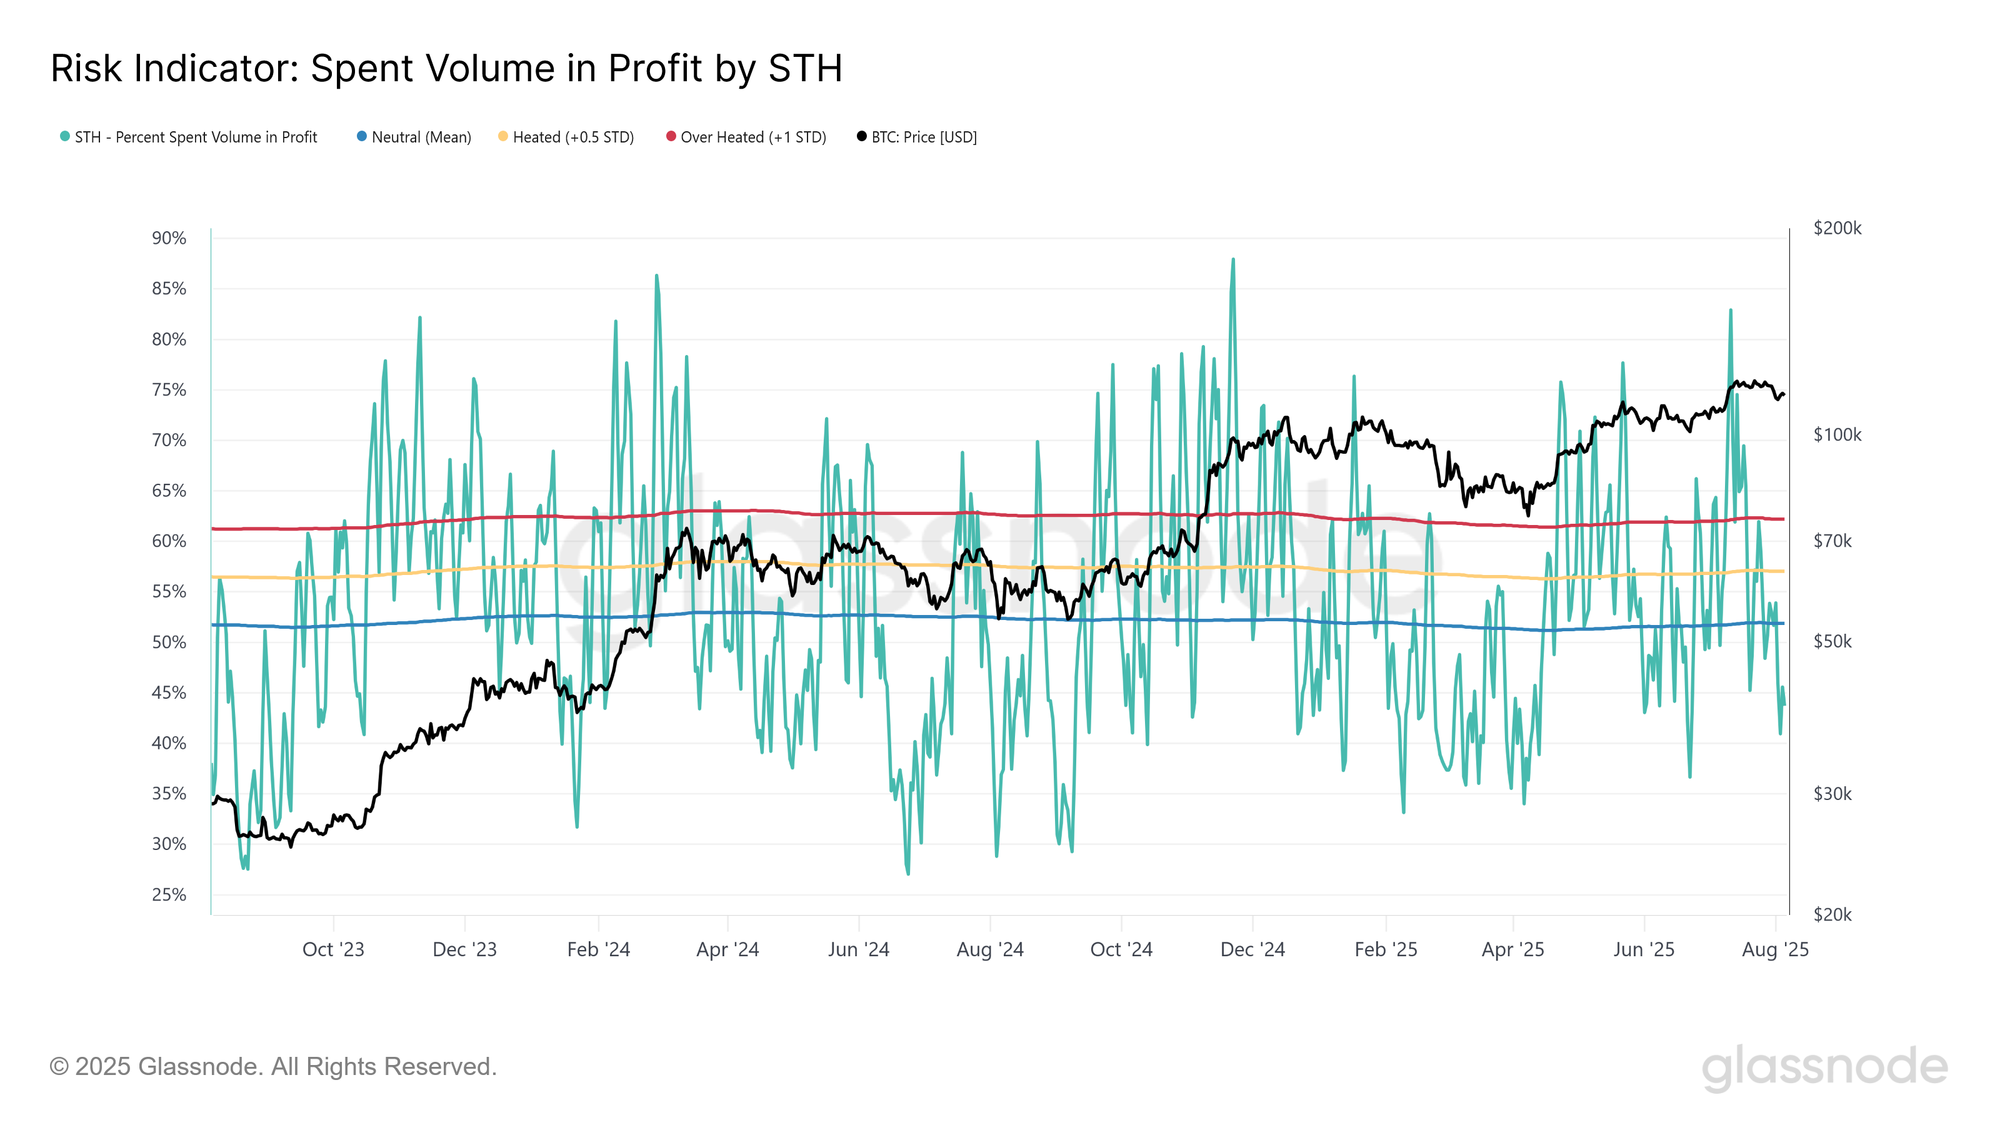
To assess how this pullback has influenced investor behaviour, we turn to the percent of spent volume originating from short-term holders who were in profit. This metric directly measures the number of recently acquired coins that are taking profit.

The proportion of STH spent coins which are taking profit has cooled off, and trading at 45%, which is below the neutral threshold.

Overall, this suggests the market is in a relatively balanced position, with 70% of STH supply still held in profit, and an almost even split of profit and loss taking in coins which are on the move.

Live Chart

ETF Outflows Create Sell-side Pressure

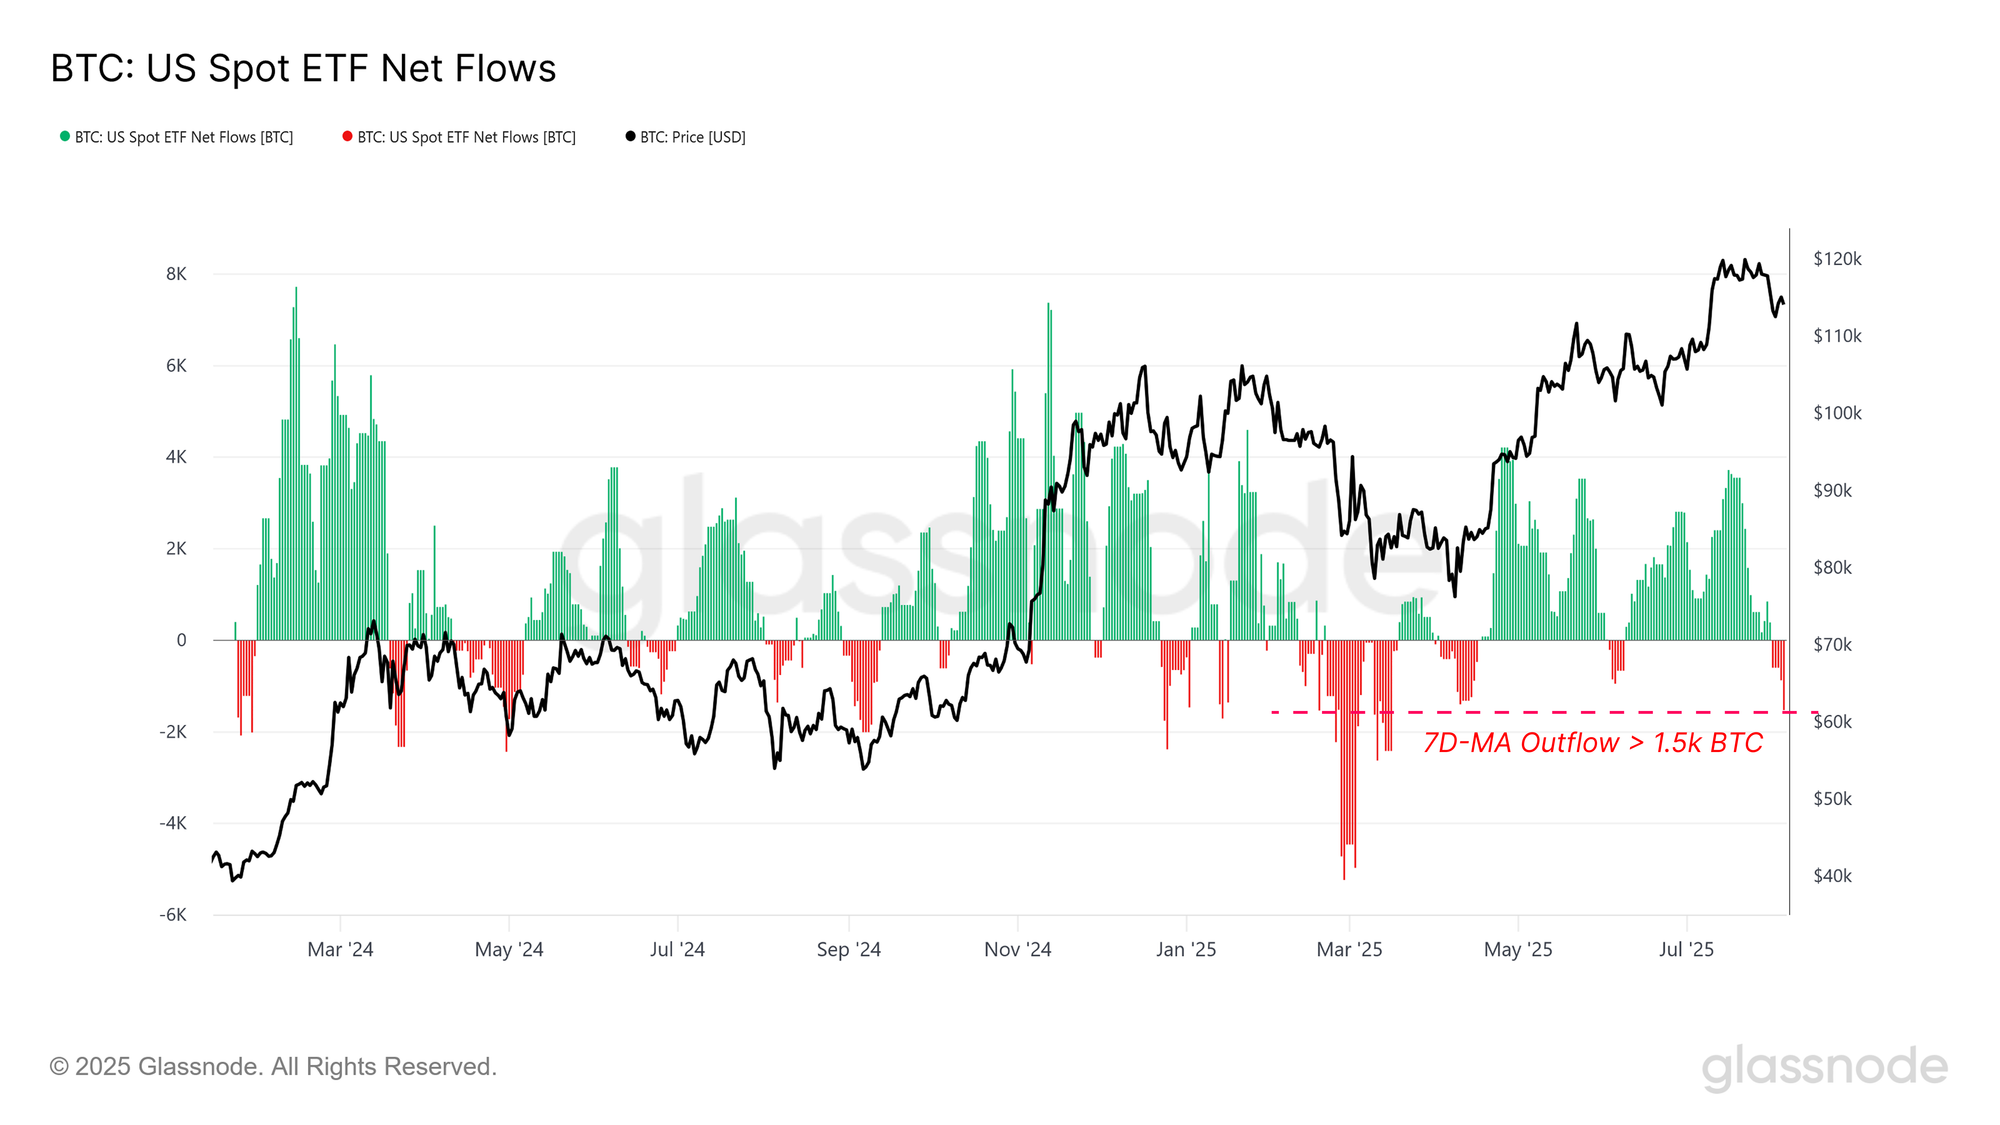
To bolster our on-chain dominant analysis thus far, we can view these metrics alongside demand from traditional vehicles via the ETFs. On August 5, the ETFs experienced a fairly sizeable outflow of -1.5k BTC, marking the largest wave of sell-side pressure from these vehicles since April 2025.

To date, outflows from the ETFs have been relatively brief events, with few instances of sustained sell-side pressure. Keeping an eye on these flows will help to identify whether this outflow is just another example of this dynamic or perhaps a more structural shift in sentiment.

Live Chart

Funding Rates Pull Back

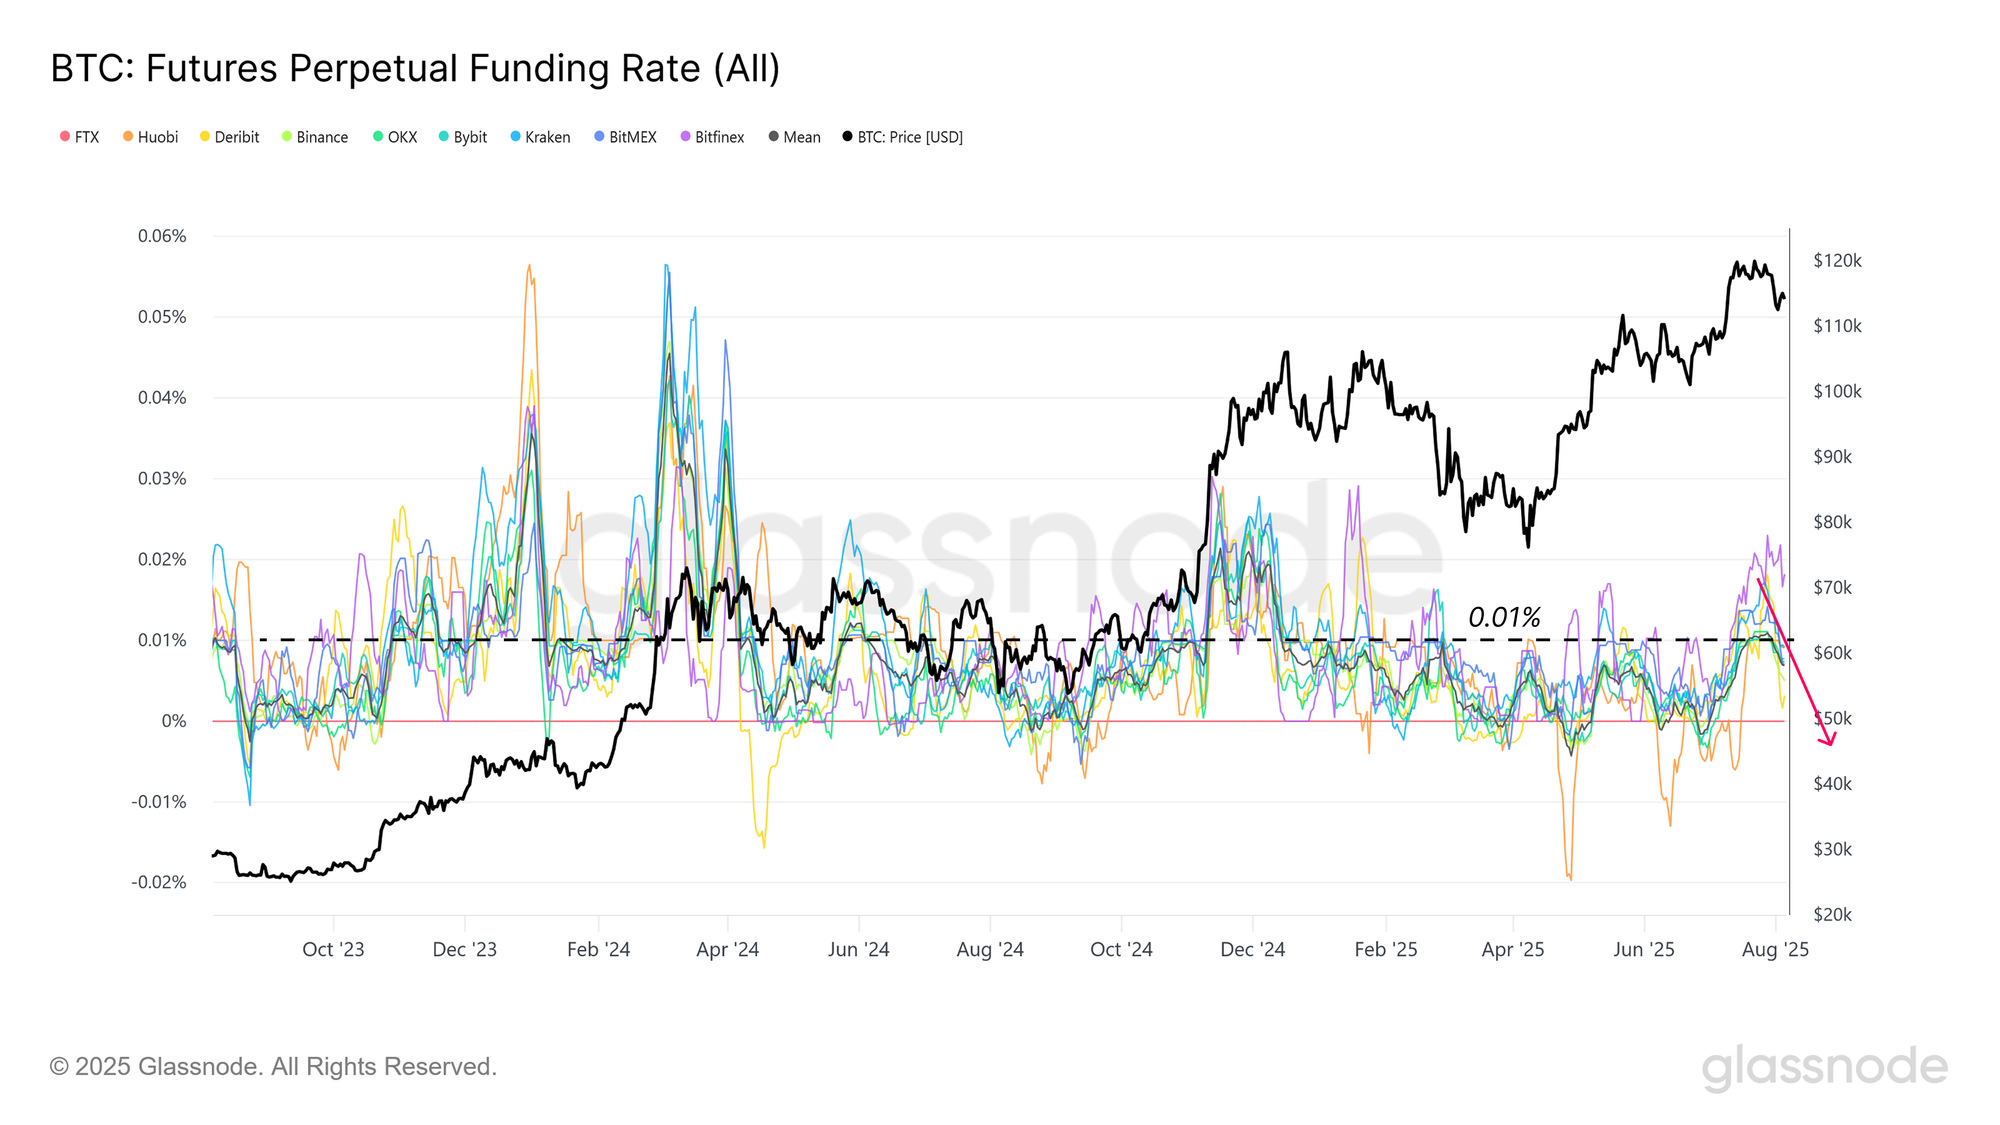
Looking beyond the spot market, sentiment in perpetual futures is also moving away from a brief dance with euphoric levels. Both the aggregated and individual component funding rates across all perpetual swap markets for Bitcoin have come off the recent highs and are now trading back below the 0.1% range.

This territory is often considered to be fairly neutral, reflecting a lack of appetite amongst the bulls to pay a large premium for leveraged long positions. Such a shift suggests a marked cooling down of speculative interest and reduced upside conviction in the near term.

Live Chart

Conclusion

The Bitcoin market is navigating a post‑ATH correction. The Bitcoin price has slipped below the $116k accumulation range low and entered a low‑liquidity “air gap”, first highlighted in earlier reports. Opportunistic buying has emerged, but demand has not yet been strong enough to reclaim the cost basis of recent buyers, leaving this level as a critical pivot for near‑term direction.

Investor behaviour signals a relatively balanced environment, with several Short-Term Holder-based metrics trading at levels which are quite consistent with a typical bull market trend. The ETFs have experienced a large outflow; however, to date, these have been brief events, and there isn’t sufficient evidence to suggest a more structural trend of outflows is in play.

The market is effectively re-finding its footing, bounded by the previous cycle ATH of $110k below, and the base of the most recent accumulation range near $116k.


Disclaimer: This report does not provide any investment advice. All data is provided for informational, and educational purposes only. No investment decision shall be based on the information provided here and you are solely responsible for your own investment decisions.

Exchange balances presented are derived from Glassnode’s comprehensive database of address labels, which are amassed through both officially published exchange information and proprietary clustering algorithms. While we strive to ensure the utmost accuracy in representing exchange balances, it is important to note that these figures might not always encapsulate the entirety of an exchange’s reserves, particularly when exchanges refrain from disclosing their official addresses. We urge users to exercise caution and discretion when utilizing these metrics. Glassnode shall not be held responsible for any discrepancies or potential inaccuracies. 

Please read our Transparency Notice when using exchange data.


Трендовые криптовалюты

Похожее

Сможет ли Pendle удержать 12%-ный рост и пробиться выше $1,45? Если нет, то что дальше?

Pendle (PENDLE) показал признаки продолжения роста, увеличившись на 12% за сутки. Этот скачок был подкреплен объемом торгов, который вырос более чем на 50%, что свидетельствует о повышенном интересе рынка. Основной задачей остается преодоление ключевого уровня сопротивления около $1.475. Успешный пробой может открыть путь к области $1.53, в противном случае токен может остаться в текущем ценовом диапазоне. Технические индикаторы поддерживают позитивный сценарий. Индекс денежного потока (MFI) остается в бычьей зоне, приближаясь к уровню перекупленности, что отражает сильный спрос. Parabolic SAR также подтверждает восходящий тренд. На фундаментальном уровне протокол усилил свою полезность благодаря партнерству с Curvance, позволяя держателям PT-AUSD занимать средства под свои активы без их продажи. Сообщество настроено оптимистично: 96% участников опроса ожидают продолжения роста. Таким образом, несмотря на улучшение технических показателей и фундаментальные новости, для подтверждения полноценного пробоя покупателям необходимо закрепиться выше ближайшего сопротивления.

ambcrypto20 мин. назад

Сможет ли Pendle удержать 12%-ный рост и пробиться выше $1,45? Если нет, то что дальше?

ambcrypto20 мин. назад

В спорах вокруг стейблкоинов Visa и Mastercard дизайн XRP Ledger снова в центре внимания

Новый стейблкоин-проект Open USD (OUSD), поддерживаемый консорциумом из более чем 140 компаний, включая Visa, Mastercard и Ripple, вновь привлек внимание к архитектуре XRP Ledger (XRPL). Бывший ведущий инженер Ripple Мэтт Хэмилтон отметил, что дизайн OUSD, в частности его механизм многостороннего распределения резервов, напоминает концепции, заложенные в XRP Ledger еще в 2012 году. Важно подчеркнуть, что OUSD изначально запускается на Solana и Tempo, а не на XRPL, и это не продукт Ripple. Сравнение носит исключительно технический характер. Оно показывает, что принципы быстрого расчета и выпуска активов, изначально заложенные в XRP Ledger, сейчас находят отклик у крупных игроков традиционных финансов, исследующих модели стейблкоинов на основе консорциума. Для сообщества XRP это служит подтверждением дальновидности первоначального дизайна реестра. Открытым остается вопрос, приведет ли это к прямому использованию XRPL крупными финансовыми институтами или же они просто позаимствуют архитектурные идеи, не увеличивая активность в самой сети.

bitcoinist2 ч. назад

В спорах вокруг стейблкоинов Visa и Mastercard дизайн XRP Ledger снова в центре внимания

bitcoinist2 ч. назад

CoinFlip получает лицензию MiCA в Италии по окончании переходного периода ЕС по крипторегулированию

Криптоплатформа CoinFlip получила лицензию MiCA от итальянского регулятора ценных бумаг CONSOB. Это разрешение позволяет американской компании расширять свои услуги на территории Европейского союза, используя механизм паспортизации. Лицензия была одобрена сразу после окончания 1 июля переходного периода по правилам MiCA в ЕС. С этой даты все поставщики услуг с криптоактами (CASP), работающие в блоке, обязаны иметь авторизацию MiCA или прекратить предоставление регулируемых услуг. CoinFlip, которая назвала себя первым международным CASP в Италии, работает по новой нормативной базе и разместит европейскую штаб-квартиру в Милане. Генеральный директор компании Бен Вайсс отметил, что лицензия создает унифицированную регуляторную основу для масштабирования услуг в Европе. Окончание переходного периода знаменует сдвиг от разрозненных национальных режимов лицензирования к единой нормативной базе ЕС. Европейское управление по ценным бумагам и рынкам (ESMA) поручило национальным регуляторам обеспечить упорядоченное свертывание деятельности неавторизованных провайдеров и рекомендовало инвесторам проверять наличие у их криптопровайдеров разрешения MiCA.

ambcrypto2 ч. назад

CoinFlip получает лицензию MiCA в Италии по окончании переходного периода ЕС по крипторегулированию

ambcrypto2 ч. назад

Редкий месячный сигнал на покупку для Ethereum — но бычий сценарий не так однозначен

Курс Ethereum (ETH) демонстрирует краткосрочный рост (8,05% за неделю), однако на долгосрочном графике сохраняется нисходящий тренд. Несмотря на недавний рост, с 17 июня 2026 года отток средств из спотовых ETF Ethereum составил -$358,3 млн, что подчеркивает преобладание медвежьего настроения на рынке. ETH потерял ключевые уровни поддержки $3,2 тыс. и $2,0 тыс. и торгуется около $1,5 тыс. Технические индикаторы показывают смешанные сигналы. Соотношение покупателей и продавцов (Taker Buy-Sell Ratio) вернулось выше 1, указывая на агрессивные ордера на покупку. Открытый интерес (Open Interest) немного вырос, что создает предпосылки для возможного сжатия шорт-позиций. Однако если рост открытого интереса замедлится, это будет означать, что текущий отскок вызван закрытием коротких позиций, а не устойчивым спросом. Индикатор TD Sequential на месячном таймфрейме в начале июля дал редкий сигнал на покупку. В прошлом подобные сигналы (сентябрь 2022, март 2025) предшествовали росту ETH на 235% и 182% соответственно. В то же время, уровень -1.0σ от среднего значения MVRV (около $1549) в настоящее время выступает как динамическая поддержка. Таким образом, на рынке Ethereum наблюдается дилемма: с одной стороны, появился редкий месячный сигнал к покупке, а с другой — сохраняются значительные оттоки из ETF и общий слабый интерес инвесторов, что не свидетельствует о формировании сильного рыночного дна.

ambcrypto2 ч. назад

Редкий месячный сигнал на покупку для Ethereum — но бычий сценарий не так однозначен

ambcrypto2 ч. назад

Активность TRON достигла рекордного уровня, доминирует урегулирование стейблкоинов

ТРОН (TRON) в июне 2026 года достиг рекордного уровня активности сети и количества пользователей, подтвердив свою роль одной из ключевых блокчейн-сетей для расчетов стейблкоинами. В первом квартале того же года объем переводов стейблкоинов в сети составил $1,96 трлн. Основная активность связана с передачей стейблкоинов, в первую очередь USDT, что делает ТРОН популярным и экономичным выбором для быстрых расчетов в долларах, особенно за пределами США. Хотя эта специализация отличается от разнообразных экосистем DeFi или NFT на других блокчейнах, она демонстрирует реальную полезность сети как надежной платежной инфраструктуры. Следует учитывать, что высокая активность в основном отражает трансферы, а не широкое использование сложных децентрализованных приложений. Таким образом, сила ТРОН заключается в его эффективности как доминирующего расчетного слоя для стейблкоинов.

bitcoinist3 ч. назад

Активность TRON достигла рекордного уровня, доминирует урегулирование стейблкоинов

bitcoinist3 ч. назад

Торговля

Спот

Популярные статьи

Как купить ATH

Добро пожаловать на HTX.com! Мы сделали приобретение Aethir (ATH) простым и удобным. Следуйте нашему пошаговому руководству и отправляйтесь в свое крипто-путешествие.Шаг 1: Создайте аккаунт на HTXИспользуйте свой адрес электронной почты или номер телефона, чтобы зарегистрироваться и бесплатно создать аккаунт на HTX. Пройдите удобную регистрацию и откройте для себя весь функционал.Создать аккаунтШаг 2: Перейдите в Купить криптовалюту и выберите свой способ оплатыКредитная/Дебетовая Карта: Используйте свою карту Visa или Mastercard для мгновенной покупки Aethir (ATH).Баланс: Используйте средства с баланса вашего аккаунта HTX для простой торговли.Третьи Лица: Мы добавили популярные способы оплаты, такие как Google Pay и Apple Pay, для повышения удобства.P2P: Торгуйте напрямую с другими пользователями на HTX.Внебиржевая Торговля (OTC): Мы предлагаем индивидуальные услуги и конкурентоспособные обменные курсы для трейдеров.Шаг 3: Хранение Aethir (ATH)После приобретения вами Aethir (ATH) храните их в своем аккаунте на HTX. В качестве альтернативы вы можете отправить их куда-либо с помощью перевода в блокчейне или использовать для торговли с другими криптовалютами.Шаг 4: Торговля Aethir (ATH)С легкостью торгуйте Aethir (ATH) на спотовом рынке HTX. Просто зайдите в свой аккаунт, выберите торговую пару, совершайте сделки и следите за ними в режиме реального времени. Мы предлагаем удобный интерфейс как для начинающих, так и для опытных трейдеров.

655 просмотров всегоОпубликовано 2024.06.11Обновлено 2026.06.02

Как купить ATH

Aethir: Распределенная облачная инфраструктура GPU для игр и ИИ

Aethir — это децентрализованная платформа облачных вычислений, которая революционизирует владение, совместное использование и использование Графических процессоров (GPU).

2.5k просмотров всегоОпубликовано 2024.06.24Обновлено 2024.06.24

Aethir: Распределенная облачная инфраструктура GPU для игр и ИИ

Обсуждения

Добро пожаловать в Сообщество HTX. Здесь вы сможете быть в курсе последних новостей о развитии платформы и получить доступ к профессиональной аналитической информации о рынке. Мнения пользователей о цене на ATH (ATH) представлены ниже.

活动图片