Crypto analyst Saeed has outlined a bearish case for the Bitcoin price, predicting that it could still drop to as low as $74,000. The analyst highlighted the $85,000 psychological level as being key to whether BTC drops to this target or witnesses another breakout to new highs.
Bitcoin Price Risks Drop To $74,000 If This Happens
In a TradingView post, Saeed mentioned a drop to $74,000 as his bearish scenario for the Bitcoin price. He explained that if price fails to break out and instead drops below $80,000, a correction would unfold toward $76,500 or even $74,000, which would present a re-entry opportunity for long-term bulls.
The analyst also noted that the Bitcoin price is currently consolidating just below the psychological $85,000 level after a historical bull run which pushed it to new all-time highs (ATHs). Despite the recent downtrend, Saeed is optimistic that the bull run is still on. He stated that the market is cooling off and not crashing, with price action forming a high-tight flag, often a continuation signal after an uptrend.
However, the bearish scenario still stands with a potential drop to $74,000. Saeed remarked that with momentum slowing and volatility compressing, traders must prepare for a major breakout and breakdown in the coming days. He affirmed that the potential drop to this target is still healthy in the broader trend.
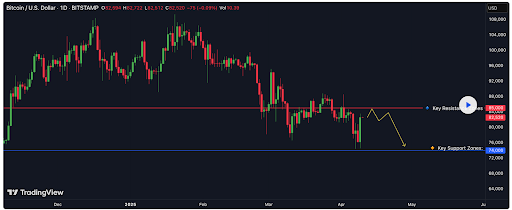
Analyzing the trend structure, the crypto analyst also confirmed that the Bitcoin price remains in a strong bullish trend. He noted that since the breakout above $69,000, the previous ATH from 2021, the rally has been aggressive and directional, overwhelming the BTC bears in the process.
Saeed further remarked that the Bitcoin price has formed a series of higher highs and higher lows, respecting a steep ascending trendline since early February. However, BTC is now coiling near the highs, forming a tight range between $80,000 and $83,500.
Bullish Scenario For BTC
Saeed also outlined a bullish scenario for the Bitcoin price. He stated that a breakout and daily close above $85,000 would confirm the continuation pattern, targeting $88,000 first and then $90,000. The analyst added that volume and candle structure will be key to confirming the move.
Meanwhile, the crypto analyst highlighted key resistance and support zones to watch out for. He stated that the range between $83,000 and $85,000 is the immediate resistance as this area has repeatedly capped prices in recent sessions. As such, a daily close above this zone could trigger the next leg higher.
$88,000 is another resistance zone, although that is the short-term if BTC were to rally higher. Saeed mentioned the range between $90,000 and $92,000 as the third resistance zone to watch out for. He stated that this range is a psychological milestone and a possible magnet for the Bitcoin price if bulls break out cleanly.
Saeed mentioned $80,000, $76,500, and the range between $72,000 and $74,000 as the key support zones to watch out for. He remarked that the range between $72,000 and $74,000 is the major support and ideal retest level if the Bitcoin price corrects, as this is the level where many sidelined bulls are likely waiting to buy in.
At the time of writing, the Bitcoin price is trading at around $80,500, down almost 2% in the last 24 hours, according to data from CoinMarketCap.