Lost the 75,000 Mark, Is Bitcoin About to Experience Its Final Drop?

marsbitОпубликовано 2026-05-28Обновлено 2026-05-28

Введение

Bitcoin fell below the $75,000 support level on May 28th, trading near $74k amid a broader market correction. Major altcoins like ETH, NEAR, WLD, and ONDO also declined, with the market fear index dropping to 34. Over $470 million in liquidations occurred in 24 hours, mostly long positions. The downturn is linked to external pressures. Geopolitical tensions flared as the US conducted new strikes on an Iranian military base, impacting risk assets. Simultaneously, US spot Bitcoin ETFs shifted to consistent net outflows in May, indicating institutional profit-taking, with funds potentially rotating into outperforming AI and tech stocks. Analysts note BTC's long-term fundamentals remain sound. However, short-term price action depends on capital flows, which are currently negative. Key support is identified between $75k-$76k; a break below could lead to a test of $70k-$72k. On-chain data suggests short-term trading activity has plummeted to levels typical of bear market bottoms, signaling either a bottoming phase or a potential final decline before a reversal. Experts advise a diversified strategy as Bitcoin appears to be in a bottoming area.

Original Author: Ma He, Foresight News

On May 28, after repeated battles around the $75,000 mark, the price of Bitcoin finally lost its footing, now sliding to around $74,000. ETH is oscillating repeatedly around $2,000. Previously strong performers like NEAR, WLD, and ONDO have all seen pullbacks.

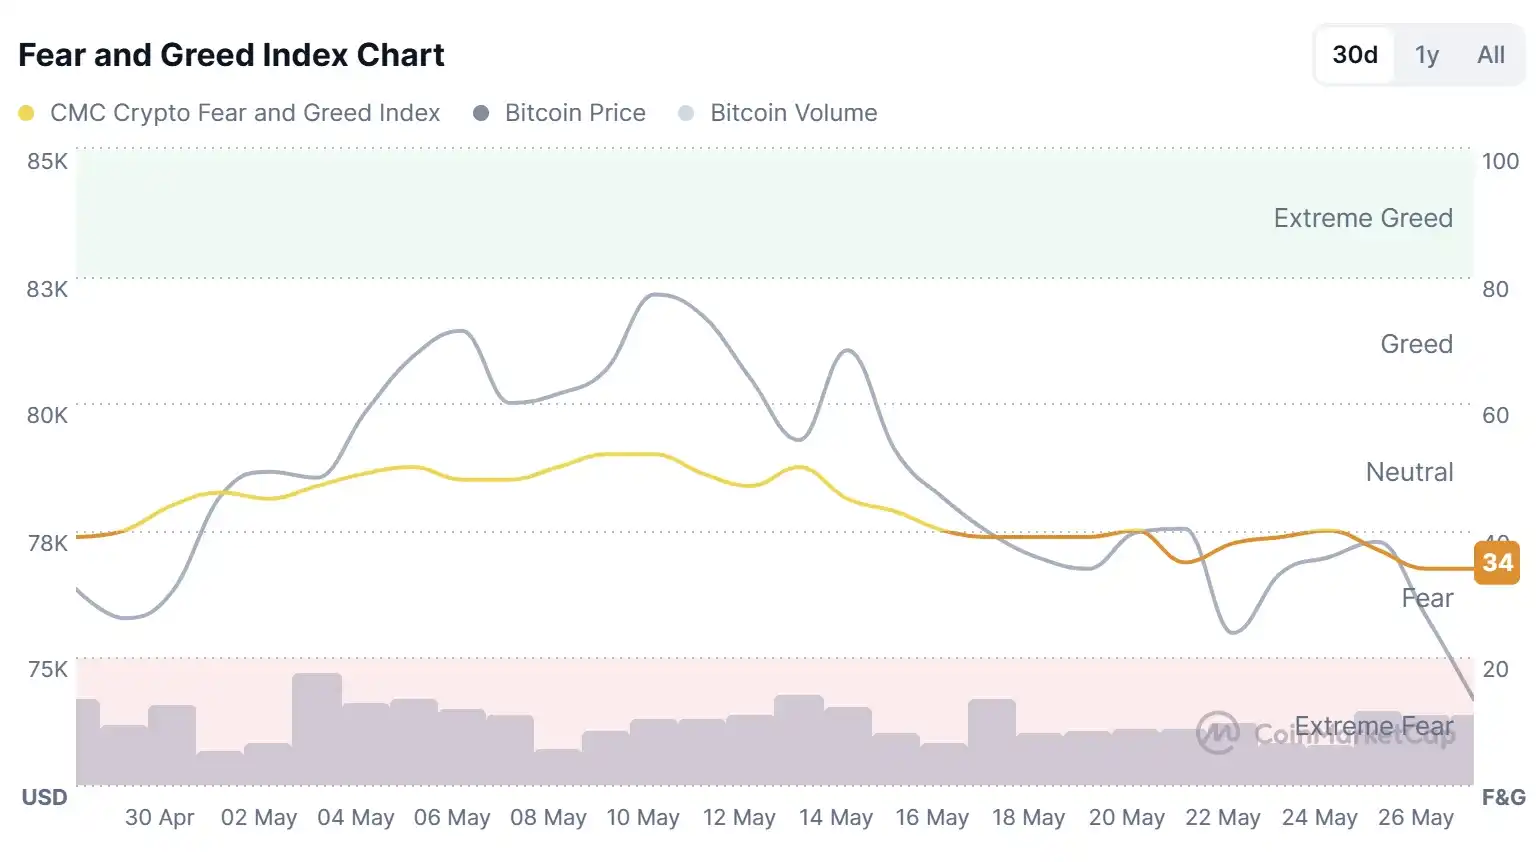
The market fear and greed index has currently fallen back to 34, indicating a state of panic.

Data from Coinglass shows that in the past 24 hours, $470 million worth of open interest contracts were liquidated across the network, with long positions accounting for $420 million of that.

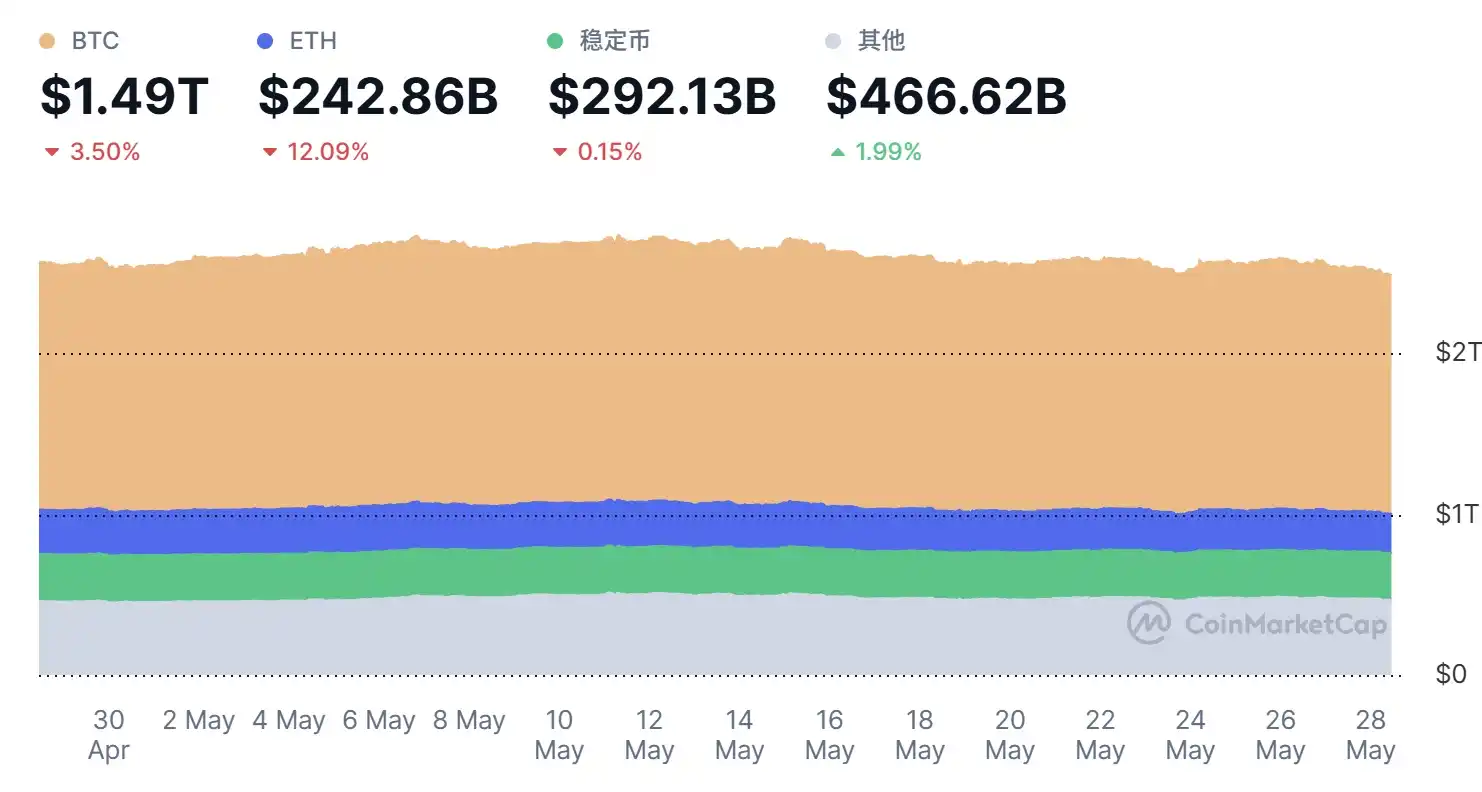
Over the past several weeks, Bitcoin has been oscillating repeatedly between $75,000 and $80,000. It briefly attempted to break above $78,000 but failed to hold. In the past 30 days, BTC has fallen by 3.5%, ETH by about 12%, and stablecoins have also declined by 0.15%.

Regarding macro data, Brent crude oil rose slightly to $97 per barrel, silver fell slightly to $73, the Dow Jones Industrial Average rose 182.60 points (+0.36%) to a new record high. The S&P 500 index rose 1.24 points (+0.02%). The Nasdaq Composite Index stood at 26,674.73 points, up 18.55 points (+0.07%). Spot gold fell below $4,400 per ounce, the first time since March 27, losing over $50 intraday, a drop of 1.25%.

US-Iran Conflict "Reignites"

Geopolitical risks in the Middle East have become another significant external variable. Since 2026, tensions between the US, Iran, and related parties over issues like Iran's nuclear facilities and shipping security in the Strait of Hormuz have repeatedly escalated and eased. In recent months, the US has adopted a strategy combining military action with diplomatic pressure, accompanied by airstrikes, port blockade rumors, and repeated ceasefire negotiations.

Even during windows of ceasefire or diplomatic progress, market pricing for the risk of "reignition" has not completely subsided.

Early on May 28, US President Trump stated that the United States would continue to control Iran's assets. Iran has begun to provide us with what we want. If things don't go well, US Secretary of Defense Hagesse will finish the job. We can end the war with Iran very quickly, and perhaps we must do so. However, I don't think we need to.

Around 5:00 AM Beijing Time, according to reports from Iranian media Fars News, local residents said explosions were heard at Bandar Abbas port in southern Iran.

A US official told Reuters that the US military conducted new strikes on an Iranian military base posing a threat to US forces and commercial navigation in the Strait of Hormuz. US forces also intercepted and shot down multiple Iranian drones posing a threat to US forces and commercial maritime traffic.

Renewed tensions related to the Strait of Hormuz have come into focus, intensifying oil price volatility and putting pressure on global risk assets. In this environment, Bitcoin has exhibited more risk-asset characteristics rather than the traditional "digital gold" safe-haven function—geopolitical uncertainty boosts demand for the US dollar and US Treasuries while suppressing risk appetite, leading to capital outflows from the crypto market.

ETF Net Outflows Reveal Institutional Profit-Taking

Since their launch in early 2024, US spot Bitcoin ETFs have seen cumulative net inflows once exceeding $57 billion, becoming a major channel for institutional Bitcoin allocation. However, a clear reversal in flows has emerged since May 2026.

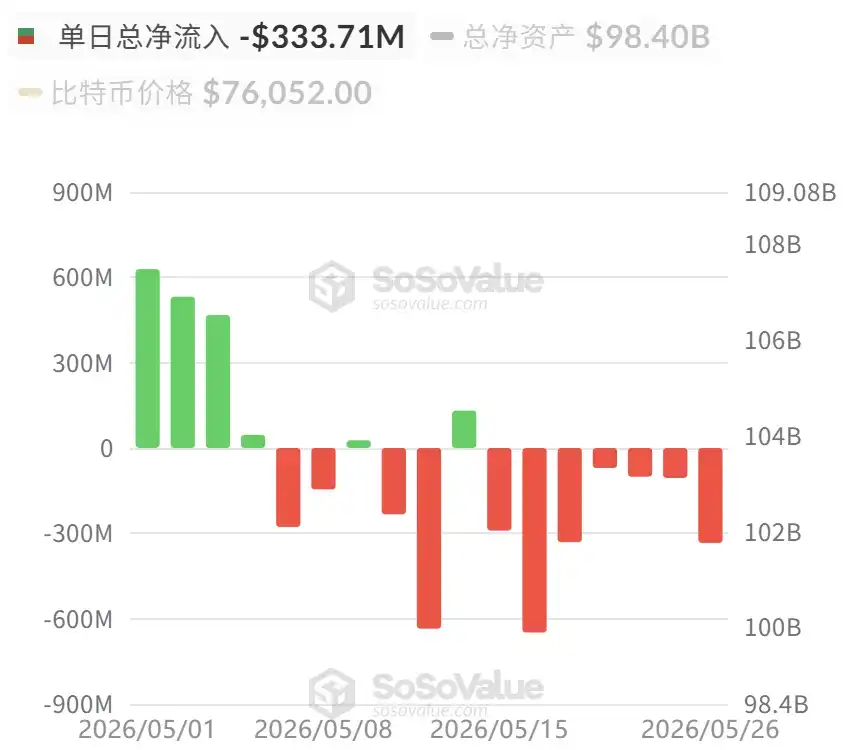
According to tracking data from SoSoValue, between May 5 and 26, US Bitcoin ETFs recorded consecutive net outflows, with daily outflow amounts ranging from tens of millions of dollars to a peak of $600 million, occurring twice.

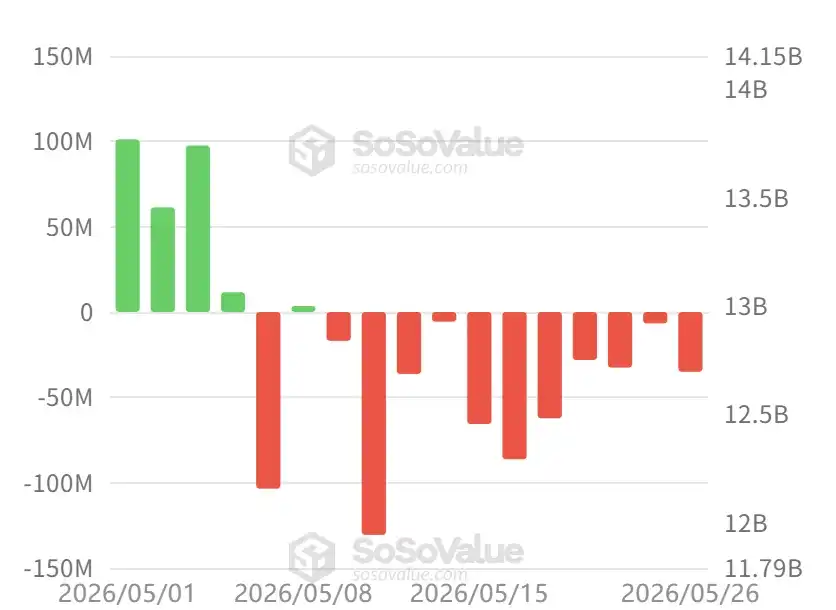
The situation for spot Ethereum ETFs is similarly pessimistic, mirroring Bitcoin with substantial net outflows since early May.

This may not be simple "panic selling," but more likely systematic profit-taking by earlier gainers. ETF holders include traditional asset managers, family offices, and hedge funds, who have chosen to lock in profits via the redemption mechanism after Bitcoin's recovery from lows to the $75,000-$80,000 range. Some funds may have rotated into better-performing AI-related tech stocks—the S&P 500 and Nasdaq indices hitting new highs during the same period, while the crypto market underperformed overall, highlighting capital reallocation within risk assets.

Subsequent Trends

Wintermute published a post stating that BTC's consecutive two weeks of over $1 billion in ETF outflows (following six weeks of inflows) indicate institutions are capitalizing on strength to realize some recent positive returns. More noteworthy is AI. Nvidia delivered a textbook-level performance exceeding expectations, but there was almost no post-market movement. Incremental beats are no longer moving the needle. If the AI momentum fades, the macro picture (record-low consumer confidence, sticky inflation, a hawkish Fed under Governor Waller) will gain more weight, and cryptocurrencies will not be immune.

BTC's long-term structure remains sound (reserves at multi-year lows, long-term holders continue accumulating, CLARITY progressing, HYPE doing what major tokens should do early on). But short-term price is driven by capital flows, and currently, they are negative. The $75,000 to $76,000 range is a key line for BTC. Holding here, BTC will reattempt to assault $80,000; breaking below this range could lead to a quick slide towards $70,000 to $72,000.

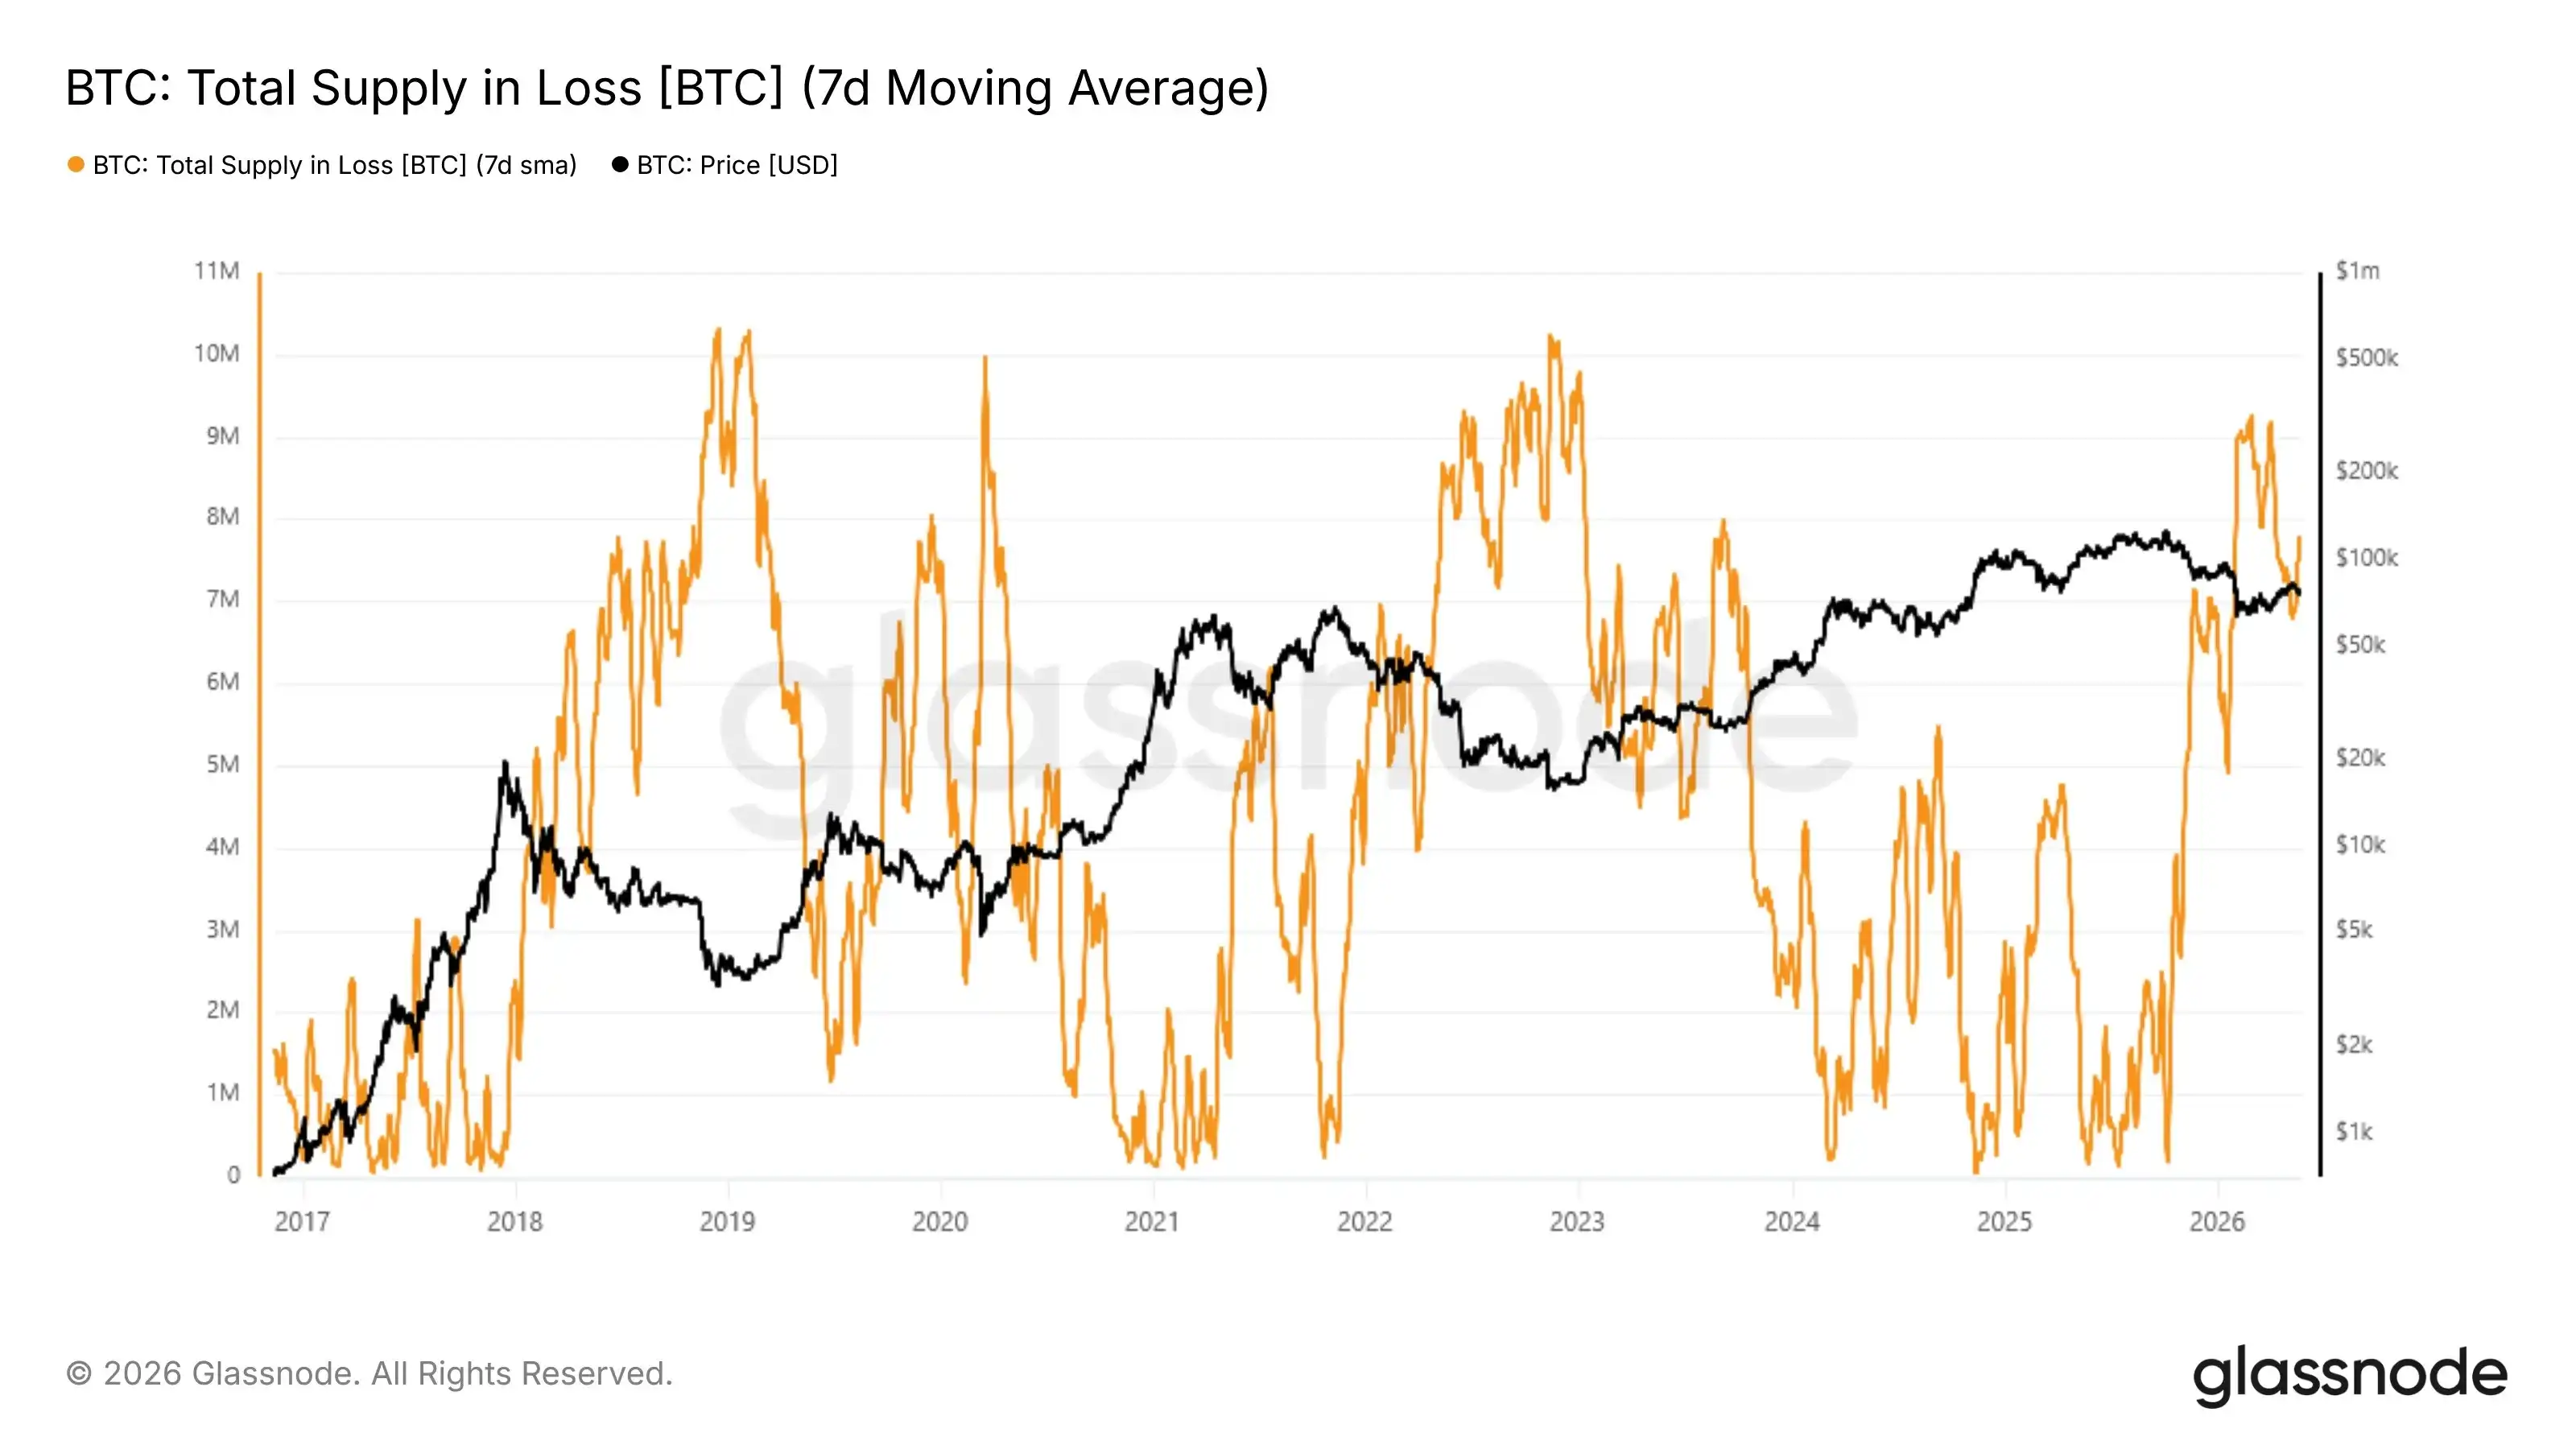
glassnode tweeted that at a price of $76,000, approximately 7.75 million BTC are in a loss position. This supply overhang is a structural feature of bear markets and is typically only resolved when weak hands capitulate.

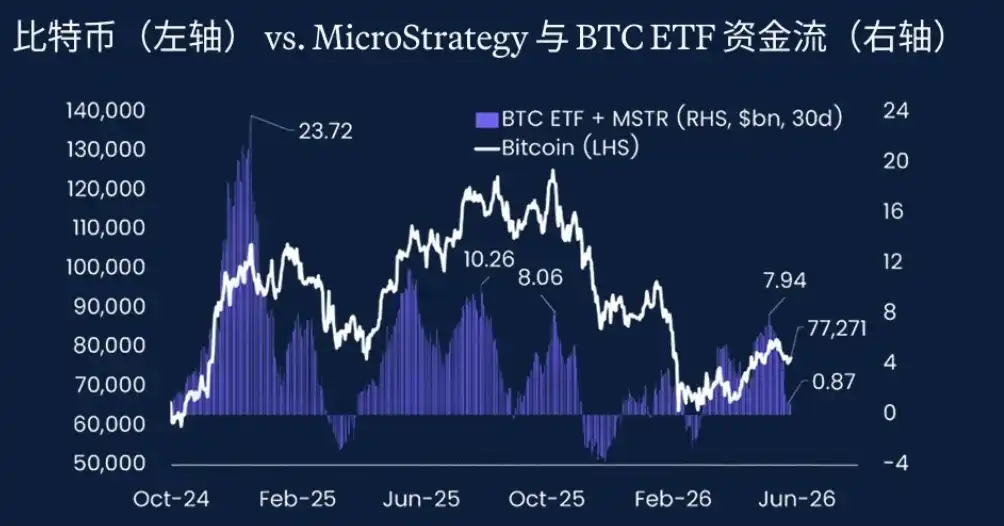
BIT tweeted that, regarding Bitcoin, the sustained rally over the past period largely depended on the interplay between institutional demand and market supply available for sale. Over the past year, Bitcoin spot ETFs and Strategy have been significant sources of such demand. When ETF inflows accelerated and Strategy continuously increased Bitcoin holdings, Bitcoin prices typically continued to rise.

BIT stated that the combined net purchases of ETFs and Strategy have now fallen to only $870 million, primarily due to significant ETF outflows, shifting from net buying to net selling. Before ETF inflows stabilize and rebound, Bitcoin may remain in a consolidation phase in the short term.

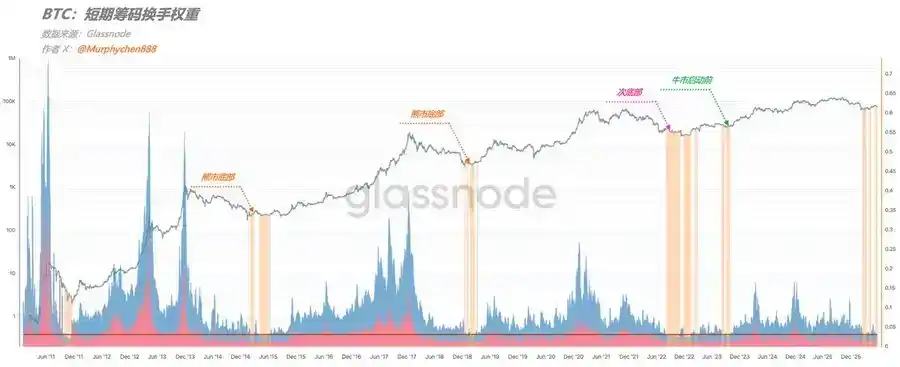
Analyst Murphy stated that using the on-chain indicator "Weight of Short-Term Capital Activity" (i.e., the USD value proportion represented by short-term coin turnover), one can observe the current state of the BTC market. This indicator reflects the latest short-term trading behaviors like speculation, arbitrage, profit-taking, or panic selling. Currently, this weight has fallen to historically extreme lows, only seen at the absolute bottom of bear markets in the past 15 years. This means short-term turnover has significantly cooled down, economic value is sedimenting towards long-term holdings, and the market is in a phase of low volatility, accumulation, or with pronounced bottoming characteristics.

Murphy's judgment, based on this, is that the current market might be in one of three phases: the bottom of a bear market; a sub-bottom, possibly with one last drop; or accumulation before a bull market launch. However, rational judgment can temporarily rule out pre-bull accumulation. It's currently not advisable to fully bet on a single scenario; a diversified portfolio strategy to cope with different outcomes is recommended. The relative position on the long-term macro direction indicates Bitcoin is near a bottom.

Связанные с этим вопросы

QAccording to the article, what happened to Bitcoin's price on May 28th and what is a key support level mentioned?

AOn May 28th, the Bitcoin price failed to hold above the $75,000 level and slipped to around $74,000. The article mentions that the $75,000 to $76,000 range is a critical line for Bitcoin; holding here could allow it to rechallenge $80,000, while breaking below could lead to a quick slide toward $70,000 to $72,000.

QWhat are the two main external factors cited in the article as contributing to the recent market pressure on cryptocurrencies?

AThe two main external factors are: 1) Renewed geopolitical tensions in the Middle East, specifically between the US and Iran, which increases risk-off sentiment and strengthens the US dollar. 2) Sustained net outflows from US Bitcoin and Ethereum spot ETFs, indicating profit-taking by institutional investors.

QWhat does the analysis from Wintermute suggest about the relationship between the AI sector and cryptocurrency markets in the current context?

AWintermute suggests that the AI sector has been attracting capital. They note that if the momentum in AI stocks (exemplified by Nvidia) fades, the broader negative macro picture would gain more weight, and cryptocurrency markets would not be immune to the resulting pressure.

QAccording to analyst Murphy's on-chain indicator, what are the three possible market stages Bitcoin could currently be in?

ABased on the 'short-term fund activity weight on-chain' indicator, analyst Murphy suggests the current market could be in one of three stages: 1) The bottom of a bear market. 2) A secondary bottom, possibly before one final drop. 3) Accumulation before a bull market launch. However, he rationally excludes the bull market pre-accumulation scenario for now.

QWhat is the reported state of the market fear and greed index, and what does the data from Coinglass show about liquidations in the past 24 hours?

AThe market fear and greed index has fallen to 34, indicating a state of 'fear'. Coinglass data shows that over the past 24 hours, $470 million worth of contracts were liquidated across the network, with long positions accounting for $420 million of that total.

Похожее

Consumer Confidence Hits Bottom, Macro Correlations Simultaneously Break Down: How Much Longer Can the U.S. Stock Market's Solo Rally Last?

The U.S. stock market is exhibiting a rare divergence: while consumer confidence hits historic lows and traditional macro asset correlations break down, major indices like the Nasdaq 100 and S&P 500 continue reaching record highs, fueled primarily by AI and semiconductor momentum. The rally is now highly concentrated, with strength rotating from giants like Nvidia to higher-beta plays within semiconductors, particularly memory chips. This surge occurs despite a significant split between pessimistic consumer sentiment and still-resilient actual spending behavior, partially supported by fiscal stimulus. Goldman Sachs traders highlight a critical structural fissure: correlations between the S&P 500 and key macro assets (rates, gold, VIX, oil) have deviated extremely from long-term historical norms. Concurrently, the market is in a negative Gamma regime, making it more sensitive to price moves, and hedge fund positioning in momentum and semiconductors is at crowded levels. The sustainability of this "solo rally" faces three main constraints: 1) Oil price volatility linked to Middle East geopolitical risks, 2) Extreme crowding in semiconductor and momentum trades, increasing vulnerability to disappointments, and 3) The breakdown of traditional macro correlations, suggesting the rally reflects a specific mix of factors rather than broad-based risk appetite. The key question is not if indices can rise further, but which variable—oil, rates, or semiconductor momentum—might trigger a repricing of the current fragile logic.

marsbit54 мин. назад

Consumer Confidence Hits Bottom, Macro Correlations Simultaneously Break Down: How Much Longer Can the U.S. Stock Market's Solo Rally Last?

marsbit54 мин. назад

Will OpenAI Swallow the Application Layer? a16z Says Real Opportunities Lie Outside General Models

As large language models (LLMs) from companies like OpenAI and Anthropic become more powerful, many fear they will dominate the AI application layer, leaving no room for startups. However, this article argues that the real opportunity lies not on the "Yellow Brick Road"—the high-profile, general-purpose tasks like code and text generation that model labs are directly pursuing—but in the "rest of Oz": complex, vertical-specific applications. On the Yellow Brick Road, model companies have inherent advantages: control over the model, better margins, pricing power, and strong distribution. Startups building generic, horizontal "co-pilot" tools for standard tasks are competing directly on this path and are vulnerable. True defensibility and value are found in specialized, vertical applications. These involve deep integration into messy, multi-step business workflows (e.g., sales, insurance, legal), handling legacy systems, data quality issues, compliance, and governance. The "scaffolding" around the model—the specialized tools, automations, workflows, and industry knowledge—becomes more critical than the raw model power itself. Vertical AI companies can build defensible moats through: * **Data & Learning Flywheels:** Capturing unwritten industry practices and specific customer feedback not found in public training data. * **Managing Model Complexity:** Routinely evaluating and routing queries across multiple models (including open-source) to optimize for performance and cost, and absorbing the migration burden of model upgrades for clients. * **Cost Optimization:** Using cheaper, fine-tuned models for specific sub-tasks instead of always calling the most expensive, general-purpose model. * **Governance & Compliance:** Providing the control plane for permissions, auditing, and ensuring compliance with industry-specific regulations (e.g., HIPAA, FINRA). Examples from sales (11x) and insurance (FurtherAI) illustrate that clients pay for systems that drive specific business outcomes (e.g., sales pipeline, policy underwriting), not for generic intelligence. These systems become the "operational memory" of a business, a layer that is hard to replace, even as the underlying LLMs commoditize and improve. To test if a startup is building in the "rest of Oz," it should pass checks like the **Tool & Steps Test** (requires complex, multi-step workflows), the **System Test** (owns the end-to-end workflow, not just a tool on top), and the **Hedge Fund / P&L Test** (measured by client business outcomes, not benchmark scores). Both model labs and vertical application companies will win. The next generation of enterprise software will be built in the specialized, complex, and high-value territory beyond the Yellow Brick Road.

marsbit1 ч. назад

Will OpenAI Swallow the Application Layer? a16z Says Real Opportunities Lie Outside General Models

marsbit1 ч. назад

'ASIC Giant' Marvell Sets Record Quarterly Revenue, Raises Guidance Again, CEO Says Data Center Business Is 'On Fire'

Marvell Technology, a leading player in custom AI chips and data center connectivity, reported record revenue for its fiscal Q1 2027, driven by explosive demand in its data center business. Revenue reached $2.418 billion, slightly surpassing expectations, though GAAP net income fell year-over-year due to acquisition-related costs. Crucially, data center revenue hit $1.83 billion, making up 76% of the total and growing 27% YoY. The company significantly raised its full-year and next-year guidance, citing "exceptionally strong AI-related orders." Revenue is now projected at ~$11.5 billion for FY2027 and ~$16.5 billion for FY2028. CEO Matt Murphy emphasized that growth in the data center segment is accelerating. The AI Interconnect business, now expected to grow over 70% annually, saw its forecast lifted again due to rising network demands in complex AI models. Additionally, Marvell's custom chip (XPU) business is on a steep growth path, with FY2028 revenue anticipated to double and a target of over $10 billion by FY2029. The company also expanded its strategic collaboration with NVIDIA, focusing on silicon photonics, system integration, and AI-RAN solutions. To secure supply for surging demand, Marvell plans about $1 billion in supplier prepayments this fiscal year, highlighting its long-term capacity planning. Despite the strong results, the stock dipped slightly in after-hours trading.

marsbit1 ч. назад

'ASIC Giant' Marvell Sets Record Quarterly Revenue, Raises Guidance Again, CEO Says Data Center Business Is 'On Fire'

marsbit1 ч. назад

Торговля

Спот
Фьючерсы
活动图片