Is Bitcoin About To Enter A New Price Discovery Zone? Here’s What To Know

bitcoinistОпубликовано 2025-03-06Обновлено 2025-03-06

Введение

Bitcoin's price has shifted toward an upside direction, allowing it to reclaim the pivotal $90,000 mark after facing heightened bearish...

Bitcoin’s price has shifted toward an upside direction, allowing it to reclaim the pivotal $90,000 mark after facing heightened bearish and selling pressure over the past few days driven by macroeconomic uncertainty. 

The flagship asset recently rose to the $94,000 threshold following US President Donald Trump’s latest announcement of a crypto strategic reserve before dropping again to $82,000. With BTC surging once again, renewed optimism has entered the market as investors anticipate a larger rebound.

Price Discovery Phase On The Horizon

Given the robust volatility in the market presently, Bitcoin has failed to maintain an upward movement for an ideal period. During the price fluctuations, Alphractal, an advanced on-chain data and investment platform, has outlined a crucial moment for BTC that could impact its market dynamics.

According to the on-chain platform, Bitcoin is approaching a critical juncture as it moves closer to entering a price discovery zone. This move comes as bullish sentiment rises about Bitcoin’s prospects despite the ongoing volatility in the broader crypto market.

Specifically, this price recovery zone is located between the $70,000 and the $90,000 range, indicating a $20,000 price gap. Furthermore, within this zone, key derivatives metrics such as Open Interest (OI), trade count, and buying volume are showing a lack of historical consolidation.

Bitcoin
Incoming price recovery for BTC | Source: Alphractal on X

As BTC aims to enter the price recovery zone, Alphractal highlighted that the $100,000 level is likely to become the next key resistance area. Meanwhile, the $70,000 mark is expected to act as a support range once BTC enters the price recovery zone.

When this happens, the platform points to the frequent liquidations of longs and shorts’ BTC positions due to poor price stability. With bullish momentum growing once again and key levels being tested, this move may extend, propelling the asset toward higher price levels.

Data from CoinMarketCap shows that Bitcoin has rebounded by nearly 3% in the last 24 hours, bringing its price slightly above the $90,000 mark. In spite of the brief rebound, selling pressure continues to increase as BTC‘s trading volume has plummeted by more than 26% in the past day.

Bitcoin Whale Transaction Volume At Neutral Level

While Bitcoin price performance wanes, investors’ sentiment appears to have weakened, as evidenced by a decline in large investors or whale transaction volume over the past 2 years. Alphractal reported that the volume of transactions above $100,000 from large investors has remained neutral since November 2022 compared to 2021 when BTC witnessed significant movements.

There has also been a decrease in on-chain volume over time. When compared to earlier times, the volume of BTC transactions on the blockchain is still lower. On-chain volumes have occasionally fallen to levels not seen since 2014, which suggests that network activity is declining.

Bitcoin
BTC trading at $91,298 on the 1D chart | Source: BTCUSDT on Tradingview.com
Featured image from Unsplash, chart from Tradingview.com
Godspower Owie

Godspower Owie

Godspower Owie is my name, and I work for the news platforms NewsBTC and Bitcoinist. I sometimes like to think of myself as an explorer since I enjoy exploring new places, learning new things, especially valuable ones, and meeting new people who have an impact on my life, no matter how small. I value my family, friends, career, and time. Really, those are most likely the most significant aspects of every person's existence. Not illusions, but dreams are what I pursue.

Похожее

On-chain Analyst: Why Are Most Zcash Transactions Still Traceable?

Title: Why Most Zcash Transactions Remain Traceable Zcash, a privacy-focused cryptocurrency launched in 2016, was designed to offer anonymity by hiding transaction details like sender, receiver, and amount using zero-knowledge proof technology (zk-SNARKs). However, in practice, a significant portion of ZEC transactions are still traceable on-chain. The key reason is Zcash's dual-address system. It features transparent addresses (t-addresses), which work like standard Bitcoin addresses with all data public, and shielded addresses (z-addresses) that encrypt transaction details. There are four transaction types with varying privacy levels: fully transparent (t→t), partially shielded (t→z and z→t), and fully private (z→z). Despite its privacy capabilities, most real-world Zcash activity involves transparent addresses, primarily because major exchanges and institutions use them for regulatory compliance. As a result, blockchain analytics platforms like Arkham can track and attribute a substantial volume of Zcash transactions. Arkham reports it has identified entities behind over $420 billion in ZEC transaction volume. Case studies highlight this traceability: the U.S. government holds seized Zcash from a dark web case, visible via its transparent wallet, and individual traders' profitable moves are trackable from purchase to exchange deposit. In conclusion, Zcash's privacy is not inherent but user-dependent. While purely shielded (z→z) transactions remain cryptographically private, the prevalence of transparent address usage makes much of the network's activity traceable. The actual privacy protection offered depends entirely on how users choose to transact.

marsbit37 мин. назад

On-chain Analyst: Why Are Most Zcash Transactions Still Traceable?

marsbit37 мин. назад

From Power Infrastructure to Token Economy: The 'Seven-Layer Cake' of the AI Industry Chain

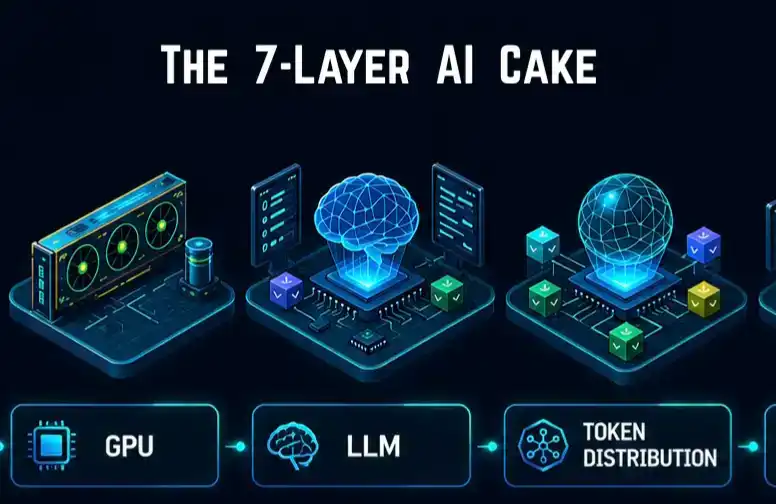
From Power Grid to Token Economy: The AI Industry's "Seven-Layer Cake" The AI industry is shifting from a "model-centric" paradigm focused on massive training to a "token-centric" industrial era driven by inference demand. This new phase revolves around the production, distribution, scheduling, and consumption of tokens—the units of computation used by AI agents for every interaction and task. The article proposes a "seven-layer cake" framework for the AI economy: 1. **Power**: The foundational energy source, with competition shifting to securing stable, low-cost electricity. 2. **AIDC (AI Data Centers)**: Large-scale "Token factories." A trend toward smaller, modular, and regionally deployed AI Factories is emerging for efficiency and proximity to users. 3. **GPU**: The core production hardware for tokens. While NVIDIA dominates, competition exists from AMD, ASIC makers, and Chinese chipmakers, with a growing focus on inference efficiency. 4. **LLMs**: The "engines" that generate tokens. The competition is evolving beyond model size to prioritize factors like token cost, inference efficiency, and operational synergy with infrastructure. 5. **Token Distribution**: The "grid" that allocates and rents out compute resources, led by cloud giants and specialized AI-native platforms. 6. **Token Optimization & Intelligent Scheduling**: The critical "brain" layer that intelligently routes tasks (e.g., to local, cloud, or edge models) for optimal cost, latency, and privacy—maximizing the value of each token. 7. **AI Agents & Models**: The end consumers of tokens. The vision involves billions of AI agents working and interacting concurrently, consuming vast amounts of tokens. Currently, the industry faces fragmentation and inefficiencies between these layers. The true "mass adoption era" of AI will begin only when this seven-layer infrastructure is fully integrated and operates as a cohesive, intelligent network—transforming AI from a software tool into a global industrial system spanning energy, hardware, and compute logistics.

marsbit58 мин. назад

From Power Infrastructure to Token Economy: The 'Seven-Layer Cake' of the AI Industry Chain

marsbit58 мин. назад

Semiconductors up 78% annually, software down 12% annually: The 'Liquidity Siphon' is playing out within tech stocks

Semiconductor ETFs like SOXX have surged 78.5% year-to-date, while software ETFs like IGV have dropped 12.5%, creating a record performance gap exceeding 90 percentage points. This reflects a major "liquidity suction" within tech stocks, with capital flooding into semiconductors as software faces selling pressure. Driving the semiconductor boom are staggering capital expenditure plans from hyperscalers like Microsoft, Alphabet, Amazon, and Meta, whose combined 2026 capex is projected near $700 billion. This fuels demand for chips, with companies like SanDisk (up 426%), Intel (up 222%), and Micron (up 154%) leading the S&P 500. In contrast, major software firms like Microsoft, Adobe, and Salesforce are all down over 17% year-to-date. The software sector faces a dual challenge: capital is being redirected to semiconductors, and the rise of AI agents like Claude Code threatens traditional SaaS business models, triggering a narrative of AI displacement. Key unanswered questions remain: How long can hyperscalers sustain their massive capex, given potential free cash flow pressures? And will capital eventually rotate back into the deeply oversold software sector? While some analysts warn of a potential semiconductor bubble akin to the dot-com era, the sector's powerful momentum continues, making market timing exceptionally difficult.

marsbit58 мин. назад

Semiconductors up 78% annually, software down 12% annually: The 'Liquidity Siphon' is playing out within tech stocks

marsbit58 мин. назад

Торговля

Спот
Фьючерсы

Популярные статьи

Как купить S

Добро пожаловать на HTX.com! Мы сделали приобретение Sonic (S) простым и удобным. Следуйте нашему пошаговому руководству и отправляйтесь в свое крипто-путешествие.Шаг 1: Создайте аккаунт на HTXИспользуйте свой адрес электронной почты или номер телефона, чтобы зарегистрироваться и бесплатно создать аккаунт на HTX. Пройдите удобную регистрацию и откройте для себя весь функционал.Создать аккаунтШаг 2: Перейдите в Купить криптовалюту и выберите свой способ оплатыКредитная/Дебетовая Карта: Используйте свою карту Visa или Mastercard для мгновенной покупки Sonic (S).Баланс: Используйте средства с баланса вашего аккаунта HTX для простой торговли.Третьи Лица: Мы добавили популярные способы оплаты, такие как Google Pay и Apple Pay, для повышения удобства.P2P: Торгуйте напрямую с другими пользователями на HTX.Внебиржевая Торговля (OTC): Мы предлагаем индивидуальные услуги и конкурентоспособные обменные курсы для трейдеров.Шаг 3: Хранение Sonic (S)После приобретения вами Sonic (S) храните их в своем аккаунте на HTX. В качестве альтернативы вы можете отправить их куда-либо с помощью перевода в блокчейне или использовать для торговли с другими криптовалютами.Шаг 4: Торговля Sonic (S)С легкостью торгуйте Sonic (S) на спотовом рынке HTX. Просто зайдите в свой аккаунт, выберите торговую пару, совершайте сделки и следите за ними в режиме реального времени. Мы предлагаем удобный интерфейс как для начинающих, так и для опытных трейдеров.

1.4k просмотров всегоОпубликовано 2025.01.15Обновлено 2025.03.21

Как купить S

Sonic: Обновления под руководством Андре Кронье – новая звезда Layer-1 на фоне спада рынка

Он решает проблемы масштабируемости, совместимости между блокчейнами и стимулов для разработчиков с помощью технологических инноваций.

2.3k просмотров всегоОпубликовано 2025.04.09Обновлено 2025.04.09

Sonic: Обновления под руководством Андре Кронье – новая звезда Layer-1 на фоне спада рынка

HTX Learn: Пройдите обучение по "Sonic" и разделите 1000 USDT

HTX Learn — ваш проводник в мир перспективных проектов, и мы запускаем специальное мероприятие "Учитесь и Зарабатывайте", посвящённое этим проектам. Наше новое направление .

1.8k просмотров всегоОпубликовано 2025.04.10Обновлено 2025.04.10

HTX Learn: Пройдите обучение по "Sonic" и разделите 1000 USDT

Обсуждения

Добро пожаловать в Сообщество HTX. Здесь вы сможете быть в курсе последних новостей о развитии платформы и получить доступ к профессиональной аналитической информации о рынке. Мнения пользователей о цене на S (S) представлены ниже.

活动图片