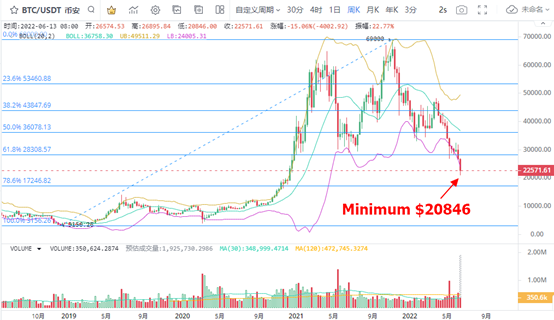
1、 BTC gradually approaches the lower limit of the section
With only one trading day, the weekly trading volume of BTC is close to the trading volume in the previous week. Therefore, it is expected that the BTC transaction volume will continue to increase significantly this week, and it is possible to challenge the historical peaks of March 9, 2020 and may 17, 2021. Therefore, from the low volume performance, BTC quickly approaches the local support level.
At the point, BTC reached a minimum of US $20846, with a difference of US $3600 from the corresponding US $17246 of Fibonacci 78.6. Since BTC is already at the lower limit of Fibonacci 61.8% and Fibonacci 78.6%, low absorption opportunities can continue to be concerned.
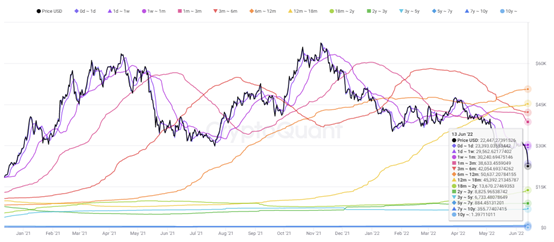
2. High concentration of BTC investors' currency holdings
The high cost prices of BTC investors are concentrated, which means that the decline will not have a large rebound trend in the short term after the tightening of the market. Especially when the BTC price rebounds to the point with high currency concentration, the BTC price is highly likely to fluctuate repeatedly.
At specific points, among the investors with a holding period of 1 week to 1 month, the average holding cost price is $30240;
Among investors with a holding period of 1 to 3 months, the average holding cost price is $38633;
Among investors with a holding period of 3 to 6 months, the average holding cost price is $42054;
Among investors with a holding period of 6 to 12 months, the average holding cost price is $50637;
Among the investors who hold money for 12 to 18 months, the average holding cost price is $45392;
Among investors with a holding period of 18 to 2 years, the average holding cost price is $13670.
According to this judgment, BTC's currency holding time is at the pressure level of 18 months, and the price range of USD 38000 to 50000 can be concerned. In the short term, the pressure level within one month is concerned at USD 300000. It is expected that the lowest retracement point of BTC can pay attention to the corresponding USD 17246 of 78.6% Fibonacci. The main cost price within 18 months to 2 years can be paid attention to $13670.
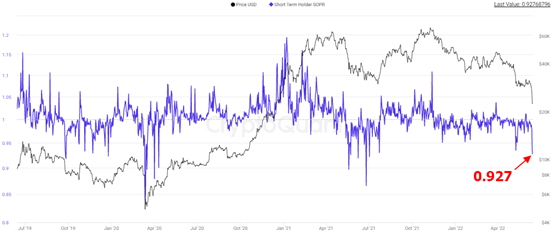
3. Loss selling by BTC short-term investors
In terms of market trend, the unilateral decline of BTC triggered the selling enthusiasm of short-term investors. Judging from the SOPR index of short-term investors, the index value reached a low of 0.927 on June 13. Compared with the middle of 2021, the short - and medium-term cash holders sold BTC at a loss, but the loss space was smaller. However, in view of the fact that more fixed discs have not been completely cleared, the possibility of continuous low-level operation of the indicators is not ruled out, so as to prolong the period of price adjustment.
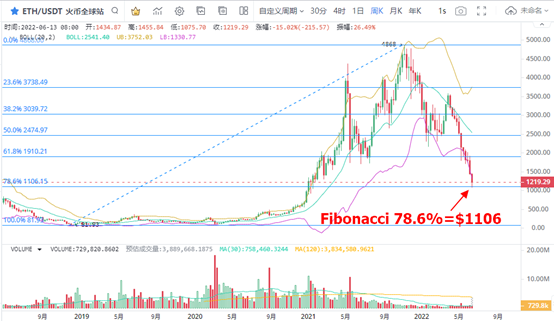
4. Eth is confirming important support
The weekly K-line chart shows that the ETH price is within the key low price range, and the USD 1106 corresponding to 78.6% of Fibonacci is the lowest point in this range. The technical rebound trend also appeared around us $1106, and eth reached as low as US $1075. It can be seen that the support is effective for short-term price fluctuations.
Taking into account the large decline in eth, the decline reached 77.9% after the withdrawal from US $4868. At the same time, ETH is expected to reach a higher position in the weekly trading volume, which is close to the trading volume performance from 2020 to the middle of 2021. Therefore, when judging the ETH bottom area, the bottom characteristics of its trading volume prompt will gradually appear. In particular, only after the accumulated volume can increase can it push up the price of eth.