Bitcoin (BTC) price is rising in the lower timeframe, but there is no viable price action in the higher timeframe.
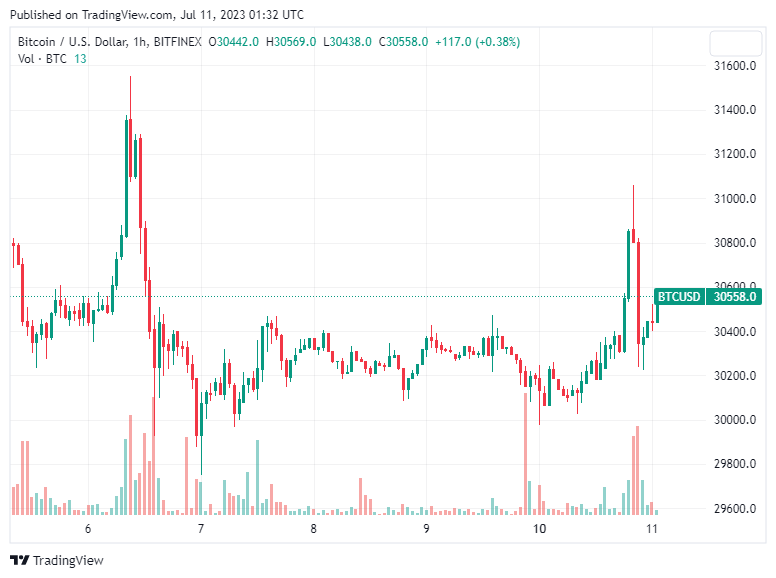
Source: TradingView
The Dow Jones Industrial Average rallied on Monday (July 10), as Wall Street attempted to recover from last week's decline. The reversal comes as investors brace for a flurry of inflation data this weekend and the start of second-quarter earnings season.
Closing Monday's session, the Dow Jones Industrial Average rose 0.62%) to 33,944 points. The S&P 500 Index advanced 0m24% to 4,409 points. Meanwhile, the Nasdaq Composite inched up 0.18% to 13,685 points. The main indexes all ended a series of 3 consecutive losing sessions.
The US CPI Consumer Price Index report will be released on July 12, followed by the PPI producer price index report – a measure of wholesale price pressure – on July 13.
Last week, the S&P 500 lost 1.16%, while the Nasdaq Composite and Dow Jones fell 0.92% and 1.96%, respectively. Although jobs data rose less than expected in June, wages rose slightly higher than expected, raising concerns about the possibility of more rate hikes from the US Federal Reserve (Fed). .
Fundstrat's Tom Lee sees inflation reporting possibly lower than forecast, which could lead to another steep climb.
Gold prices were mostly flat on Monday, as investors awaited US inflation data that could influence the Federal Reserve's (Fed) policy stance. At the end of the session, the spot gold contract was almost flat at 1,925 USD/oz. Gold futures fell 0.1% to $1,931 an ounce.
On the same day, oil prices fell on the possibility of more US rate hikes, however, the move to cut crude oil supply from top oil exporters Saudi Arabia and Russia capped the decline. of oil prices. At the end of the session, the Brent oil contract fell 1% to $ 77.69 a barrel, after touching the highest level in more than 2 months at the beginning of the session.
On the 1-hour chart, BTC/USDT is showing actionable price movement, unlike the one-day timeframe where the market is stagnant. The crypto king remains bullish after flipping the 50, 100, and 200-day exponential moving Medium (EMAs) at $30,522, $30,296 and $30,344 to support.
However, experts predict there will be a lingering drag until the CPI causes some volatility. Based on popular opinion, the report could be at 3.1%, an outcome that could trigger a rally for the top cryptocurrency.
If that happens, Bitcoin price is likely to break out of the range and move above $30,500 to record new highs.
The Fibonacci Retracement indicator shows that Bitcoin price is likely to head towards the 50% Fib level at $30,727. This outlook is supported by the Relative Strength Index (RSI) and AO, moving up to show bullish momentum.
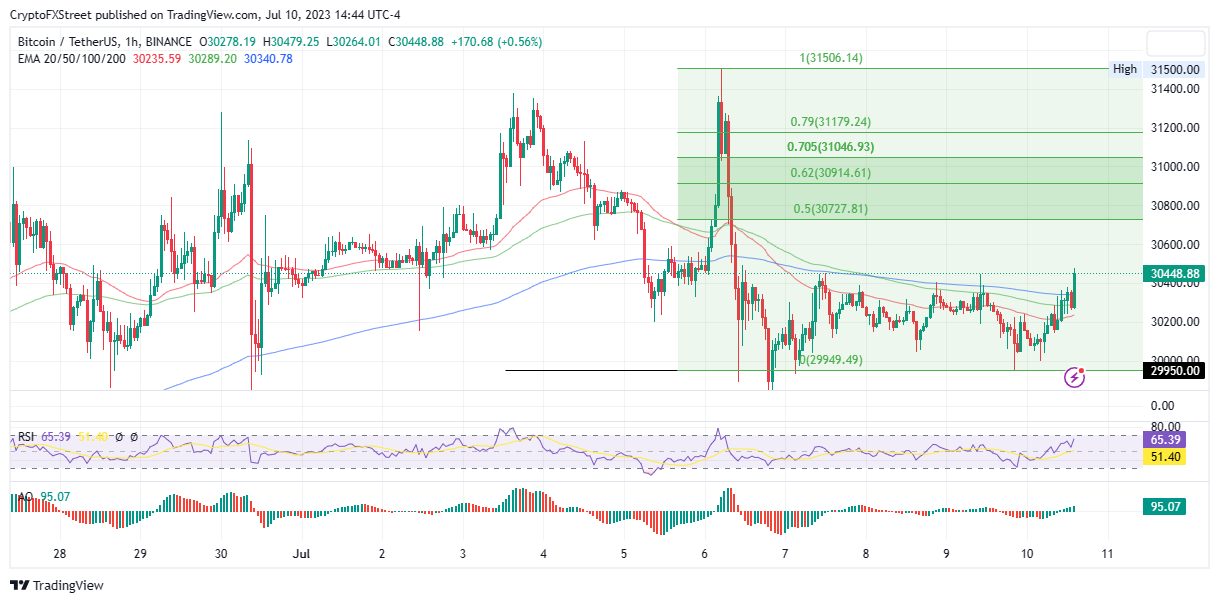
BTC chart. Source: TradingView
However, the influence of macroeconomics like CPI has dried up over time, meaning BTC could either continue its dull price action or succumb to investor greed and head south.
As for ETH, due to the lack of proper catalysts in individual ecosystems, the largest altcoin price is moving in tandem with BTC, gradually increasing its position as the broader market prepares for CPI.
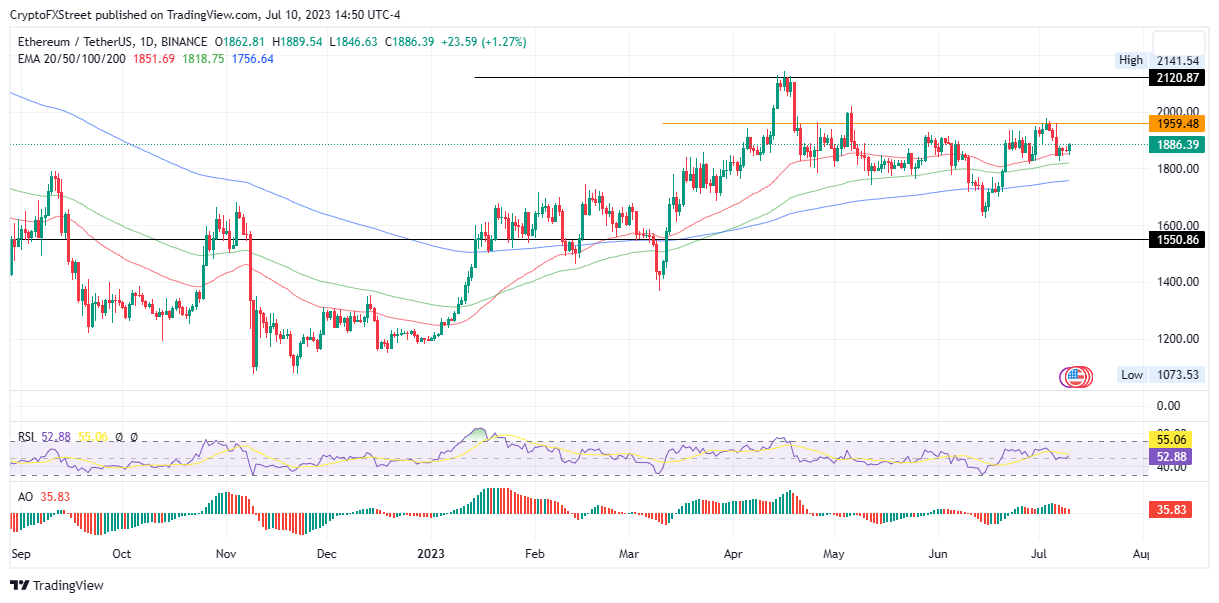
ETH chart. Source: TradingView
On the other side of altcoins, about half of the top 100 are in the green, with MINA leading the way with a gain of more than 15% in a 24-hour period. Following closely behind are MATIC approaching 9%, KAVA +7%, FTM +6.3%, BNB +5.3% and other bullish altcoins recording 0.5 – 4% returns.
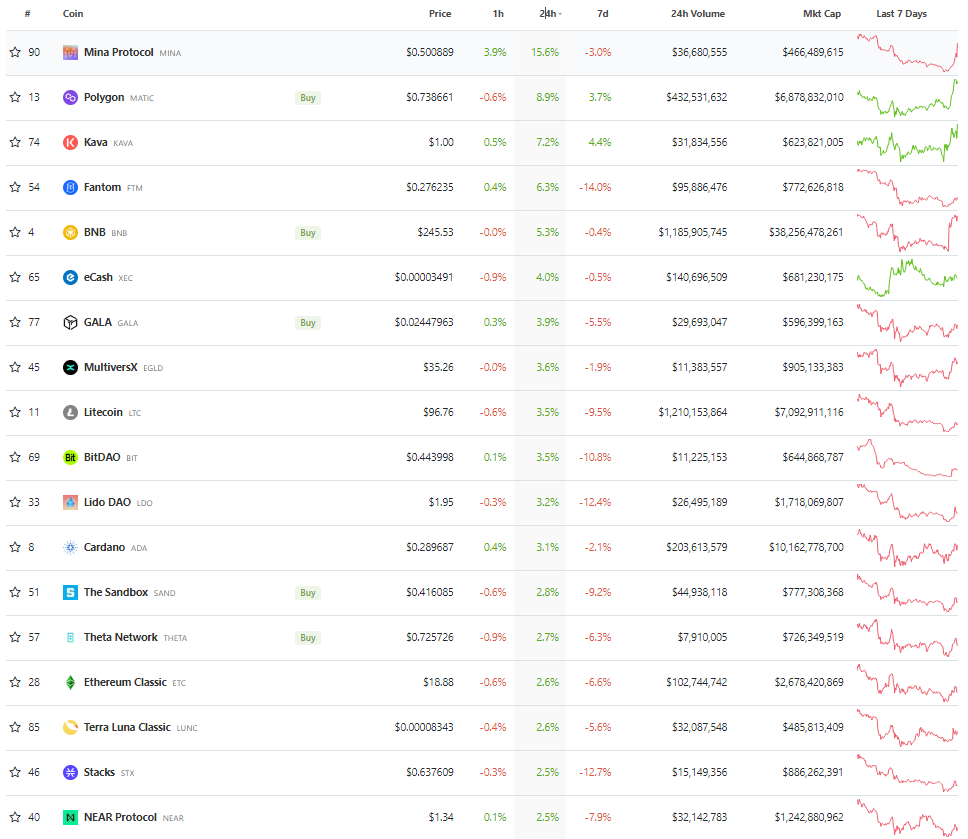
Source: Coinecko