XRP (XRP) has retraced nearly 50% from its multi-year high of $3.66 to trade below $2, a technical setup that may have “bearish implications” for its price, according to Veteran analyst Peter Brandt.
Key takeaways:
XRP appeared bearish below $2, with chart technicals pointing toward $1.
A successful test of support at $1.78 could invalidate the bearish outlook.
Is the XRP top in?
XRP’s technical setup shows that its inability to hold above the $2 support level puts the altcoin at risk of a deeper correction.
In a Wednesday post on X, Peter Brandt said the presence of a “potential double top” pattern could see XRP drop lower over the coming weeks or months.
Related: XRP sinks below $2 despite $1B in ETF inflows: How low can price go?
The double top pattern is still in play on the weekly chart (see below) and will be confirmed once XRP closes the week below the neckline at $2.
If the price reclaims the neckline, the breakdown could translate into a bear trap, invalidating the bearish case.
“Sure, it may fail, and I will deal with this if it does,” Brandt said, adding:
“But for now this has bearish implications.”
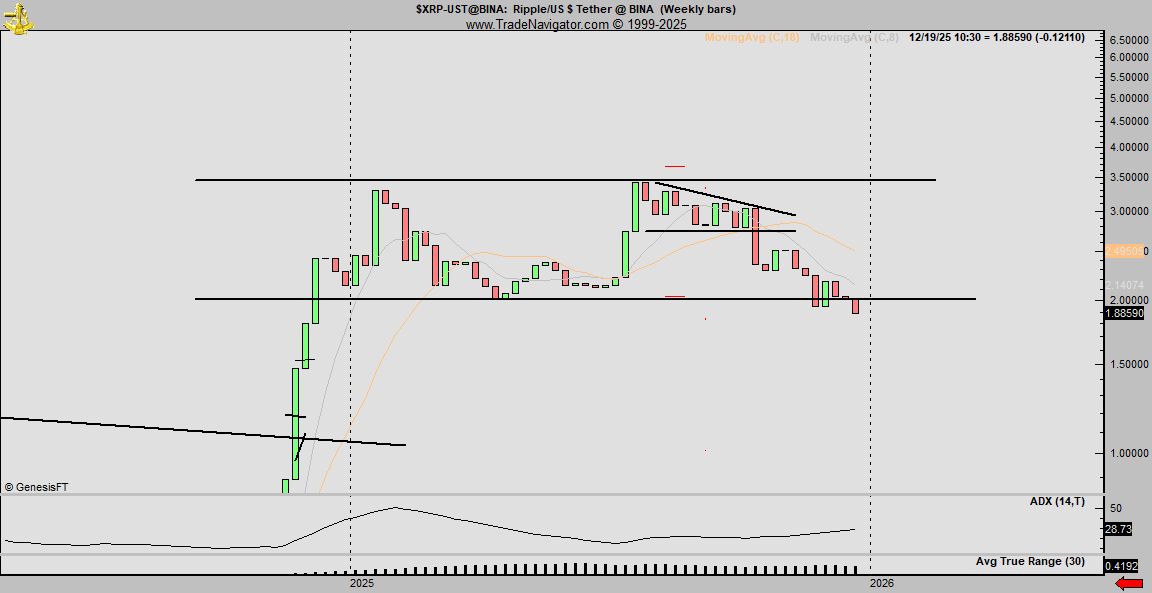
If the price remains below the neckline, the pair could initially plummet to $1.65, where the 100-week simple moving average (SMA) currently resides. Lower than that, the 200-week SMA around $1.07 provides the last line of defense for XRP.
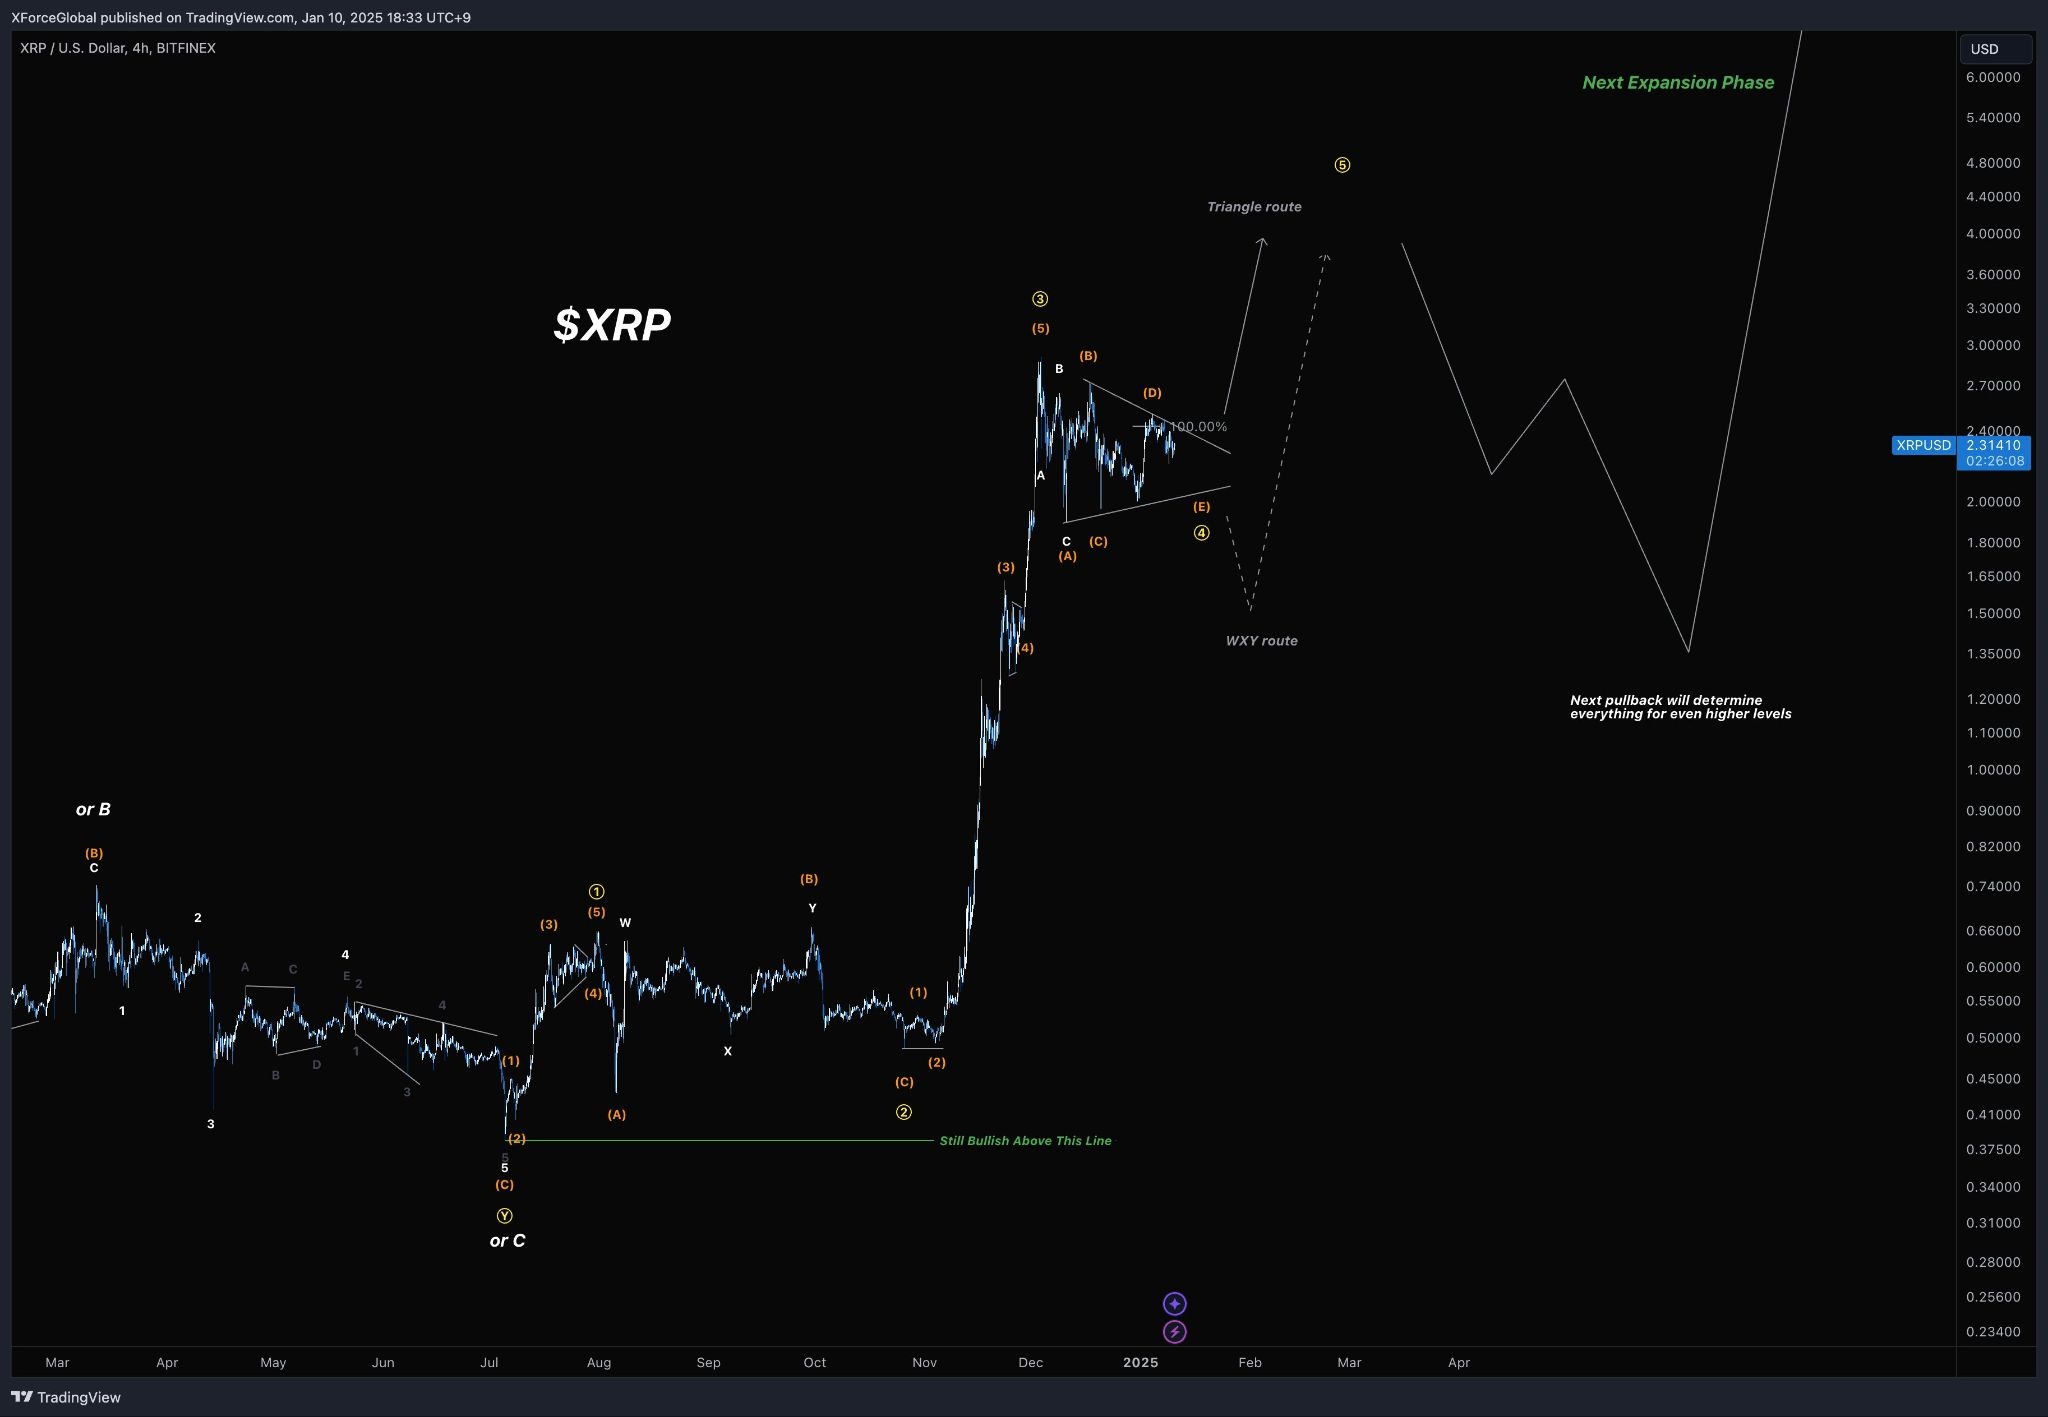
Analyst XForceGlobal attributed the bearish shift to a wave 3 corrective move, which is part of a “5-wave impulse after the triangle breakout,” as shown in the chart below.
According to the Elliott Wave analyst, XRP could drop toward the $1.20-$1.35 area, in a final pullback that will “determine everything needed for the next expansion phase,” the analyst added.
As Cointelegraph reported, the odds of the XRP/USDT pair plummeting to the Oct. 10 low of $1.25 increased once the XRP price turned down from the 20-day moving average around $2.
XRP’s 2018 fractal setup echoes $1 target
XRP’s current structure closely mirrors the setup that sparked its 2018 bear market breakdown.
The chart below suggests that the $2 region is behaving much like the last line of support XRP lost just before it plunged 70% seven years ago.
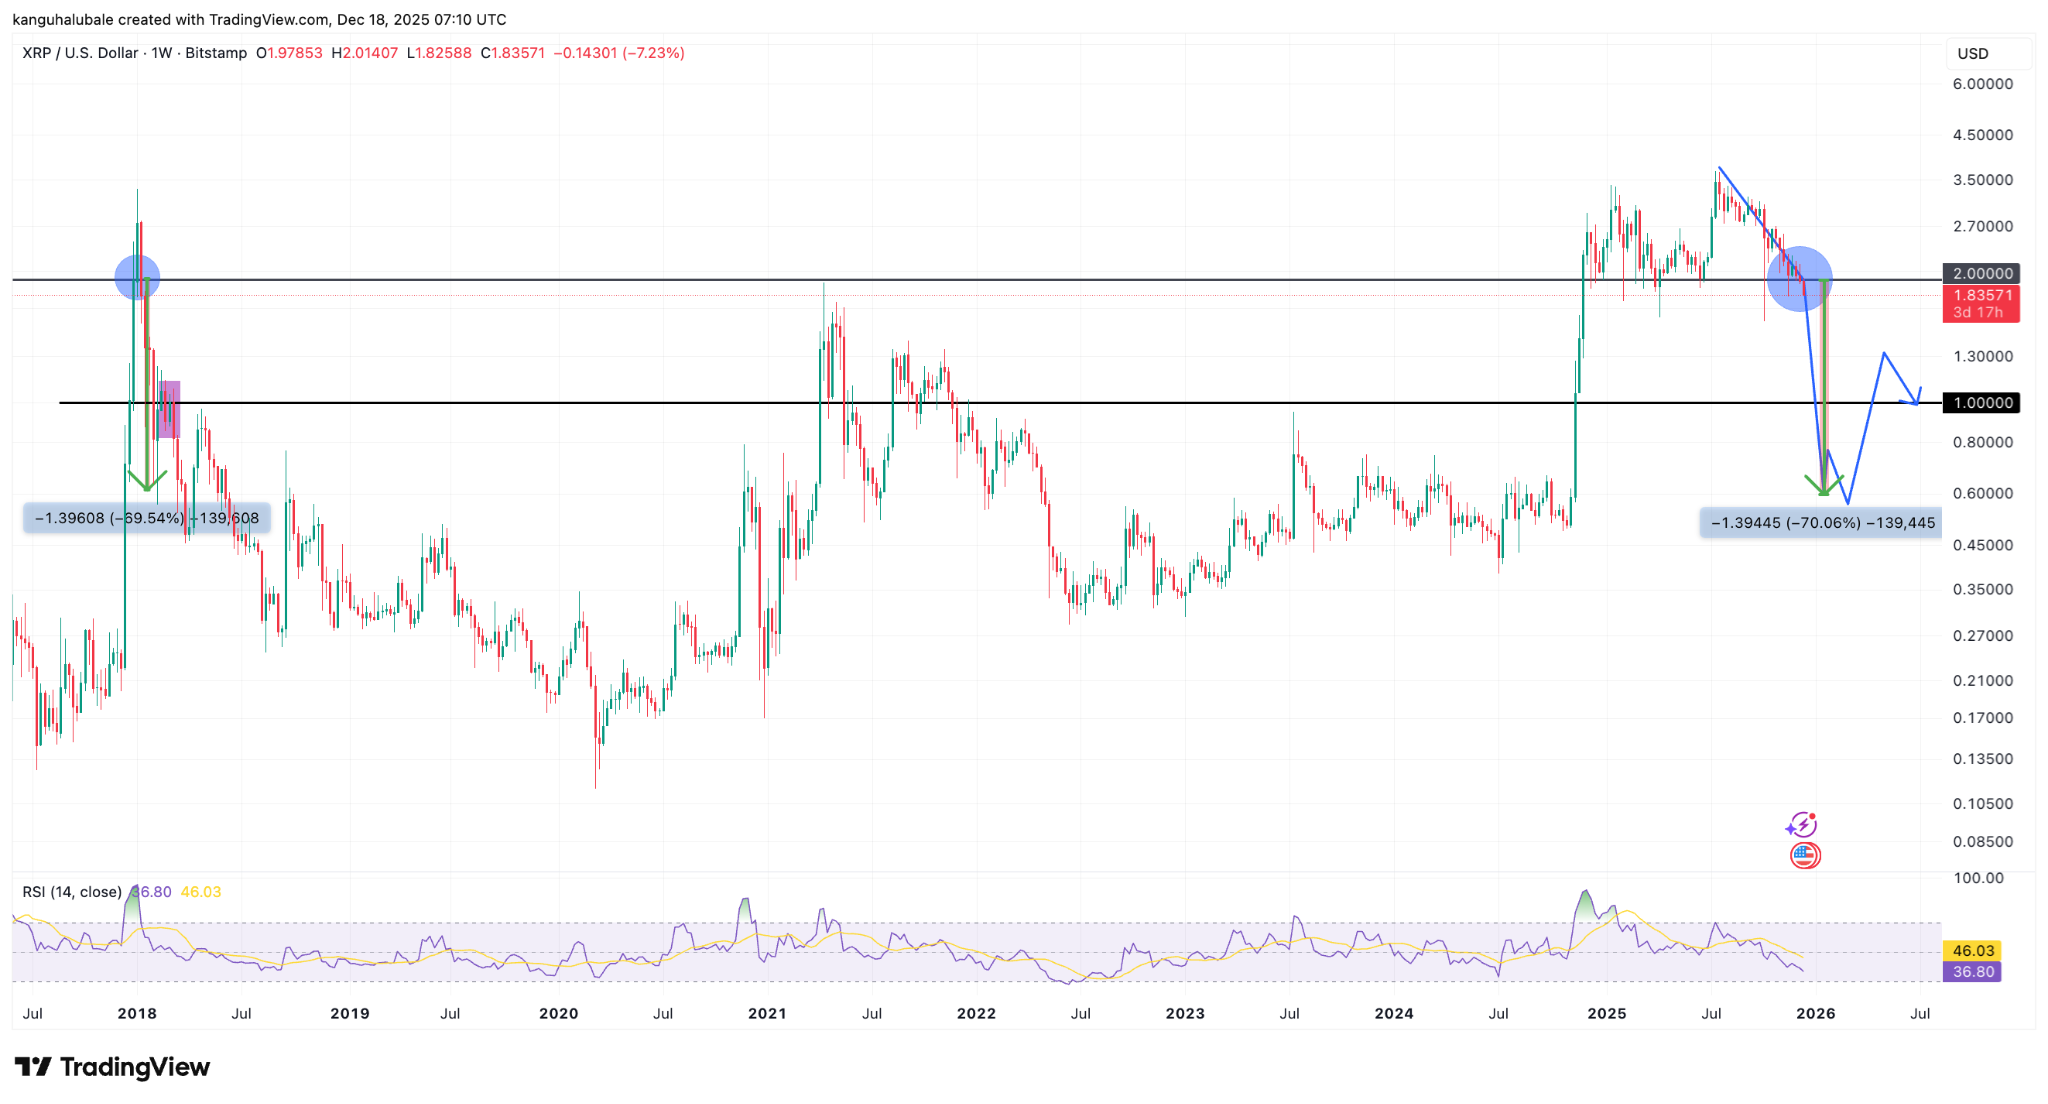
With prices struggling below $2 and sellers taking control, XRP has the potential to drop a further 70% toward $0.60, before recovering to stabilize around $1, echoing the pullback that followed a similar technical setup in 2018.
XRP is currently facing renewed downside pressure as weakening derivatives activity and onchain positioning threaten to send the XRP/USD pair to $1.
Not all hope is lost for XRP bulls
Despite the bearish sentiment, XRP still trades above a key support level, which the bulls must hold to prevent further downside.
Glassnode's UTXO realized price distribution (URPD) — a metric that shows the average prices at which SOL holders bought their coins — reveals that the next significant support sits at $1.78, where approximately 1.85 billion XRP were previously acquired.
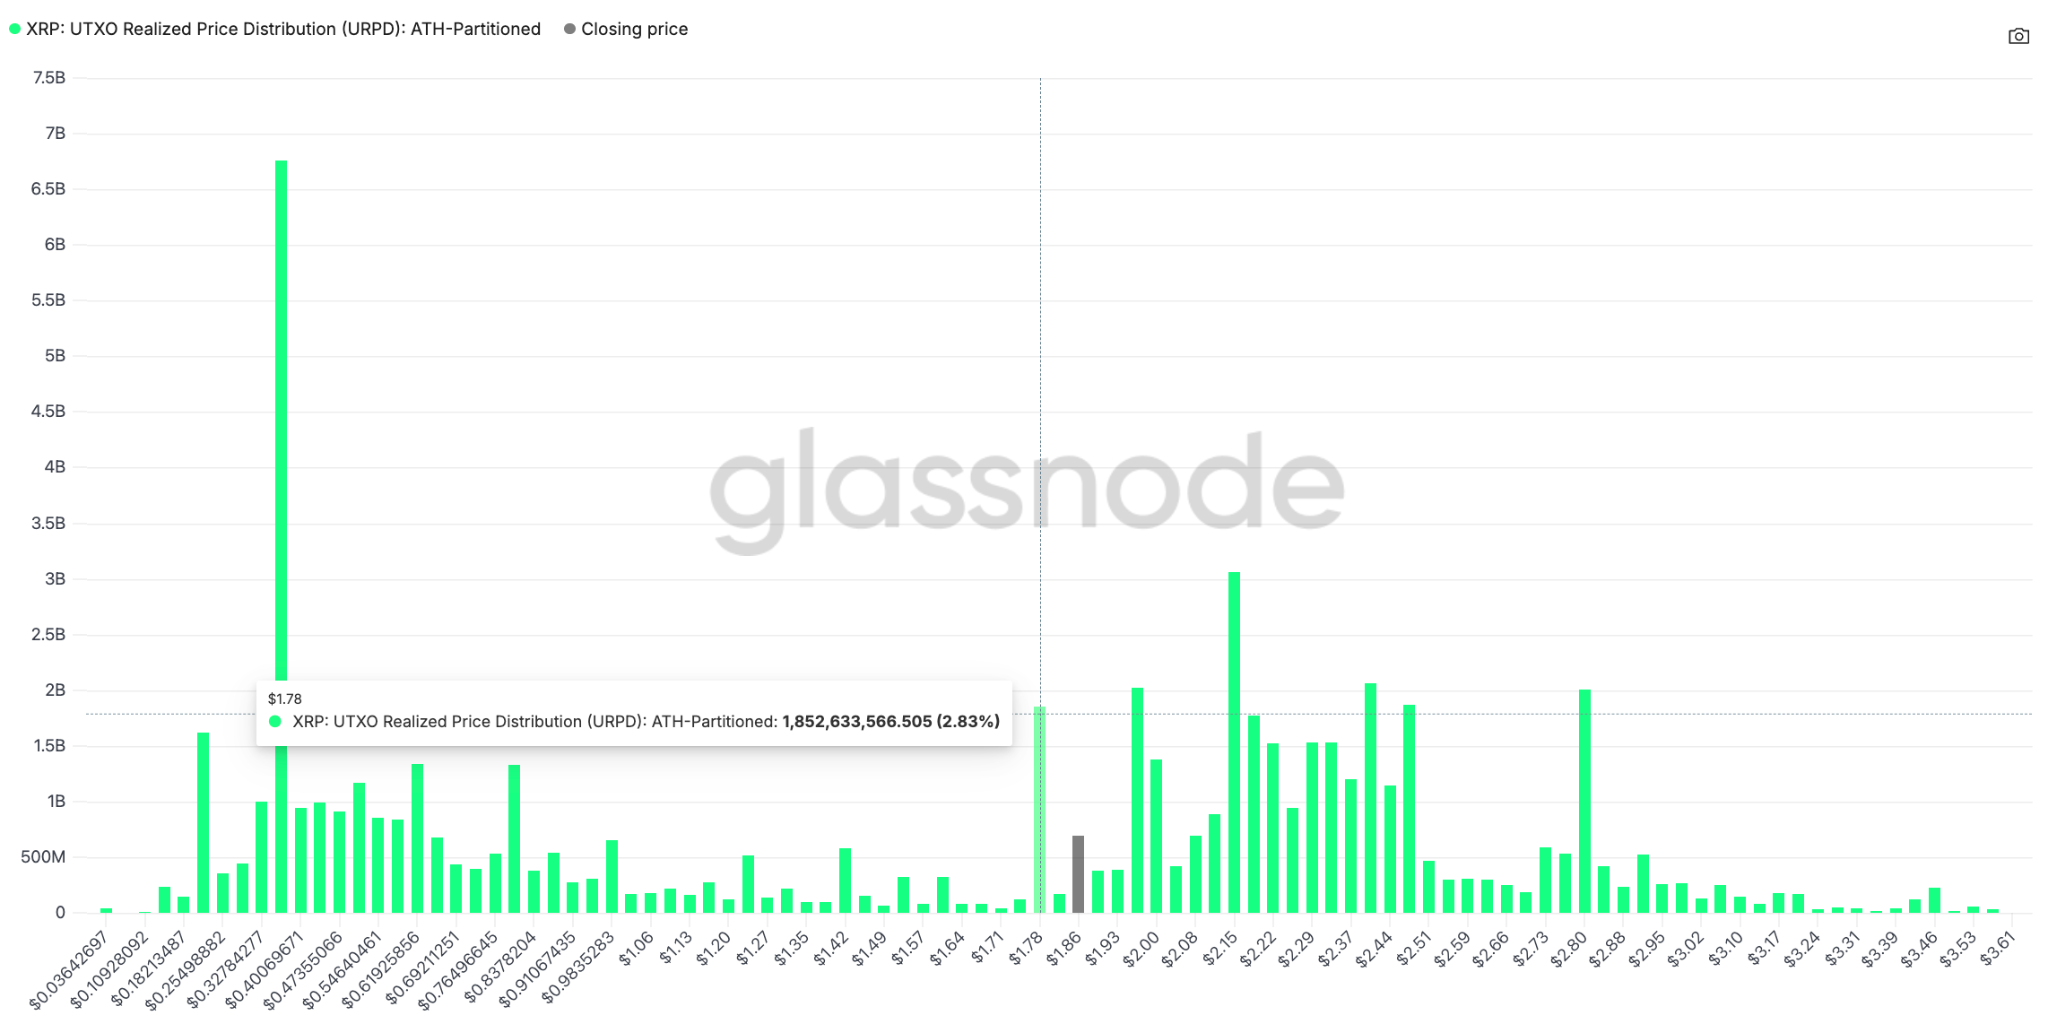
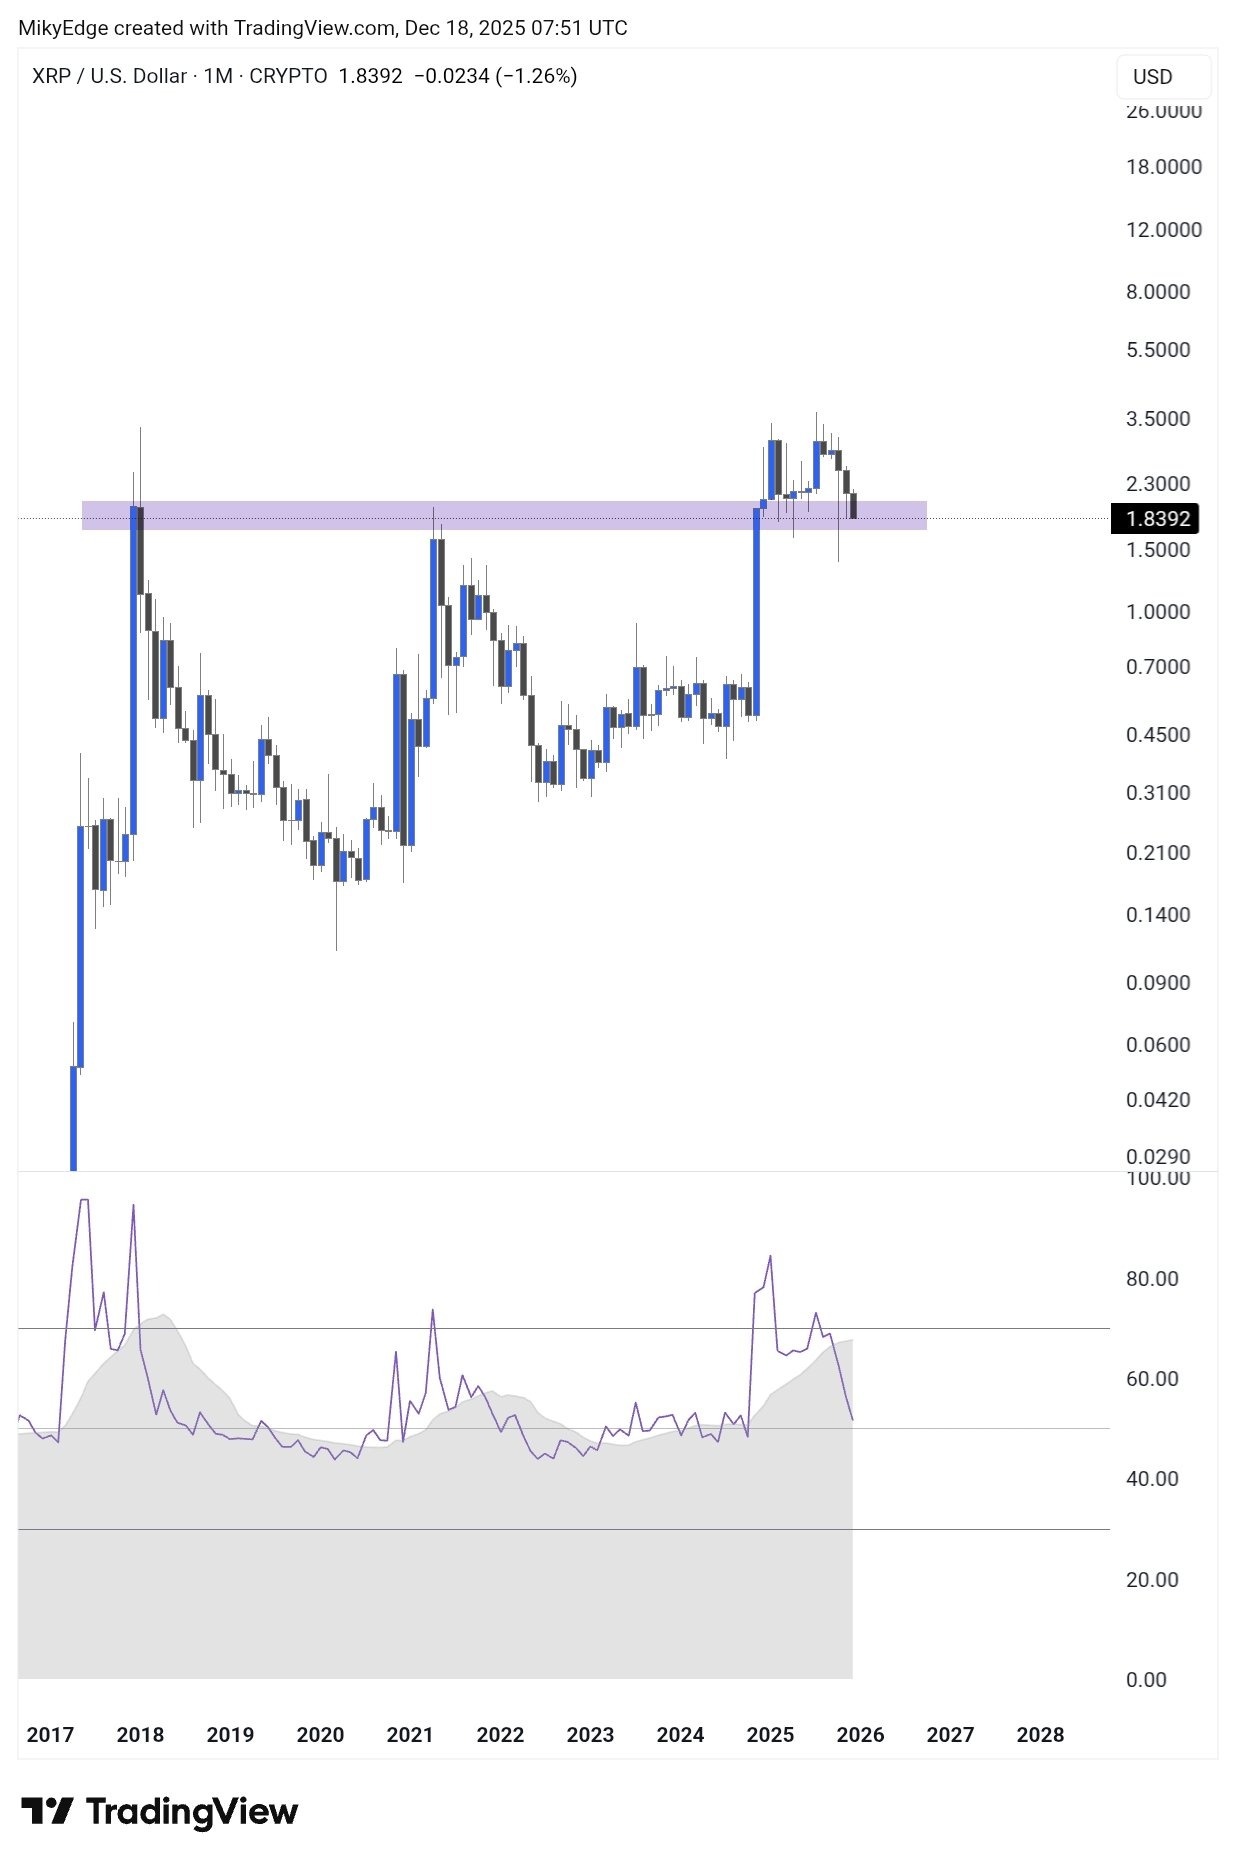
“XRP needs to hold this support line,” said Mikybull Crypto, referring to the $1.70-$1.80 demand zone in the monthly time frame.
“Otherwise, it’ll be carnage.”
This article does not contain investment advice or recommendations. Every investment and trading move involves risk, and readers should conduct their own research when making a decision. While we strive to provide accurate and timely information, Cointelegraph does not guarantee the accuracy, completeness, or reliability of any information in this article. This article may contain forward-looking statements that are subject to risks and uncertainties. Cointelegraph will not be liable for any loss or damage arising from your reliance on this information.