XRP at a Critical Juncture: Stagnating Before Strong Resistance - Will It Break Through or Plummet?

金色财经Published on 2025-12-12Last updated on 2025-12-12

Abstract

XRP price has initiated a fresh decline after falling below the $2.080 and $2.050 support levels. It is currently trading below $2.050 and the 100-hour Simple Moving Average, showing signs of weakness near the $2.040 resistance area. A descending trend line is forming with resistance near $2.040 on the hourly chart. Key support levels are identified at $2.00 and $1.9850. A break below $2.00 could lead to further declines toward $1.920 and possibly $1.880. On the upside, immediate resistance is near $2.040, followed by major hurdles at $2.080 and $2.150. A close above $2.080 might initiate a move toward $2.1850 and $2.220. Technical indicators show the hourly MACD is losing momentum in the bearish zone, while the RSI is above 50. The market remains at a critical juncture, with the potential for either an upward breakout or further downside movement.

Article Source: WeChat Official Account Miao Jie Trading Diary

XRP price started a new decline after breaking below $2.080. The current price action is weak, facing resistance near the $2.040 level.

  • XRP price started a new decline after breaking below the $2.050 zone.

  • The price is currently below $2.050 and the 100-hour Simple Moving Average.

  • A descending trend line is forming on the XRP/USD hourly chart with resistance near $2.040 (data source: Kraken).

  • The pair could extend its decline if it breaks below $2.00.

XRP Price Hovers Near Resistance

XRP price attempted a recovery wave above $2.150 but failed to continue higher, unlike Bitcoin and Ethereum. Subsequently, the price started a new decline, breaking below $2.080 and $2.050.

The price broke below the $2.00 support and formed a low near $1.993 before starting a recovery correction. There was a move above the 23.6% Fib retracement level of the downward move from the $2.177 high to the $1.993 low.

However, bears were active near $2.040 and $2.050. A descending trend line is also forming with resistance near $2.040 on the hourly chart of XRP/USD. The price is now below $2.050 and the 100-hour Simple Moving Average.

If there is another increase, the price might face resistance near $2.040. The first major resistance is near $2.080 or the 50% Fib retracement level of the downward move from the $2.177 high to the $1.993 low.

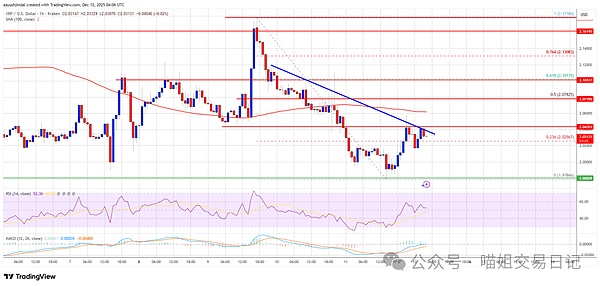
A close above $2.080 could push the price toward $2.012. The next resistance sits at $2.150. A clear move above the $2.150 resistance might send the price toward the $2.1850 resistance. Further gains could lead the price toward the $2.220 resistance. The next major resistance for the bulls could be near $2.250.

Another Decline?

If XRP fails to clear the $2.040 resistance, it could start another decline. Initial support on the downside is near $2.00. The next major support is near $1.9880.

If the price breaks below the $1.9880 level and closes below it, it could continue to move down toward $1.920. The next major support is near $1.880, below which the price might test $1.820.

Technical Indicators

Hourly MACD – The MACD for XRP/USD is now losing pace in the bearish zone.

Hourly RSI (Relative Strength Index) – The RSI for XRP/USD is now above the 50 level.

Major Support Levels – $2.00 and $1.9850.

Major Resistance Levels – $2.040 and $2.080.

Trending Cryptos

Related Questions

QWhat is the current resistance level that XRP is struggling to break above?

AXRP is currently facing resistance near the $2.040 level, where a descending trend line is forming on the hourly chart.

QWhat key support level could trigger another decline if broken?

AA break below the $2.00 support level could trigger another decline, with the next major support located near $1.9850.

QWhat was the high point from which the recent decline to $1.993 began?

AThe recent decline began from a high of $2.177 before dropping to the $1.993 low.

QWhat are the two major technical indicators mentioned and what are their current signals?

AThe hourly MACD is accelerating in the bearish zone, while the hourly RSI is currently above the 50 level.

QWhat price must XRP close above to start a potential rally towards $2.120?

AA close above the $2.080 resistance level is needed for XRP to start a potential rally towards $2.120 and higher.

Related Reads

Trading

Spot

Hot Articles

What is NES

I. Project IntroductionNesa is the largest decentralized AI platform and ecosystem backed by a privacy-first AI Layer 1. Its proprietary encrypted inference technology supports a broad range of workloads and serves Fortune 500 enterprise customers in industries like retail, healthcare, and IT.II. Token InformationToken name: NES(Nesa)III. Related LinksWebsite:https://nesa.ai/Explorers:https://bscscan.com/address/0x3131f6B80C26936aB03F7d9D29Eb4Ddf36AC3FB5Twitter:https://x.com/nesaorgNote: The project introduction comes from the materials published or provided by the official project team, which is for reference only and does not constitute investment advice. HTX does not take responsibility for any resulting direct or indirect losses.

431 Total ViewsPublished 2026.06.24Updated 2026.06.24

What is NES

How to Buy NES

Welcome to HTX.com! We've made purchasing Nesa (NES) simple and convenient. Follow our step-by-step guide to embark on your crypto journey.Step 1: Create Your HTX AccountUse your email or phone number to sign up for a free account on HTX. Experience a hassle-free registration journey and unlock all features.Get My AccountStep 2: Go to Buy Crypto and Choose Your Payment MethodCredit/Debit Card: Use your Visa or Mastercard to buy Nesa (NES) instantly.Balance: Use funds from your HTX account balance to trade seamlessly.Third Parties: We've added popular payment methods such as Google Pay and Apple Pay to enhance convenience.P2P: Trade directly with other users on HTX.Over-the-Counter (OTC): We offer tailor-made services and competitive exchange rates for traders.Step 3: Store Your Nesa (NES)After purchasing your Nesa (NES), store it in your HTX account. Alternatively, you can send it elsewhere via blockchain transfer or use it to trade other cryptocurrencies.Step 4: Trade Nesa (NES)Easily trade Nesa (NES) on HTX's spot market. Simply access your account, select your trading pair, execute your trades, and monitor in real-time. We offer a user-friendly experience for both beginners and seasoned traders.

281 Total ViewsPublished 2026.06.24Updated 2026.06.24

How to Buy NES

Discussions

Welcome to the HTX Community. Here, you can stay informed about the latest platform developments and gain access to professional market insights. Users' opinions on the price of A (A) are presented below.

活动图片