What to expect from XRP’s price in July 2026?

ambcryptoPublished on 2026-06-30Last updated on 2026-06-30

Abstract

Ripple's XRP price fell to $1.009 on June 26, 2026, nearing the key $1 psychological level for the first time since November 2024. Despite positive spot ETF inflows, weak broader market demand and low speculative interest paint a gloomy outlook. Technical analysis shows XRP in a persistent downtrend since July 2025, with the recent breach of the $1.05 support level. While Open Interest data indicates a calmer derivatives market, the price structure remains bearish. The bounce to $1.29 in mid-June was quickly sold, and the path of least resistance points south. A drop below $1 in July appears highly likely, with bearish momentum potentially driving prices toward the $0.975 and $0.85 targets.

On Friday, June 26, Ripple [XRP] prices fell to $1.009, the closest brush of the psychological $1 level since November 2024. Despite the market weakness, XRP spot ETF inflows remained positive.

AMBCrypto reported that this spot ETF demand was tightening the available XRP supply, though it might not result in immediate positive gains in these stressed market conditions.

The lack of broader market XRP demand and reduced speculative interest in recent months pointed to a gloomy outlook.

Can the XRP bulls defend $1 from subsequent sell-offs?
Source: XRP/USDT on TradingView

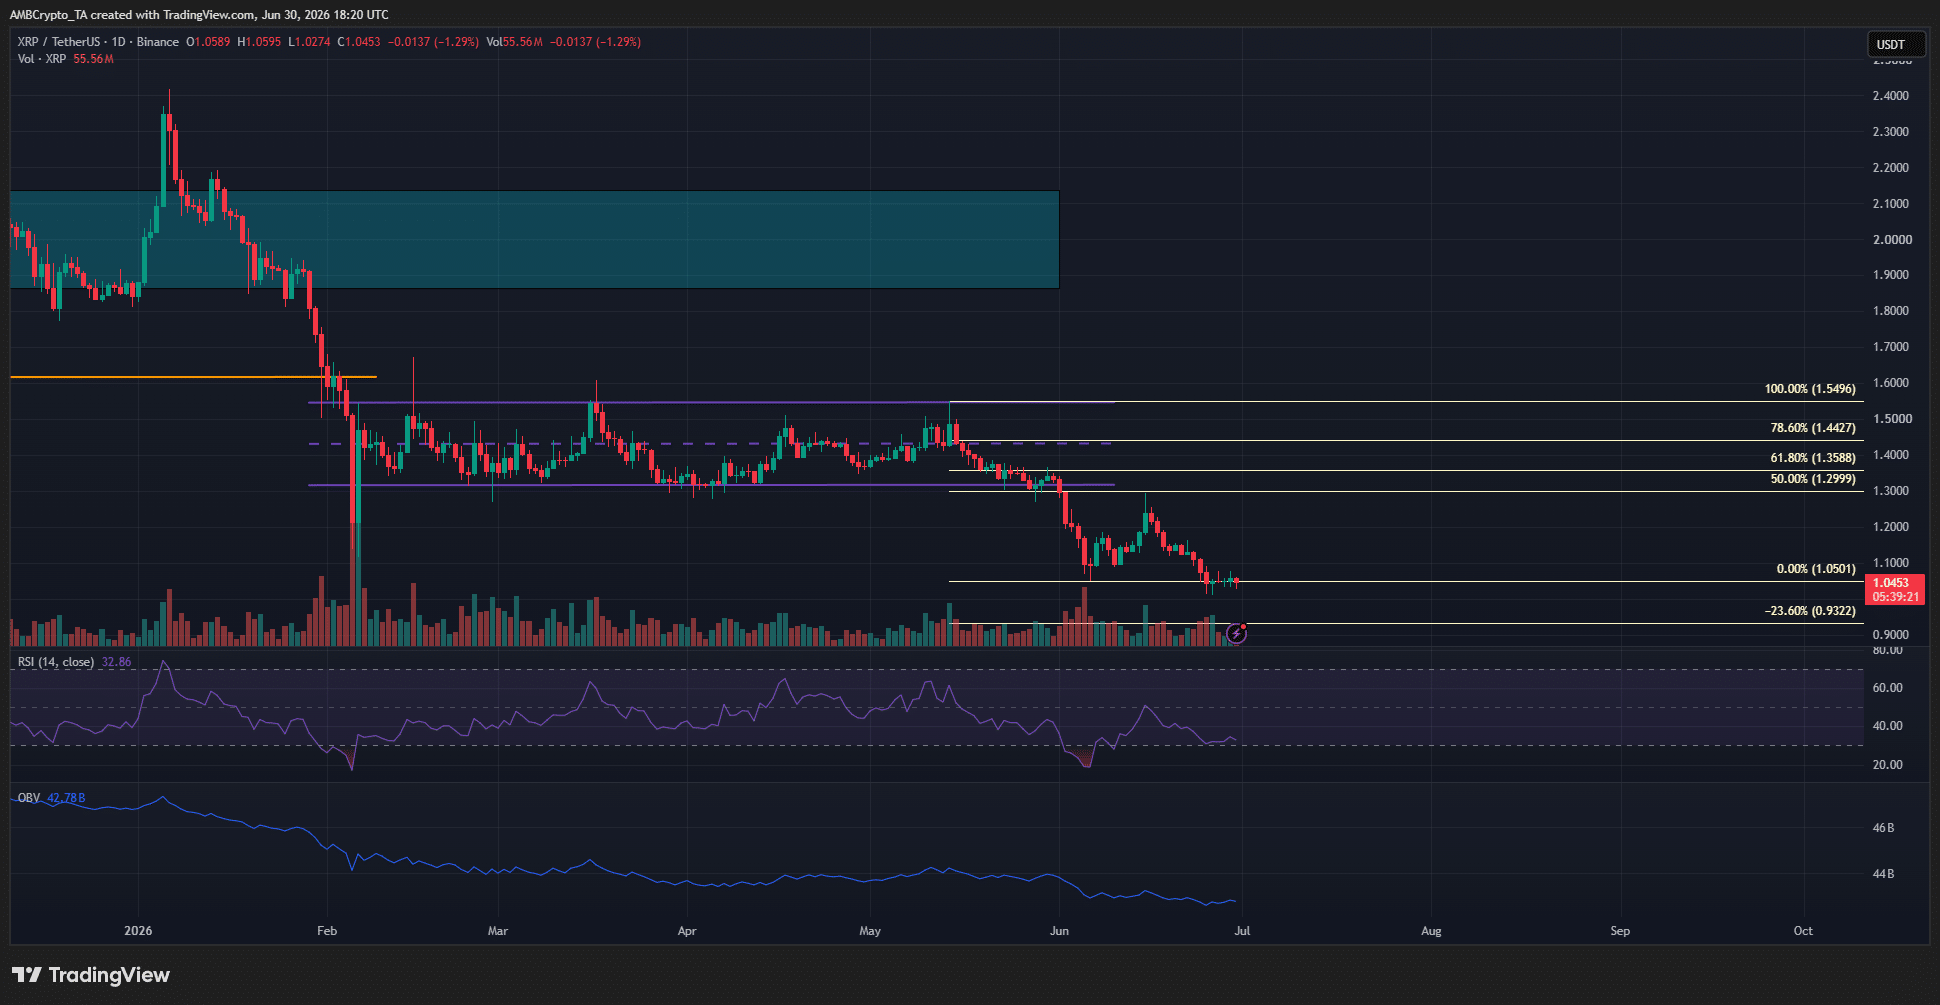
The 1-day XRP chart highlighted an altcoin trading within a long-term downtrend. The persistent downtrend stretches back to July 2025. In February earlier this year, the swing low at $1.61 from April 2025 was breached, confirming a bearish trend.

For a few months, a range formation [purple] was in place, but the sell-off towards the end of May was too hot for the bulls to handle. At the time of writing, after a brief bounce toward $1.3, XRP was chopping about the $1.05 local lows.

The XRP price expectations for July
Source: CryptoQuant

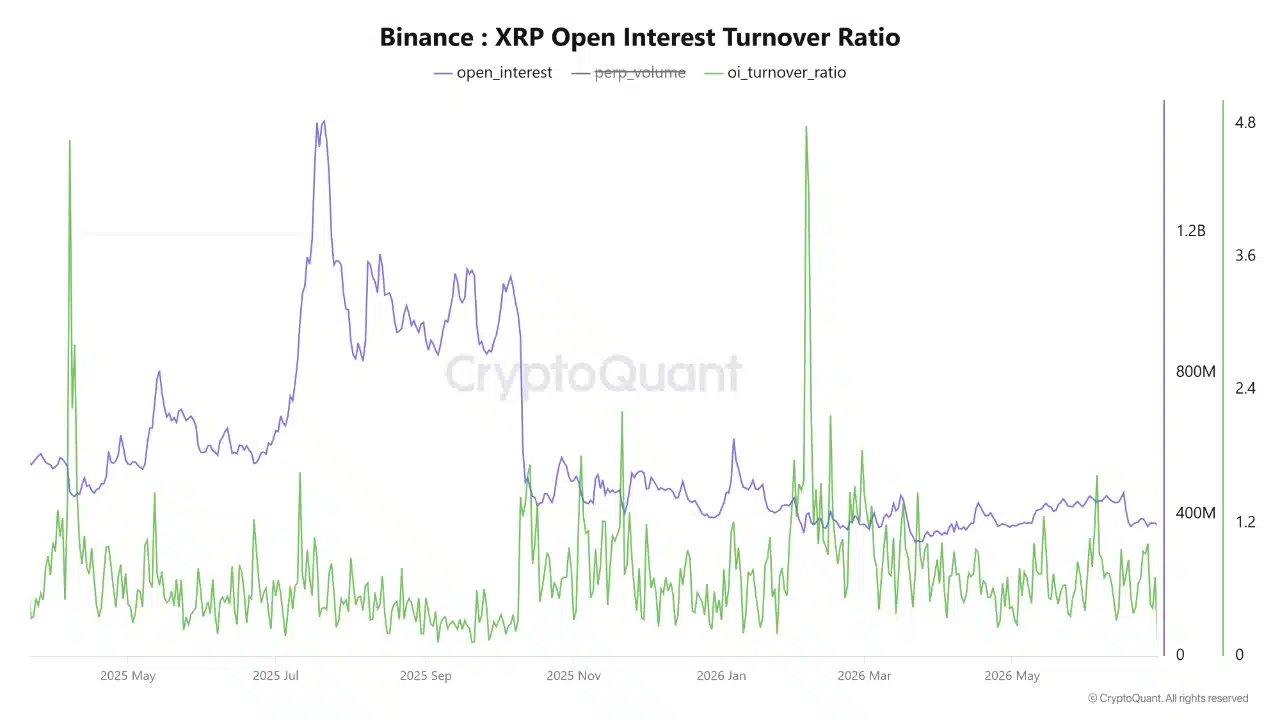
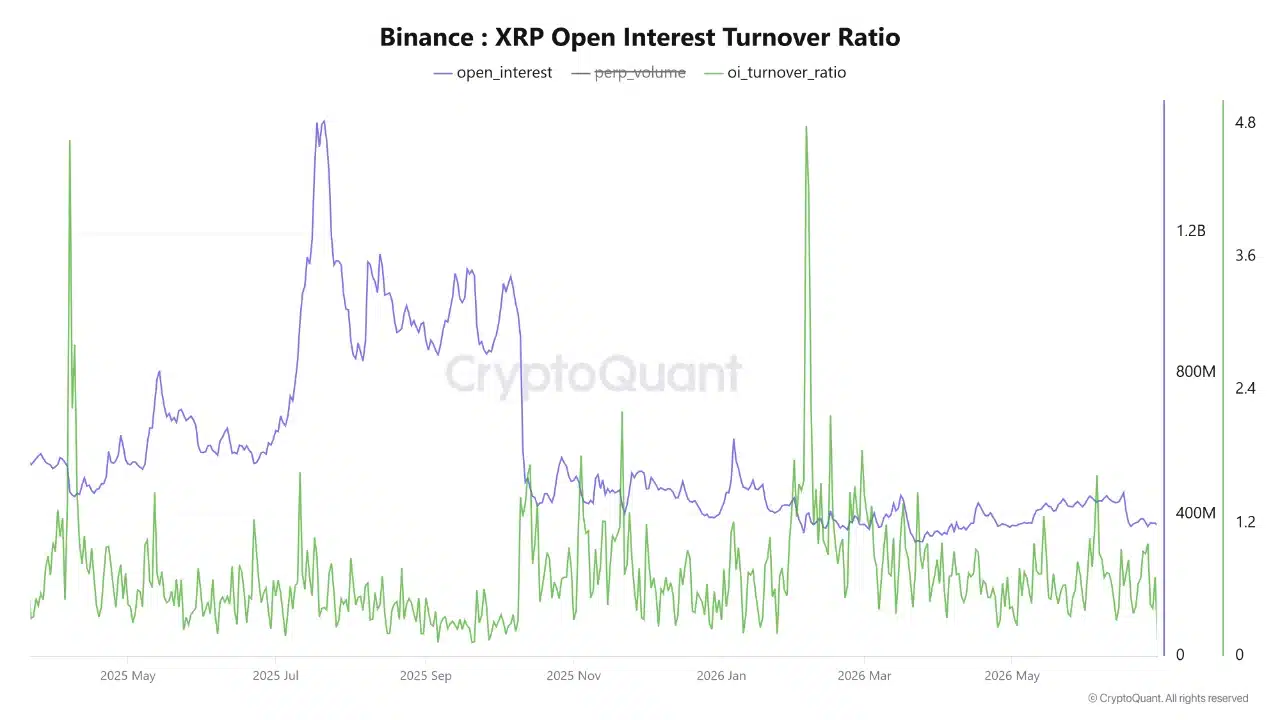
The Open Interest has stabilized around 400 million XRP in recent months. The Open Interest Turnover Ratio was also holding stable near 0.71. The lack of wild spikes in either metric meant that the speculative market was calmer and more stable.

The derivatives traders were not too eager to place directional bets, and short-term speculation has slowed down. Analyst Arab Chain wrote that traders can use a spike in OI and the turnover ratio as an early warning of increased volatility.
Source: XRP/USDT on TradingView

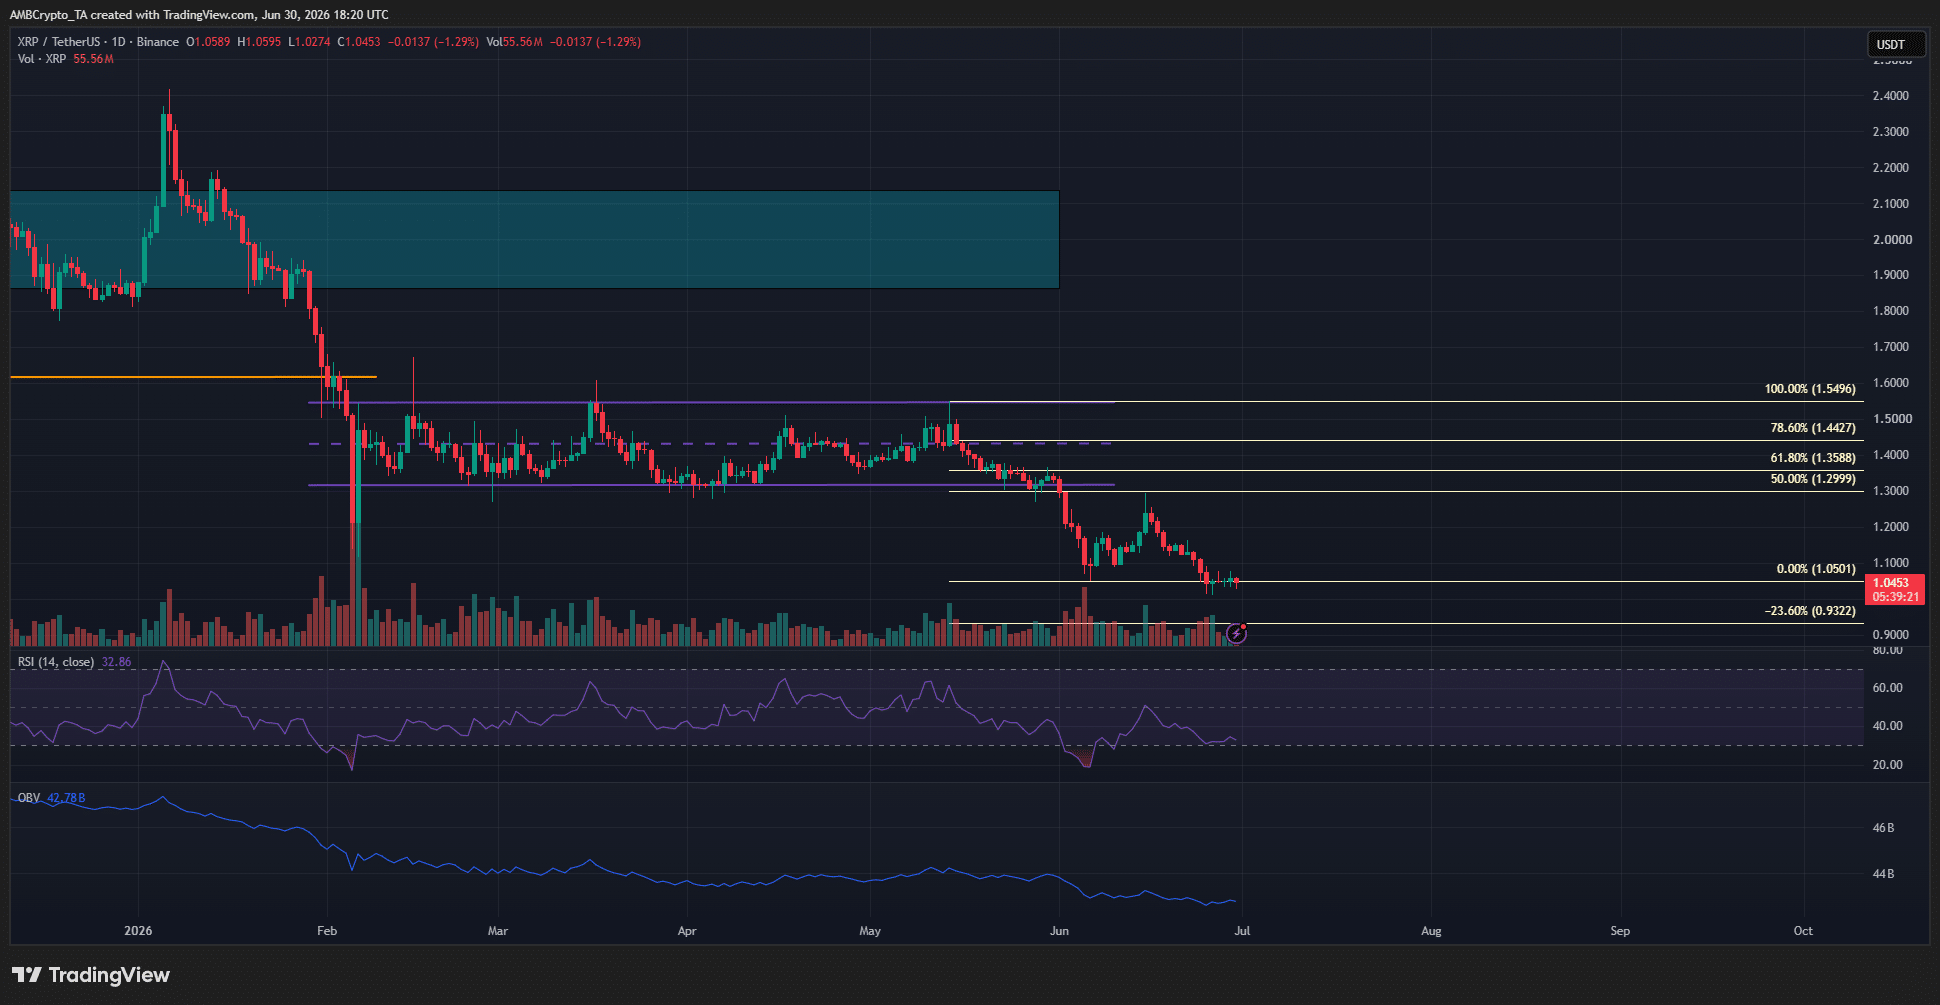
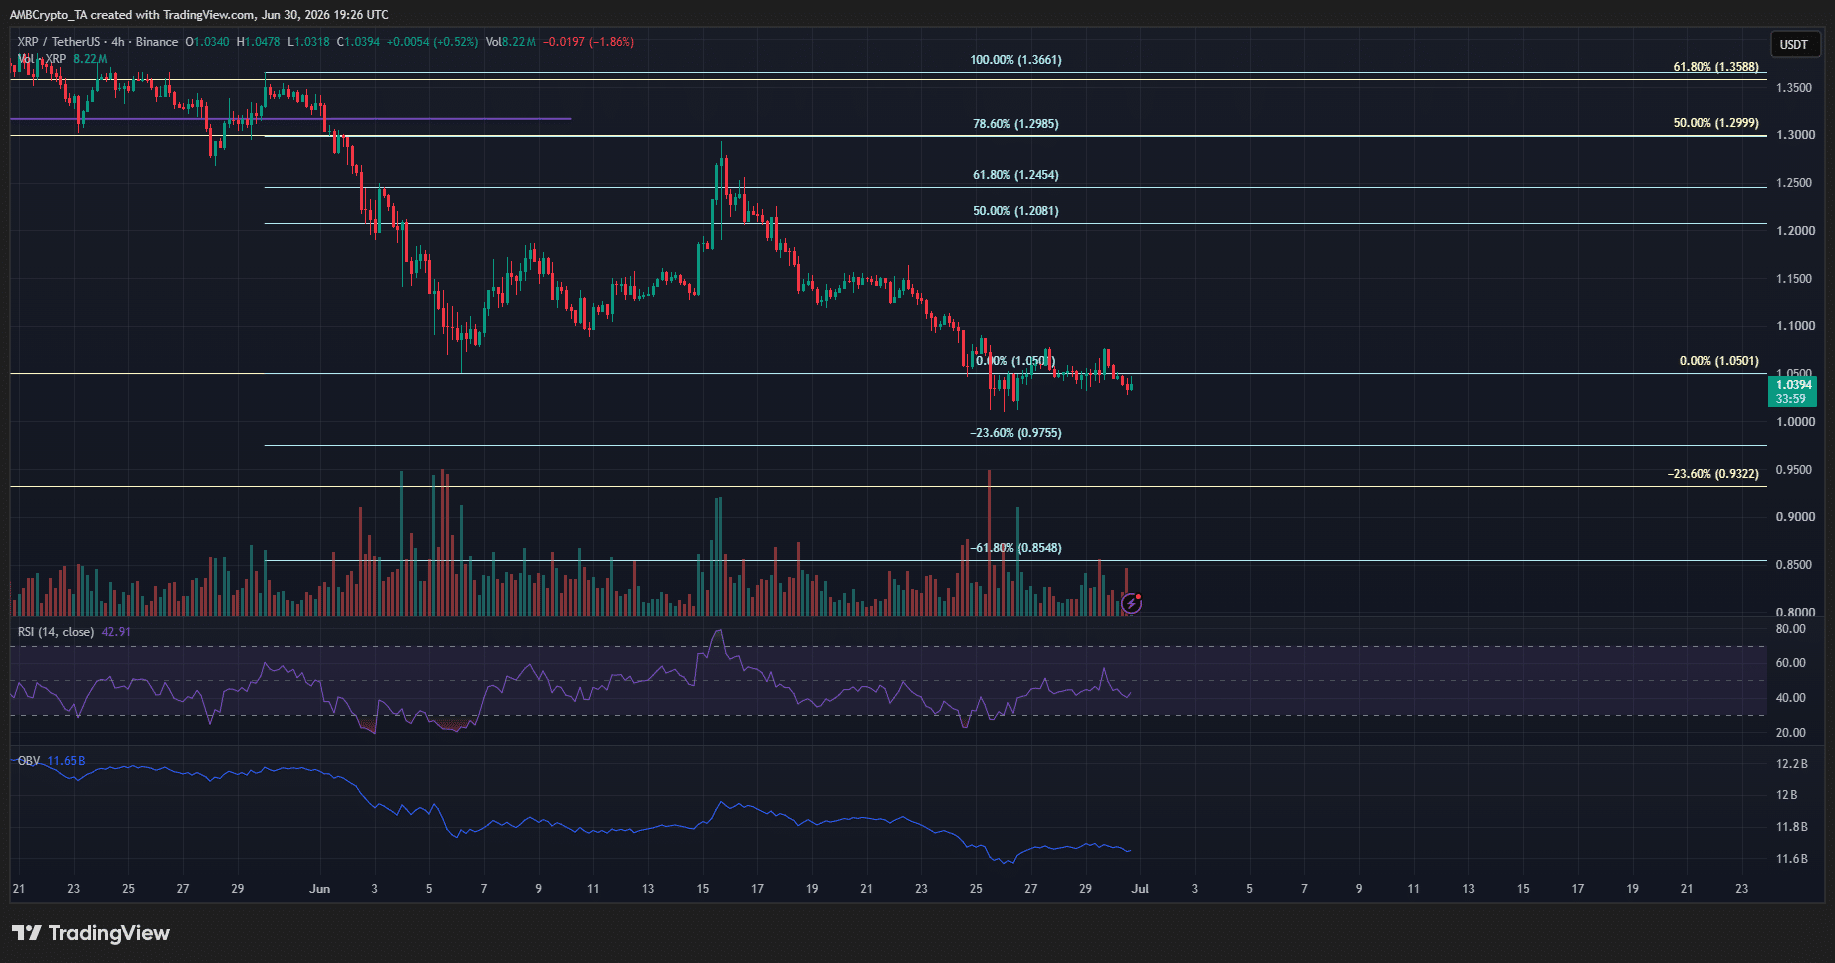
The 4-hour chart showed XRP was trading within a downtrend. The bounce to $1.2935 in mid-June was only a pullback toward the 78.6% Fibonacci retracement level at $1.2985.

This bounce was quickly sold off, and XRP was about to extend its bearish leg toward the southward extension targets at $0.975 and $0.854.

Therefore, as July progresses, a Ripple token price drop below $1 appeared highly likely.


Final Summary

  • The speculative activity has dried up and the derivatives market was calmer, but traders need to be wary of changing conditions and heightened volatility.
  • Based on the evidence at hand, the bearish XRP momentum and structure would likely see prices fall toward $0.85 in July.


Trending Cryptos

Related Questions

QAccording to the article, what key price level did XRP approach on June 26, 2026?

AOn June 26, 2026, XRP prices fell to $1.009, which was the closest it had come to the psychological $1 level since November 2024.

QWhat was the state of the speculative market for XRP in the months leading up to July 2026, according to the derivatives data?

AThe speculative market was calmer and more stable. Open Interest had stabilized around 400 million XRP and the Open Interest Turnover Ratio was holding near 0.71, with a lack of wild spikes indicating reduced short-term speculation and directional bets.

QBased on the technical analysis in the article, what are the two southward extension targets for XRP's price mentioned?

AThe two southward extension targets mentioned are $0.975 and $0.854.

QWhat does analyst Arab Chain suggest traders can use as an early warning of increased volatility?

AAnalyst Arab Chain suggests that traders can use a spike in Open Interest (OI) and the Open Interest Turnover Ratio as an early warning of increased volatility.

QWhat is the overall price expectation for XRP in July 2026 as summarized at the end of the article?

AThe article's final summary states that, based on the evidence, the bearish momentum and structure would likely see XRP prices fall toward $0.85 in July 2026.

Related Reads

Didier Zheng Answers: Will MicroStrategy Enter a Death Spiral? How Will the Macro Trend Unfold in the Second Half of the Year?

In the latest WuShuo Uncensored podcast, investor Didier Zheng analyzes recent market trends. He argues that Bitcoin's recent decline is primarily driven by market anticipation of MicroStrategy potentially selling small amounts of Bitcoin regularly to cover cash flow for its growing priority shares and debt, rather than macro factors or ETF outflows alone. This creates a new dynamic of expected continuous selling pressure. Didier views Token as the new form of labor in the AI era, replacing human roles in execution and driving the ongoing rally in U.S. stocks within the AI supply chain (semiconductors, data centers). This shift is seen as a long-term structural change, boosting corporate profitability. He notes that crypto exchanges are naturally expanding into U.S. stocks and real-world assets due to the scarcity of valuable native crypto assets beyond Bitcoin and major protocols. For traders, the transition may not require a drastic change in strategy, as similar speculative and fundamental assets exist in both markets. The analyst believes the native crypto altcoin rally is likely over, severely damaged by the liquidity destruction from the "1011" crash event. Liquidity has migrated to deeper markets like U.S. equities. For the macro outlook, Didier expresses increased caution for H2 2024 due to potential market pressure from mega-IPOs (e.g., SpaceX) and the U.S. midterm elections. A Democratic sweep could bring stricter regulation for Web3 and AI. Long-term, he remains optimistic about the convergence of AI and blockchain, enabling a more automated, machine-driven economy, but expects a shift towards a more mature, institutional phase for the crypto industry.

marsbit20m ago

Didier Zheng Answers: Will MicroStrategy Enter a Death Spiral? How Will the Macro Trend Unfold in the Second Half of the Year?

marsbit20m ago

Bitcoin's Historically Rare Pattern: When August Rises, September Always Pulls Back, Followed by an Average 44% Surge in October

Historical Seasonal Pattern for Bitcoin Resurfaces: Strong August (Up 25% YTD) Points to Potential September Dip, Followed by October Rally Bitcoin is on track for its strongest August performance since 2017, with gains of approximately 25% for the month as of late August, trading between $78K-$79K. This has revived discussion of a historical seasonal pattern observed since 2013. Data shows that in the four previous years where Bitcoin posted a positive return in August (2013, 2017, 2020, 2021), the following September consistently closed in negative territory, with an average decline of about -5.9%. Notably, a positive September has never followed a positive August in Bitcoin's history. However, the pattern shows a potential silver lining. Following each instance of a "Green August" followed by a "Red September," the subsequent month of October has historically seen significant rallies. The average gain for October after such a sequence is approximately +44%. While this pattern highlights a recurring seasonal trend, analysts caution that it is based on a limited sample size of only four occurrences. Each period had distinct macroeconomic and market conditions. Therefore, past performance is not a reliable indicator of future results, and whether 2026 will follow this sequence remains to be seen as September trading begins.

marsbit20m ago

Bitcoin's Historically Rare Pattern: When August Rises, September Always Pulls Back, Followed by an Average 44% Surge in October

marsbit20m ago

Strive CEO: US Bond Market Approaching a Critical Point, Bitcoin's "Home Run Moment" Taking Shape

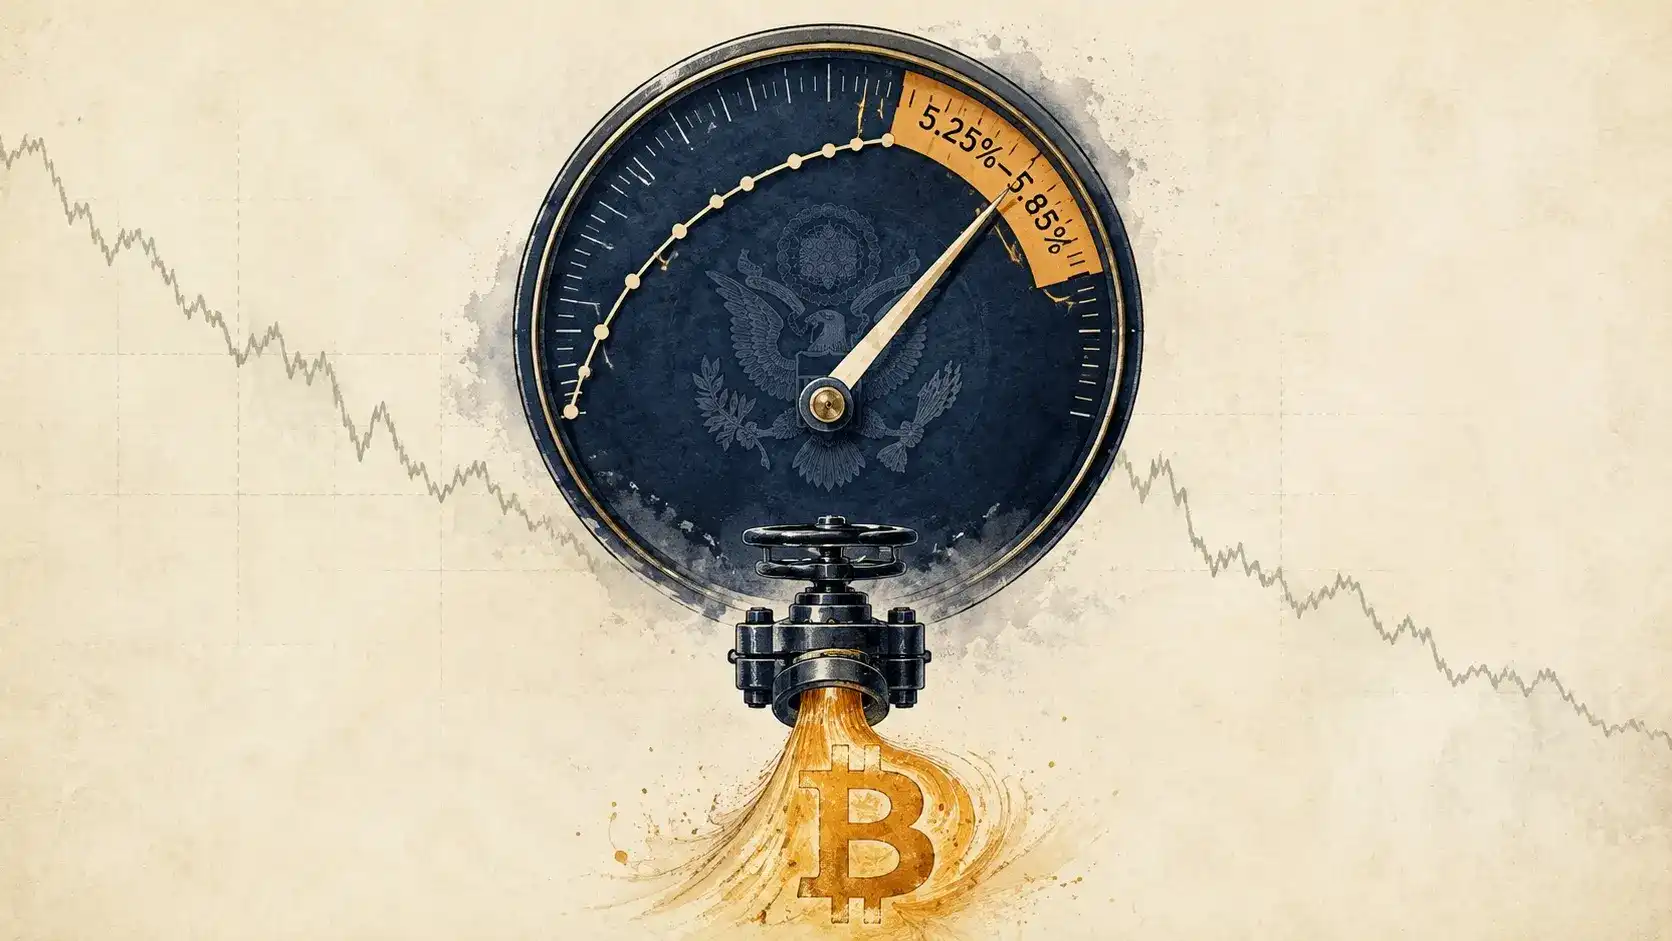
The CEO of Strive argues that the U.S. Treasury market is approaching a critical juncture, setting the stage for a major opportunity in Bitcoin. He highlights that unsustainable U.S. fiscal deficits and expanding entitlement programs are creating fundamental pressure for higher long-term bond yields. However, the political system is unwilling to enact necessary fiscal discipline. Consequently, as the 10-year Treasury yield enters a key resistance zone of 5.25%–5.85%, the narrative will shift to a potential bond market crisis. This will force policymakers (the Treasury or Federal Reserve) to intervene aggressively to suppress yields through tools like large-scale bond buybacks or balance sheet expansion. Since the underlying fiscal imbalance remains unresolved, the adjustment pressure will be transferred to the U.S. dollar, making it the "pressure release valve" of the system. A trend decline in the dollar, potentially to multi-decade lows, would create a historically unique macro environment for Bitcoin. Bitcoin stands to benefit as a scarce, non-sovereign monetary asset, especially as AI erodes the scarcity of traditional corporate moats. The author concludes that if bond market stress causes a Bitcoin dip, it would be a major buying opportunity; if not, having exposure is still crucial. The overall expectation is that the market is still underestimating Bitcoin's long-term upside potential in this unfolding macro shift.

marsbit29m ago

Strive CEO: US Bond Market Approaching a Critical Point, Bitcoin's "Home Run Moment" Taking Shape

marsbit29m ago

Trading

Spot

Hot Articles

Discussions

Welcome to the HTX Community. Here, you can stay informed about the latest platform developments and gain access to professional market insights. Users' opinions on the price of S (S) are presented below.

活动图片