VIRTUAL explodes 86%, then stalls – Traders, watch THIS closely

ambcryptoPublished on 2026-01-13Last updated on 2026-01-13

Abstract

VIRTUAL token surged 86% in early January, climbing from $0.642 to $1.198, but momentum has since weakened, with the price dropping to $0.975. A daily close below $1 could signal short-term bearish pressure. Analysts compare the breakout to a April 2025 pattern that led to a rally toward $2.5, but sustainability remains uncertain. Key support lies at the 50% retracement level of $0.918—holding it may lead to further gains. However, spikes in dormant circulation and age consumed metrics suggest possible profit-taking and limited upward movement without renewed demand. Traders are advised to watch the $0.73–$0.76 zone as a potential long entry if a deeper pullback occurs.

VIRTUAL token rallied 86% within the first week of January, rising from $0.642 to $1.198. After this remarkable frenzy of buying, the altcoin saw subdued demand and momentum.

At the time of writing, it was trading at $0.975. A daily session close below the $1 mark would not be a good sign for the bulls in the short term.

Crypto investor Gem Insider noted in a post on X that the recent breakout had similarities to the one from April 2025. Back then, a breach of a descending trendline saw a rally that reached $2.5.

Will the current breakout achieve similar results?

VIRTUAL bulls’ defense of $1 could dictate the next move

The Virtuals Protocol [VIRTUAL] token saw a bullish start to the year, like many other altcoins. CoinMarketCap data showed that the AI sector expanded by over 20% in the first week of the month.

VIRUTAL was not the only token whose performance exceeded expectations.

Can it maintain the move?

The 50% retracement level of the impulse move would be the first test. If $0.918 is defended from the sellers, more upside and new highs would be highly likely.

The MACD and CMF showed upward momentum and strong capital inflows at the time of writing, an encouraging sight for investors.

The potential for a deeper VIRTUAL pullback

Santiment data showed that there were spikes in the dormant circulation and age consumed metrics. There were two notable spikes in the past two weeks, on the 30th of December and the latest on the 8th of January.

The former indicated a potential capitulation as the price sank toward new multi-month lows. The sudden turnaround to start the new year prompted a wave of profit-taking once the momentum began to slow down.

Therefore, it appeared likely that further price expansion upward might face some difficulties, unless there is another wave of demand and a sentiment shift from investors.

Traders’ call to action- Stick to the structure

The recent VIRTUAL rally left behind some imbalances on the 1-day timeframe. One of them aligned with the 78.6% Fibonacci retracement level, marking it as a strong demand zone.

Hence, swing traders can wait for a price drop to $0.73-$0.76 to look to go long. The 1-day swing structure was bullish after the $1 supply zone was overcome earlier this month.


Final Thoughts

  • The Virtuals Protocol bulls might fail to defend the $1 psychological level if demand slows down.
  • A daily session close below $1 would likely see prices dip to $0.73-$0.76, which could mark the end of the retracement.

Disclaimer: The information presented does not constitute financial, investment, trading, or other types of advice and is solely the writer’s opinion.


Trending Cryptos

Related Questions

QWhat was the percentage increase of VIRTUAL token in the first week of January, and what were its price points?

AVIRTUAL token rallied 86% in the first week of January, rising from $0.642 to $1.198.

QAccording to the article, what key price level must the bulls defend to maintain a positive short-term outlook?

AThe bulls must defend the $1 psychological level; a daily close below it would not be a good sign.

QWhich technical indicator and on-chain metric were cited as showing positive momentum for VIRTUAL at the time of writing?

AThe MACD showed upward momentum and the Chaikin Money Flow (CMF) indicated strong capital inflows.

QWhat specific price zone does the article identify as a potential long entry point for swing traders?

ASwing traders can look to go long in the price zone of $0.73 to $0.76, which aligns with a strong demand area and the 78.6% Fibonacci retracement level.

QWhat on-chain metrics from Santiment suggested potential selling pressure or profit-taking event?

ASpikes in the dormant circulation and age consumed metrics, particularly on December 30th and January 8th, indicated potential selling pressure or profit-taking event.

Related Reads

Stocks of Companies in Bitcoin Mining and AI Infrastructure Soar, Short Sellers Face Losses

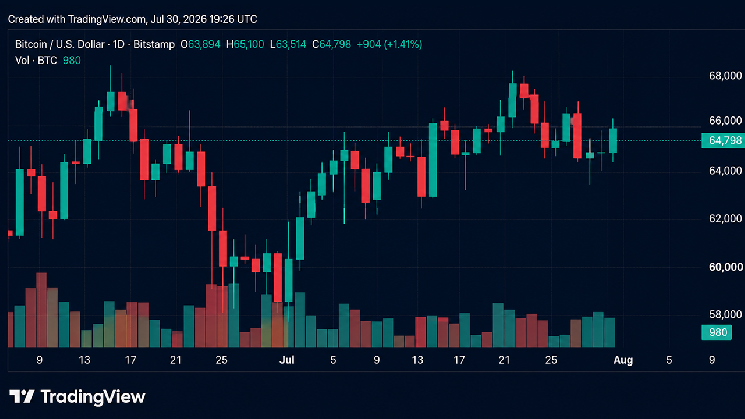
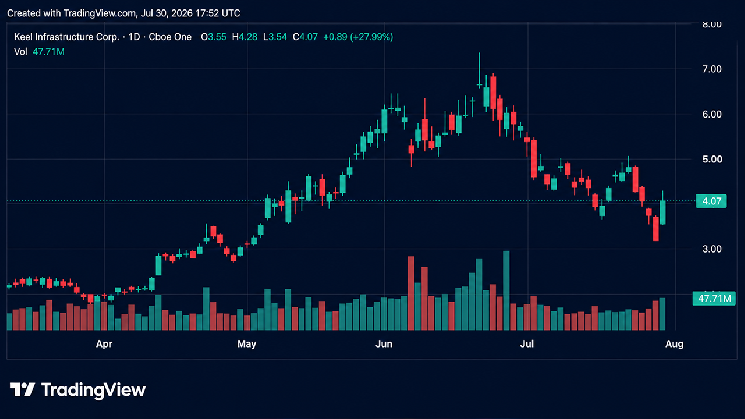
Shares of companies involved in Bitcoin mining and AI infrastructure surged, causing losses for short sellers. On Thursday, July 30, 2026, Keel Infrastructure (formerly Bitfarms) led the gains, rising 29.13%, followed by Nebius Group, Cipher Digital, and IREN Limited with jumps over 27%. Other notable gainers included Riot Platforms, Bitdeer, Core Scientific, Hut 8, and Cleanspark, with increases mostly ranging from 17% to 24%. The rally was attributed to a short squeeze triggered by a hedge fund's forced liquidation of its holdings, which were largely bought by Citadel. Additionally, Bitcoin trading above $64,000 and strong Microsoft earnings, highlighting AI's profitability, boosted market sentiment. Coreweave also announced a deal to provide AI cloud services for U.S. defense and intelligence agencies. This surge reflects a broader, longer-term trend of Bitcoin miners pivoting to AI data centers, leveraging their existing energy infrastructure and land. Recent multi-billion dollar deals by companies like Hut 8, IREN, and Terawulf for AI cloud services underscore this strategic shift. Other gainers, including Sandisk, Micron, Bloom Energy, and Cerebras, are suppliers critical to the AI infrastructure build-out. While the rally provided relief after July's losses, questions remain about capital expenditures, power availability, and long-term AI demand. The sustainability of these gains depends on these companies successfully converting their energy contracts and AI service deals into stable revenue streams.

cryptonews.ru31m ago

Stocks of Companies in Bitcoin Mining and AI Infrastructure Soar, Short Sellers Face Losses

cryptonews.ru31m ago

Trading

Spot

Hot Articles

How to Buy T

Welcome to HTX.com! We've made purchasing Threshold Network Token (T) simple and convenient. Follow our step-by-step guide to embark on your crypto journey.Step 1: Create Your HTX AccountUse your email or phone number to sign up for a free account on HTX. Experience a hassle-free registration journey and unlock all features.Get My AccountStep 2: Go to Buy Crypto and Choose Your Payment MethodCredit/Debit Card: Use your Visa or Mastercard to buy Threshold Network Token (T) instantly.Balance: Use funds from your HTX account balance to trade seamlessly.Third Parties: We've added popular payment methods such as Google Pay and Apple Pay to enhance convenience.P2P: Trade directly with other users on HTX.Over-the-Counter (OTC): We offer tailor-made services and competitive exchange rates for traders.Step 3: Store Your Threshold Network Token (T)After purchasing your Threshold Network Token (T), store it in your HTX account. Alternatively, you can send it elsewhere via blockchain transfer or use it to trade other cryptocurrencies.Step 4: Trade Threshold Network Token (T)Easily trade Threshold Network Token (T) on HTX's spot market. Simply access your account, select your trading pair, execute your trades, and monitor in real-time. We offer a user-friendly experience for both beginners and seasoned traders.

12.6k Total ViewsPublished 2024.03.29Updated 2026.06.02

How to Buy T

Discussions

Welcome to the HTX Community. Here, you can stay informed about the latest platform developments and gain access to professional market insights. Users' opinions on the price of T (T) are presented below.

活动图片