US Stocks Surge 16% in Two Months: Only 4 Occurrences in History, the Most Recent Was Just Before the 1987 Crash

marsbitPublished on 2026-06-03Last updated on 2026-06-03

Abstract

U.S. stocks have surged 16% over April and May, a gain seen only four times since WWII, according to Deutsche Bank strategist Henry Allen. Three prior instances followed recessions, but the sole non-recession precedent was in early 1987, months before the "Black Monday" crash. The current rally is underpinned by AI enthusiasm and strong data, but its speed without an economic recovery is historically unprecedented. Meanwhile, credit spreads remain near record lows despite growing consumer strain—the U.S. savings rate hit just 2.6% in April, a level last seen before the Global Financial Crisis, and consumer sentiment is at its lowest since 1952. Market risks are concentrated. While stocks and credit markets appear immune to geopolitical tensions, sovereign bonds tell a different story. Treasury yields have tracked oil prices and recently hit multi-year highs, creating a widening divergence with equities. Surprisingly stable oil prices, despite the prolonged closure of the Strait of Hormuz, have been a key pillar for risk assets. However, if the blockage persists, this support could fade, raising the risk of a stagflation shock not currently priced in.

Original Author: Zhao Ying

Original Source: Wall Street News

The recent strong rally in U.S. stocks is triggering historical alarms. The S&P 500 index has accumulated a 16% gain from April to May, a magnitude of increase that has occurred only 4 times since World War II. Three of those instances happened during recovery phases following economic recessions. The sole precedent not in a post-recession context occurred just months before the "Black Monday" crash in 1987.

Deutsche Bank macro strategist Henry Allen points out that the current rally is not taking place against a backdrop of post-recession recovery, making the historical comparison particularly stark. Meanwhile, credit spreads remain at historically low levels, but pressure signals from the consumer side are accumulating, expectations for Federal Reserve interest rate hikes are heating up, and the divergence between sovereign bond markets and stock markets continues to widen.

With multiple risk factors converging, market tail risks are becoming exceptionally concentrated. Henry Allen wrote in the report, "The tail risks in the current distribution are exceptionally prominent, both at the geopolitical level and at the market level."

Historical Precedents Are Rare, Only One Non-Recession Example Exists

The S&P 500's two-month gain of 16% from April to May has only 4 precedents since WWII.

Three of them occurred during powerful rebounds following recessions: the post-COVID-19 recovery from April to May 2020, the post-global financial crisis rebound from March to April 2009, and the recovery rally following the first oil crisis from January to February 1975.

The 4th instance was from January to February 1987. That was just months before October's "Black Monday" — the day the S&P 500 plunged 20% in a single session.
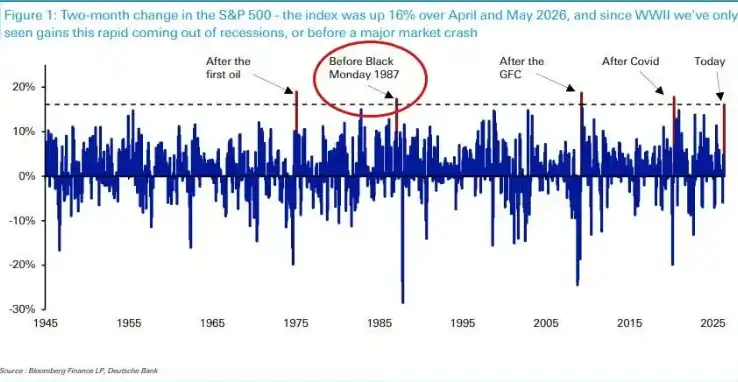
Henry Allen emphasizes that the current rally has its fundamental support, including high enthusiasm for artificial intelligence and strong economic data, but "the pace of gains itself has broken all recent precedents." In an economy not emerging from a recession, a rebound of this speed has never ended well in history.

Furthermore, the S&P 500 is on track to achieve its fourth consecutive year of double-digit gains, a record not seen since the late 1990s.

Excessive Optimism in Credit Markets, Consumer Pressure Signals Overlooked

The strength in equities has also spread to credit markets. Credit spreads in both the US and Europe are currently narrower than before the US-Iran conflict erupted, showing the market's high tolerance for risk.

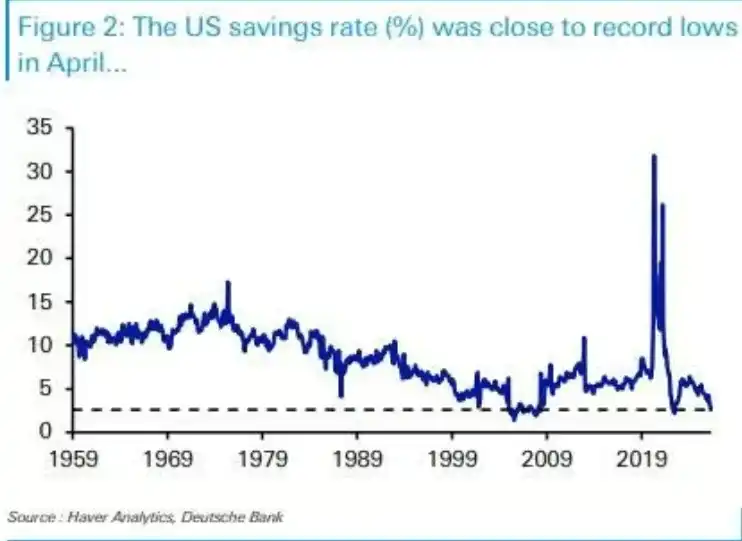
However, warning signals at the consumer level are accumulating. The US savings rate was just 2.6% in April, a similarly low level historically seen in only two other periods: a single month in 2022 (when pandemic-era excess savings were being depleted) and just before the global financial crisis erupted. Meanwhile, the University of Michigan Consumer Sentiment Index hit its all-time low in May since records began in 1952.

The monetary policy environment is also tightening. The European Central Bank is widely expected to raise interest rates this month, and market bets on Federal Reserve rate hikes in 2026 are heating up — with US PCE inflation reaching 3.8% year-on-year in April, providing support for this expectation.
Henry Allen notes that historically, hawkish stances from the Federal Reserve have often coincided with widening credit spreads, as seen in 2022, late 2018, and from 2015 to 2016. The current calm in credit markets forms a clear divergence from this historical pattern.

Bond Market Bearing Pressure Alone, Divergence with Stocks Continues to Widen

While equity and credit markets show high immunity to geopolitical risks, sovereign bond markets have charted a distinctly different course.

Over the past month, the yield on the 10-year US Treasury note has almost completely tracked oil price movements, clearly decoupling from other asset classes. In mid-May, sovereign bond yields hit multi-year highs: the 30-year US Treasury yield rose to 5.18%, the highest since 2007; the 10-year German bund yield climbed to 3.19%, the highest since 2011.

At that time, stocks were just a step away from record highs, while bond yields were already at levels not seen in over a decade. This divergence shows no signs of convergence to this day.

Henry Allen believes that bond markets more directly price in inflation and fiscal risks, hence reacting more sensitively to geopolitical shocks. The persistent divergence between stock and bond markets is itself a manifestation of current market fragility.

Unexpectedly Stable Oil Prices: A Key Pillar for Risk Assets

The blockade of the Strait of Hormuz has lasted far longer than initial market expectations, yet the reaction in oil prices has been surprisingly mild, which partly explains the resilience of risk assets.

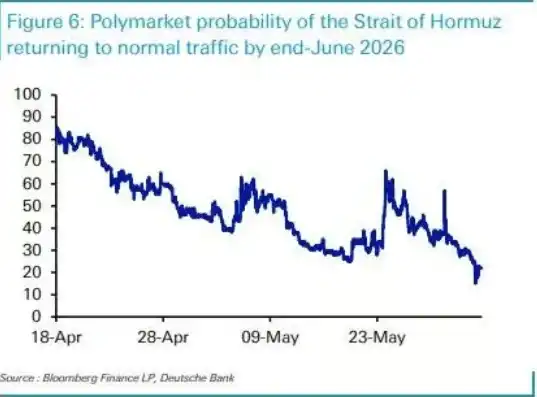
When the US-Iran conflict erupted on February 28, the White House initially estimated the operation would last 4 to 6 weeks. However, the Strait of Hormuz remains blocked to this day. According to prediction market Polymarket data, the probability of normal navigation resuming by the end of June has plummeted from around 80% in mid-April to just 22%.
Despite this, the oil futures curve has remained relatively stable. Just two weeks after the conflict began, on March 13, the 6-month Brent crude futures contract settled at $85.66 per barrel. On June 1, the same contract was quoted around $84.88, barely moving.

Henry Allen points out that it is precisely because the oil futures curve has not shifted significantly higher that investors have not priced in serious stagflation risks, thereby avoiding larger-scale selling of risk assets. However, he warns that if the Strait of Hormuz blockade persists, whether this support can be maintained remains uncertain.


Trending Cryptos

Related Questions

QAccording to the article, how many times since WWII has the S&P 500 gained 16% in a two-month period, and what is the key characteristic of the only non-recessionary precedent?

AAccording to the article, the S&P 500 has gained 16% in a two-month period only 4 times since WWII. Three of these instances occurred during recoveries from recessions. The only non-recessionary precedent was in January-February 1987, which preceded the 'Black Monday' crash later that year.

QWhat consumer-related warning signs are mentioned in the article as potential risks being overlooked by the market?

AThe article mentions two key consumer-related warning signs: the U.S. savings rate was only 2.6% in April (a level historically only seen briefly in 2022 and before the global financial crisis), and the University of Michigan Consumer Sentiment Index hit its lowest recorded level since 1952 in May.

QWhat historical anomaly does the article point out regarding the current relationship between Federal Reserve policy expectations and credit spreads?

AThe article points out a historical anomaly where tightening Federal Reserve policy has typically coincided with widening credit spreads, as seen in 2022, late 2018, and 2015-2016. However, currently, despite rising expectations for Fed rate hikes, credit spreads remain at historically low levels, showing a clear divergence from this past pattern.

QHow has the sovereign bond market behaved differently from the stock and credit markets in response to recent geopolitical risks?

AWhile stock and credit markets have shown resilience, the sovereign bond market has been under significant pressure. Specifically, the 10-year U.S. Treasury yield has closely followed oil price movements, decoupling from other assets. Yields on long-term U.S. and German government bonds recently hit multi-year highs, indicating the bond market is more directly pricing in inflation and fiscal risks.

QWhy has the oil market's reaction to the prolonged closure of the Strait of Hormuz been described as a 'key pillar' for risk assets?

AThe oil market's reaction has been a 'key pillar' for risk assets because, despite the Strait of Hormuz closure lasting much longer than initially expected, oil futures prices have remained surprisingly stable. This lack of a sharp upward move in the oil futures curve has prevented investors from pricing in severe stagflation risks, thereby avoiding a larger sell-off in riskier assets like stocks.

Related Reads

Bernstein Analysis: Can the $142 Billion Long-Term Order Hold Up the Memory Cycle?

Bernstein revisits long-term agreements (LTAs) in the memory industry, highlighting new contracts with purchase commitments, minimum prices, and financial guarantees signed by Micron and SanDisk. These aim to provide an earnings floor for the coming years. Micron has 16 strategic customer agreements, with 14 representing approximately $100 billion in minimum revenue and about $22 billion in cash deposits/commitments. SanDisk has contracts for around $42 billion in minimum revenue and over $11 billion in guarantees. Combined, these ~$33 billion in guarantees make it more costly for major clients to walk away. However, Bernstein models that the potential revenue needing protection over 3-5 years is around $5.2 trillion. The existing guarantees thus cover only about 0.6% of that scale. While LTAs provide a cushion, they cannot fully shield profits in a severe downturn, as clients may still find it cheaper to breach contracts if spot prices fall deeply below floor prices. LTAs are most suitable for large, credit-worthy customers like U.S. cloud service providers with stable, high-volume AI infrastructure needs. Consumer segments (phones, PCs) and some Chinese clients are less likely to adopt them, leaving an estimated 30-50% of the DRAM/NAND market exposed to spot price volatility. AI demand (e.g., HBM for training, storage for inference) supports higher valuations and makes LTAs more attractive for locking in high-demand customers. Yet, Bernstein stresses that LTAs soften, but do not eliminate, the memory cycle. Their true test will come in the next downturn, revealing whether clients honor contracts and whether guarantees provide sufficient pain to maintain supplier discipline.

marsbit23m ago

Bernstein Analysis: Can the $142 Billion Long-Term Order Hold Up the Memory Cycle?

marsbit23m ago

Dialogue with Jia Hang | Looking Back at Two Decades of Chinese Payment Going Global

**Summary: A Conversation with Jia Hang on Two Decades of China's Payment Globalization** Jia Hang, a veteran with over twenty years in payments, reflects on China's attempts to build a global payment network through three key phases: UnionPay (card networks), Alipay+ (digital wallets), and now, stablecoins. His journey began at UnionPay International, aiming to establish China's card network abroad. While successful in following Chinese tourists ("where Chinese go, UnionPay goes"), it struggled to achieve true global scale. The core lesson: card networks like Visa/Mastercard's unassailable advantage isn't just technical standards, but their deeply entrenched **governance and profit-sharing models** that create powerful network effects. Competing as the "same species" is nearly impossible. At Ant Group, he led Alipay+, a strategy to bypass card networks by interconnecting local e-wallets worldwide. While innovative, it faced a similar ceiling. Mobile QR payments and card swipes were essentially **the same species competing for the same pie**, lacking a disruptive value proposition for users or a sustainable new incentive model to replace the card networks' established flywheel. Today, at Singapore's DCS, Jia focuses on stablecoin-based payments. He argues stablecoins represent a fundamental shift. They are not competing with Visa for consumer payments but challenging the **traditional banking and account system for value movement**. Products like "U Cards" (stablecoin-linked payment cards) are transitional, leveraging existing card networks for acceptance while building new rails. The real potential lies in stablecoins enabling seamless, low-cost global value transfer, potentially reorganizing the financial infrastructure around **accounts rather than cards**. Jia believes stablecoin adoption for local retail payments, cross-border transactions, and as high-yield savings vehicles is becoming irreversible. This could gradually reduce reliance on traditional fiat channels, especially in regions with weak currencies or capital controls. The quest for the "next global payment network" continues, now centered on whether stablecoins can successfully bridge Web2 and Web3, establish new governance, and create compelling user value beyond mere cost reduction.

marsbit47m ago

Dialogue with Jia Hang | Looking Back at Two Decades of Chinese Payment Going Global

marsbit47m ago

Circle's Stock Price Plunges 76%, Hong Kong Dollar Stablecoin Set to Launch Within Two Weeks

Circle's stock price has plunged approximately 76% from its 2023 peak, reflecting a major market revaluation. Despite this, Circle President Heath Tarbert emphasized the company's focus on long-term execution and its dominant position with USDC's $73 billion circulation across 34 blockchains. The competitive landscape is intensifying. A new consortium-backed stablecoin, Open USD, is attempting to challenge incumbents by sharing reserve yields with partners. More significantly, Visa's new stablecoin platform, initially supporting Open USD while also being compatible with USDC, could erode Circle's network effects. In response, Circle is expanding into real-world payments through partnerships like the one with Japan's JCB. Separately, Tether (USDT) faces a two-year compliance window under new U.S. regulations, requiring it to adjust its reserve composition away from assets like Bitcoin and loans towards cash and U.S. Treasuries. Meanwhile, in Hong Kong, Standard Chartered-backed fintech firm Dian Dian is poised to launch a licensed HKD-pegged stablecoin (HKDAP), moving the industry into a phase where the real test is integrating licensed stablecoins into actual payment flows and corporate treasury systems. The sharp decline in Circle's stock underscores a broader shift: the stablecoin market is moving from a winner-takes-all dynamic to a multi-player competitive arena where execution, compliance, and real-world utility are becoming paramount.

marsbit47m ago

Circle's Stock Price Plunges 76%, Hong Kong Dollar Stablecoin Set to Launch Within Two Weeks

marsbit47m ago

Trading

Spot

Hot Articles

How to Buy 4

Welcome to HTX.com! We've made purchasing 4 (4) simple and convenient. Follow our step-by-step guide to embark on your crypto journey.Step 1: Create Your HTX AccountUse your email or phone number to sign up for a free account on HTX. Experience a hassle-free registration journey and unlock all features.Get My AccountStep 2: Go to Buy Crypto and Choose Your Payment MethodCredit/Debit Card: Use your Visa or Mastercard to buy 4 (4) instantly.Balance: Use funds from your HTX account balance to trade seamlessly.Third Parties: We've added popular payment methods such as Google Pay and Apple Pay to enhance convenience.P2P: Trade directly with other users on HTX.Over-the-Counter (OTC): We offer tailor-made services and competitive exchange rates for traders.Step 3: Store Your 4 (4)After purchasing your 4 (4), store it in your HTX account. Alternatively, you can send it elsewhere via blockchain transfer or use it to trade other cryptocurrencies.Step 4: Trade 4 (4)Easily trade 4 (4) on HTX's spot market. Simply access your account, select your trading pair, execute your trades, and monitor in real-time. We offer a user-friendly experience for both beginners and seasoned traders.

4.8k Total ViewsPublished 2025.10.20Updated 2026.06.02

How to Buy 4

Discussions

Welcome to the HTX Community. Here, you can stay informed about the latest platform developments and gain access to professional market insights. Users' opinions on the price of 4 (4) are presented below.

活动图片