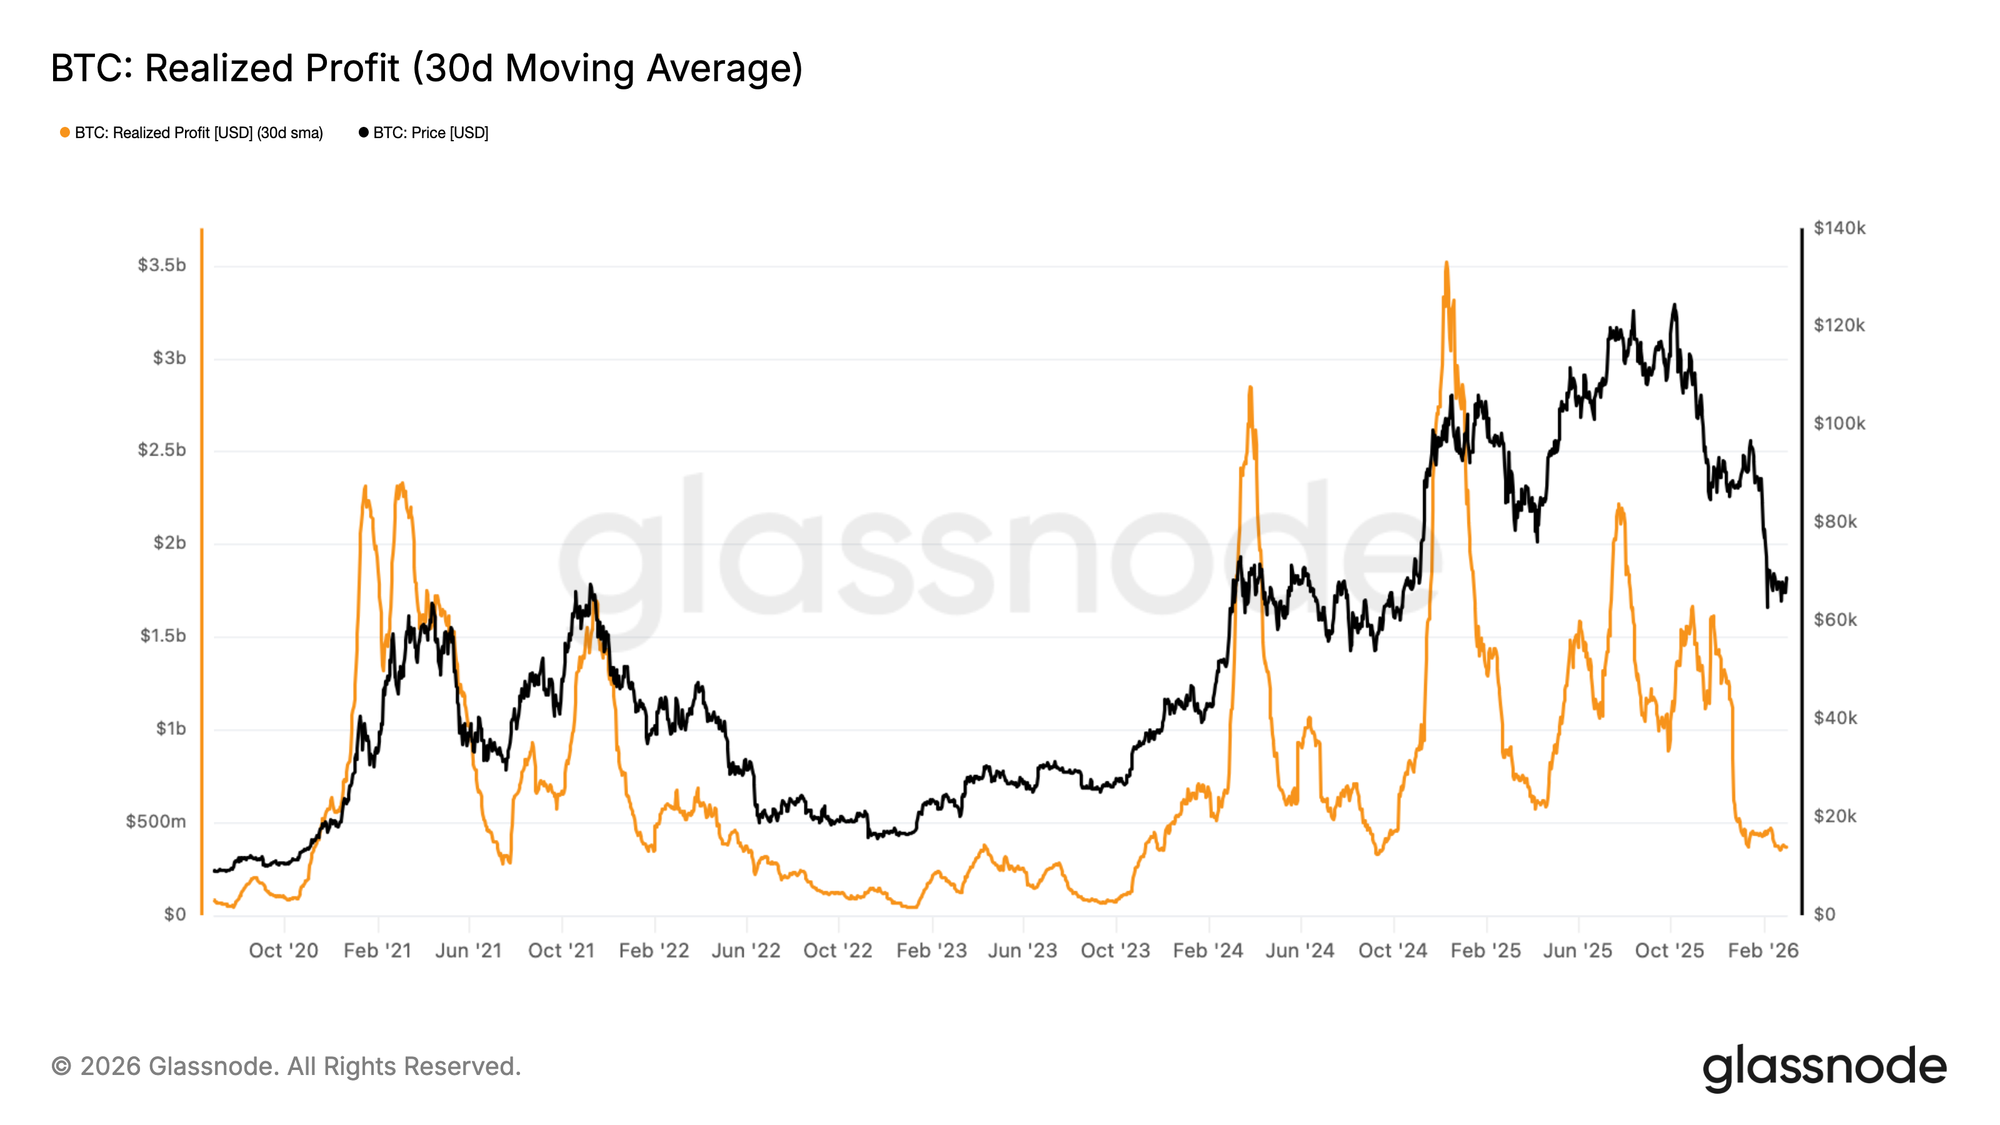
自二月初以来,比特币多次未能实现周线收盘站上7万美元大关,确立该区域为重要的近期阻力位。为评估此次价格回调是否反映需求的实质性恶化,我们转向已实现利润的30日简单移动平均线(30D-SMA),该指标汇总了链上参与者在花费代币时锁定的以美元计价的利润,并经过平滑处理以过滤短期噪音。
随着价格稳定在7万美元关口下方,该指标从每日超过10亿美元急剧收缩至约3.7亿美元,跌幅约63%。月均已实现利润的压缩表明,愿意溢价交易的买家群体已显著减少,买方流动性目前处于2024年8月至9月期间以来的最弱水平。
综合来看,证据表明上涨动能已经停滞,价格将处于无方向的横盘整理状态,直到新的需求催化剂出现。
熊市中的行情判断
横盘走势是牛市和熊市周期中反复出现的结构,因此背景至关重要。两个横向整理阶段可能因底层需求状况不同而具有截然不同的含义,因此必须透过价格寻找佐证。
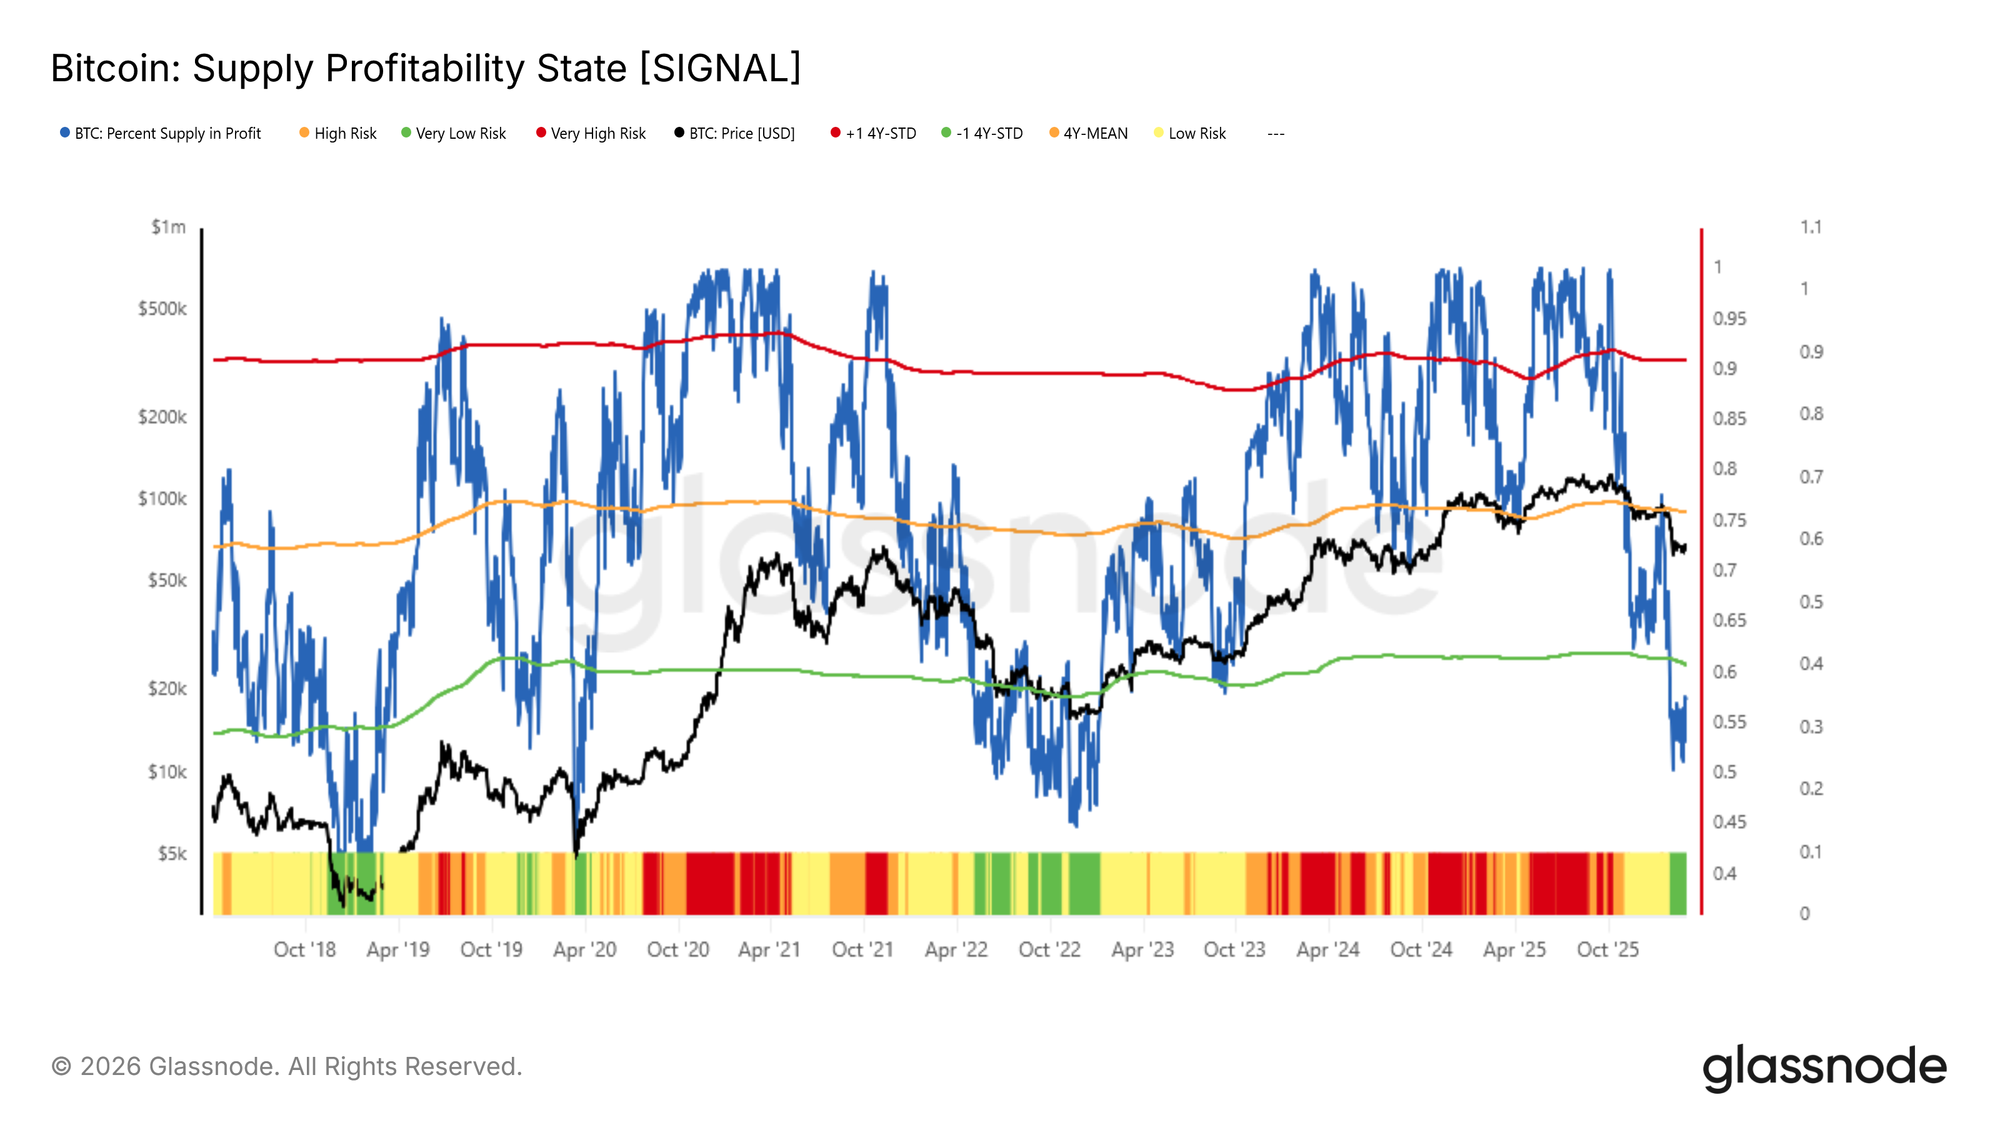
用于此目的的一个有效视角是「盈利供应百分比」,该指标衡量流通中的比特币供应中,相对于每个代币的链上获取成本持有未实现收益的比例。
当该指标普遍处于高位时,反映投资者信心广泛;当恶化时,则表明处于亏损状态的持有者群体不断扩大,这种情况历史上与持续的抛压相关。
自二月初以来,该指标已跌破其-1标准差阈值(接近60%),目前位于约57%。历史上,该水平的读数与深度熊市的早期阶段相吻合,最显著的是2022年5月和2018年11月。这表明当前的整理可能并非复苏的跳板,而更多是中期内 prevailing 不利市场行情的延续。
短期缓解性反弹与成本基础天花板
尽管面临买方流动性减少和市场行情缺乏广泛未实现盈利能力的阻力,但数周的横盘整理并非没有建设性的解释。这种局部均衡可以,并且经常确实,先于短期缓解性反弹。
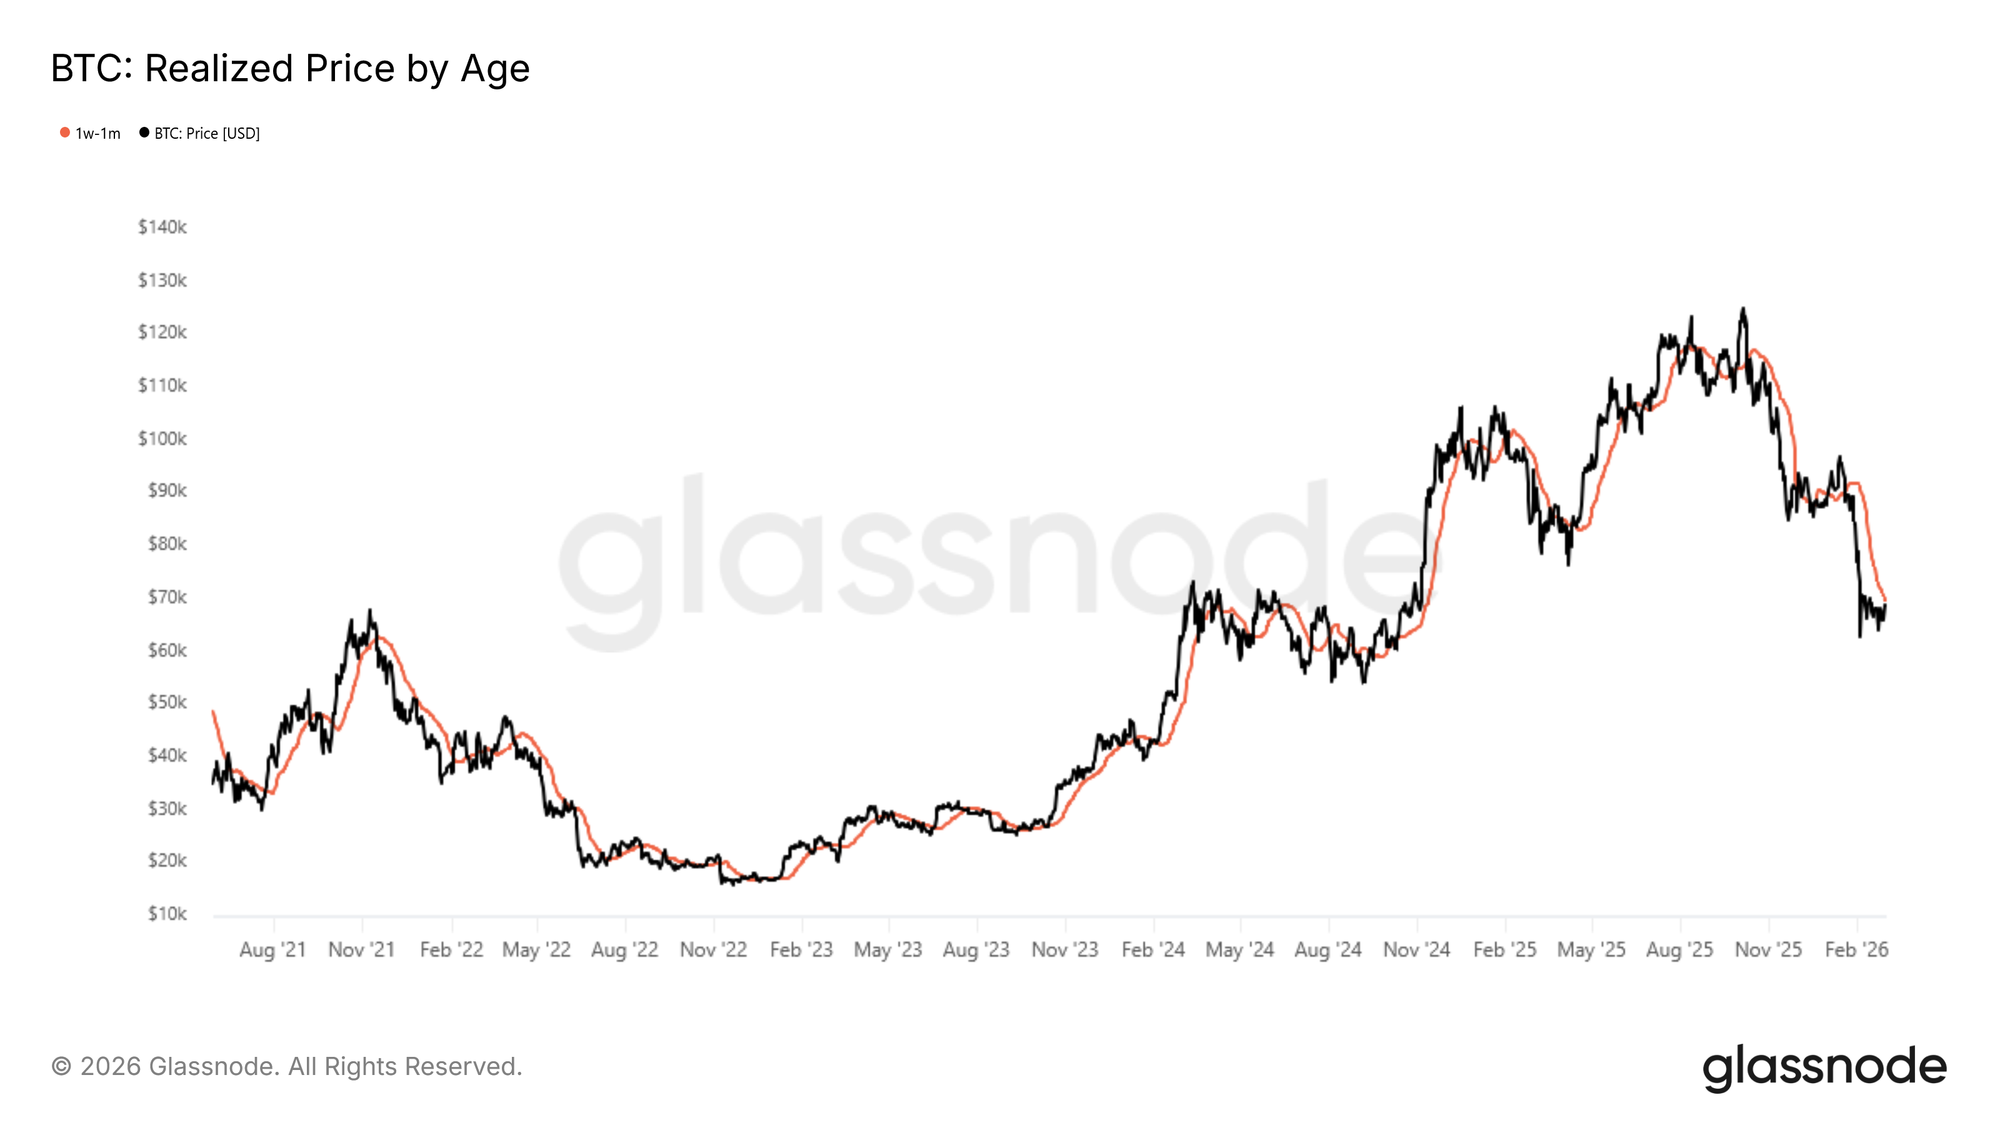
一个实用的链上工具,用于衡量此类反弹潜在衰竭点的是短期持有者成本基础,特别是针对持有时长在一周至一个月之间的代币。该群体代表了最新一波市场参与者,其获取价格充当关键的行为锚点:在熊市的更深阶段,局部反弹往往在这些近期买家接近盈亏平衡点时停滞,激励他们在情况进一步恶化前退出头寸或锁定微薄利润。
目前,该1周至1月持有者群体的成本基础位于7万美元附近,这意味着围绕该水平的±2%区域——大约6.85万至7.15万美元——代表了任何近期价格复苏的潜在阻力和派发区域。
链外洞察
现货流显示复苏迹象
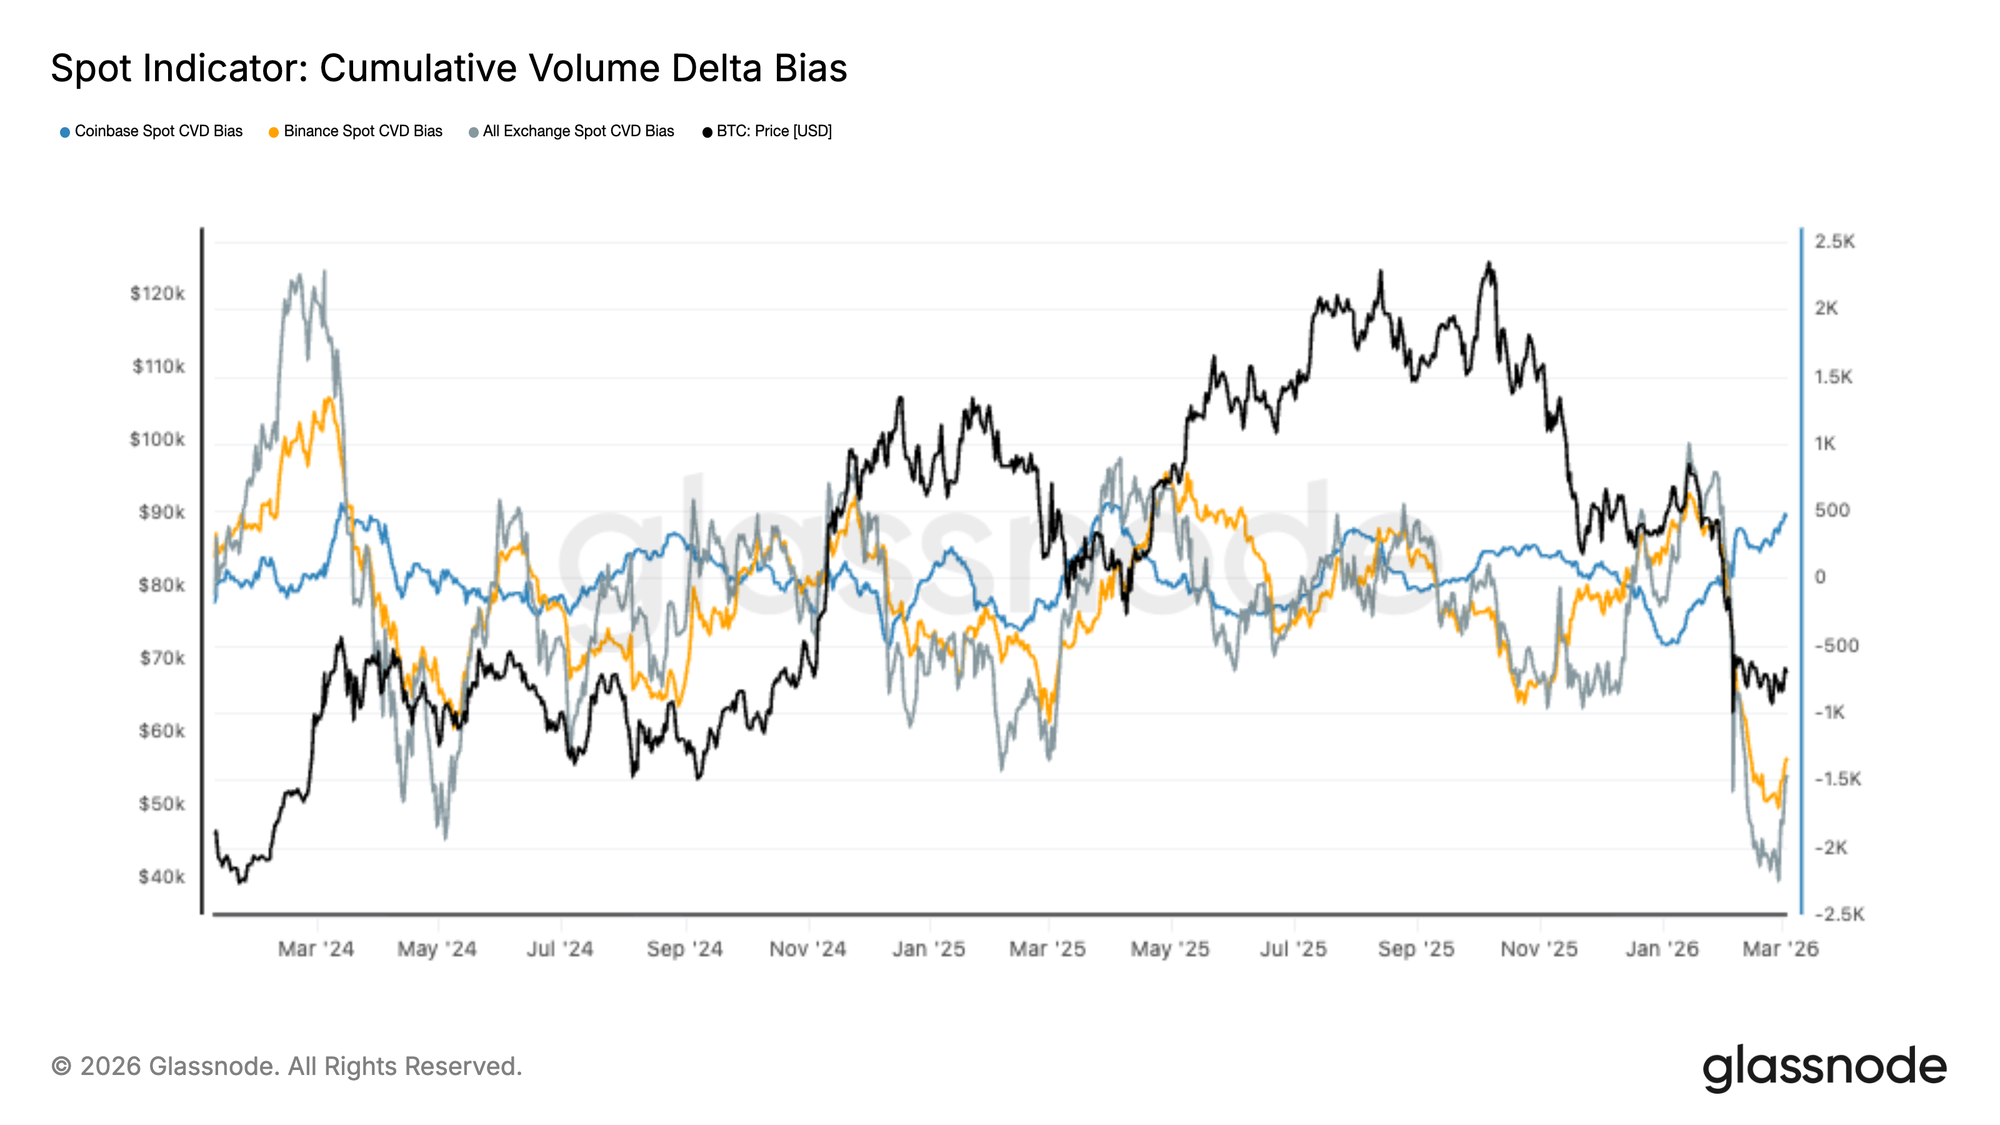
现货市场最近经历了一波剧烈的卖方主导浪潮,主要交易所的累计成交量差额(CVD)暴跌至深度负值,因为激进的市价卖单推动了最近的价格下跌。
然而,在过去几天里,抛售速度似乎正在放缓。Coinbase现货CVD已开始反弹,表明买方活动出现早期复苏迹象,而币安和汇总交易所流虽然仍然疲软,但不再加速下行。
这种转变暗示,现货驱动的派发最激烈阶段可能正在缓解。然而,持续的复苏可能需要多个交易所的现货买盘吸收出现更广泛的改善,才能形成更强的积累动态。
ETF流出放缓,早期流入重现
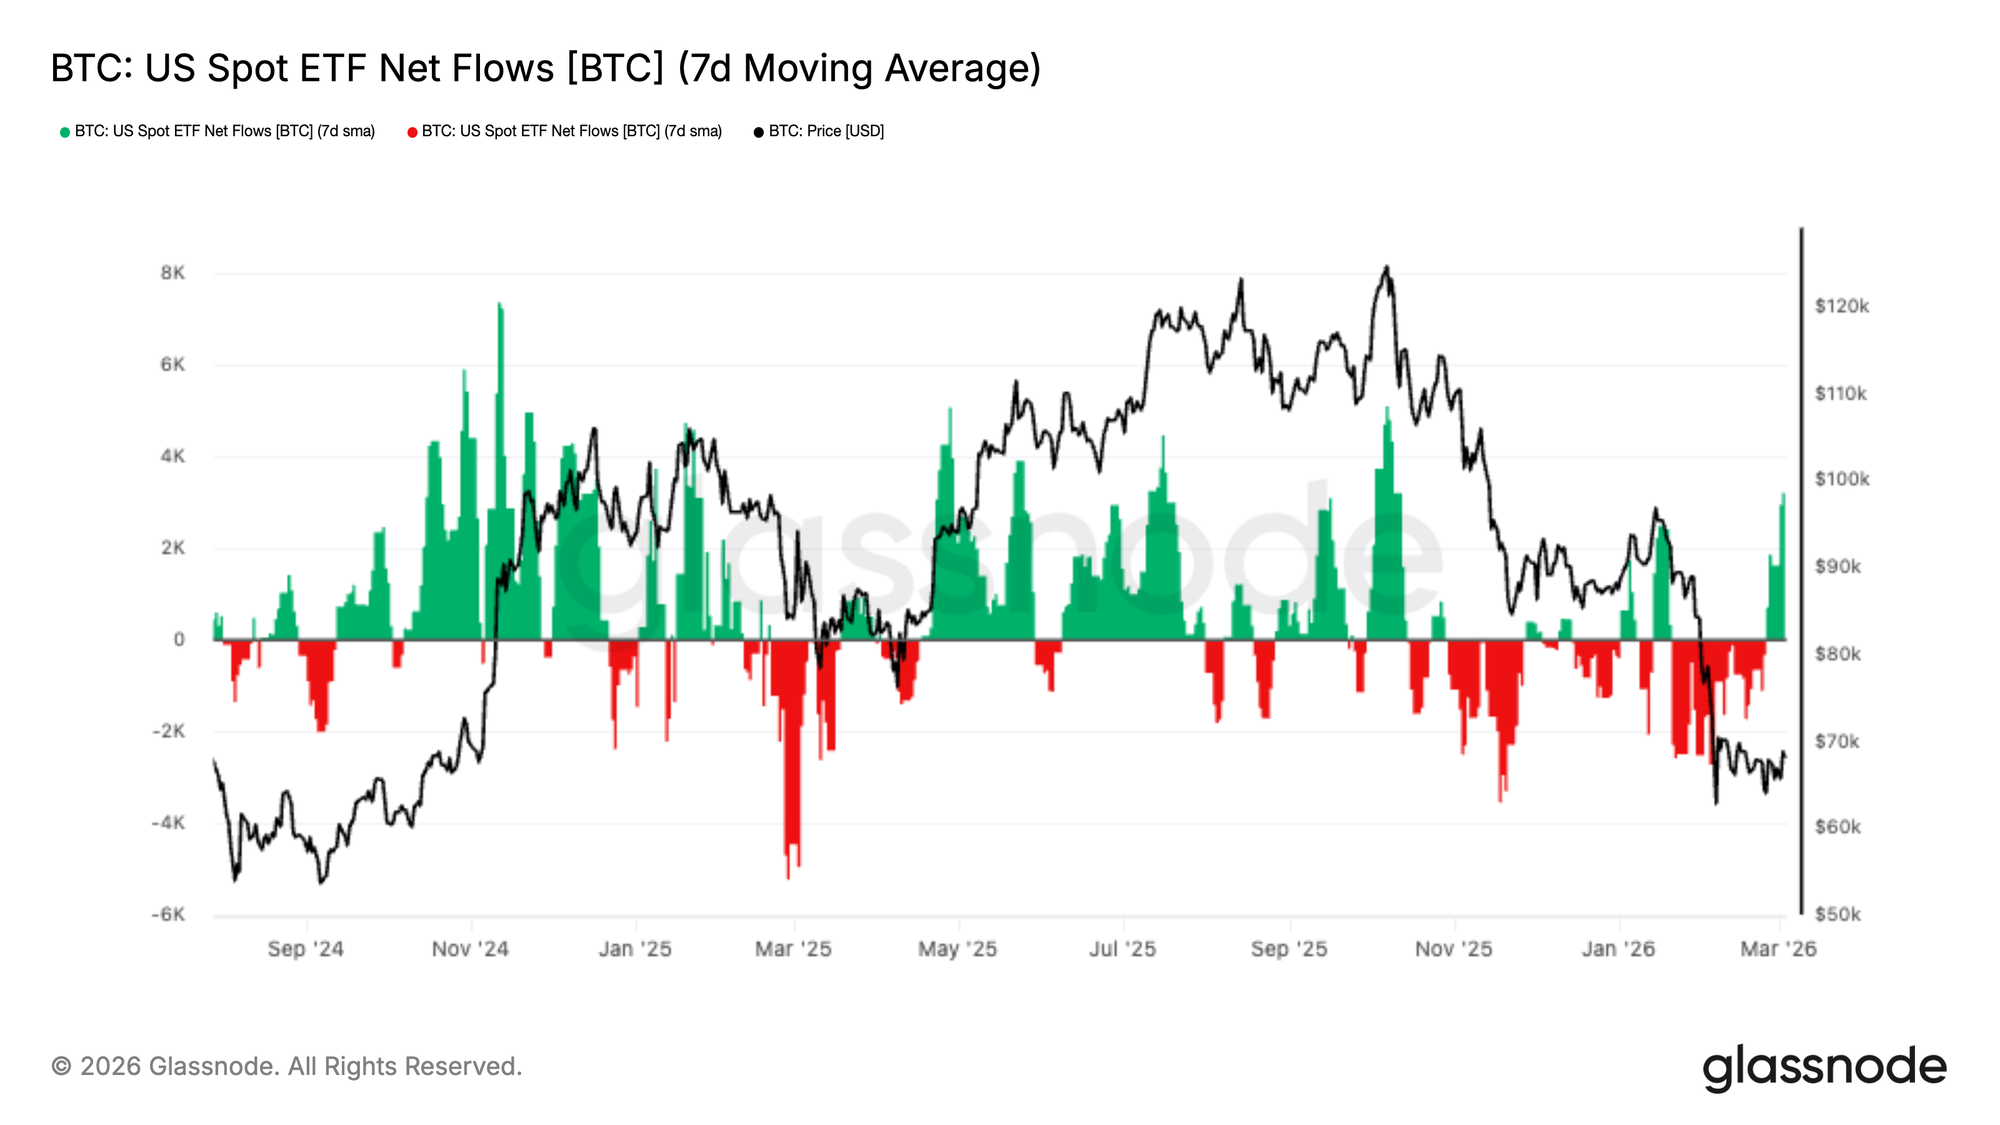
美国现货比特币ETF在近期市场下跌期间经历了持续流出,反映了随着价格走低,机构持续的去风险化。净流量的7日移动平均线连续数周保持负值,强化了受监管投资渠道中普遍的避险环境。
然而,在过去几天里,流量开始稳定,并出现了 renewed 流入的初步迹象。这种转变表明,随着比特币在近期低点附近整理,机构抛压可能正在缓和。
虽然确认需求出现持久逆转还为时过早,但ETF流入的持续复苏将标志着机构情绪的改善,并可能为市场提供重要的现货端支撑。
永续合约溢价持续压缩
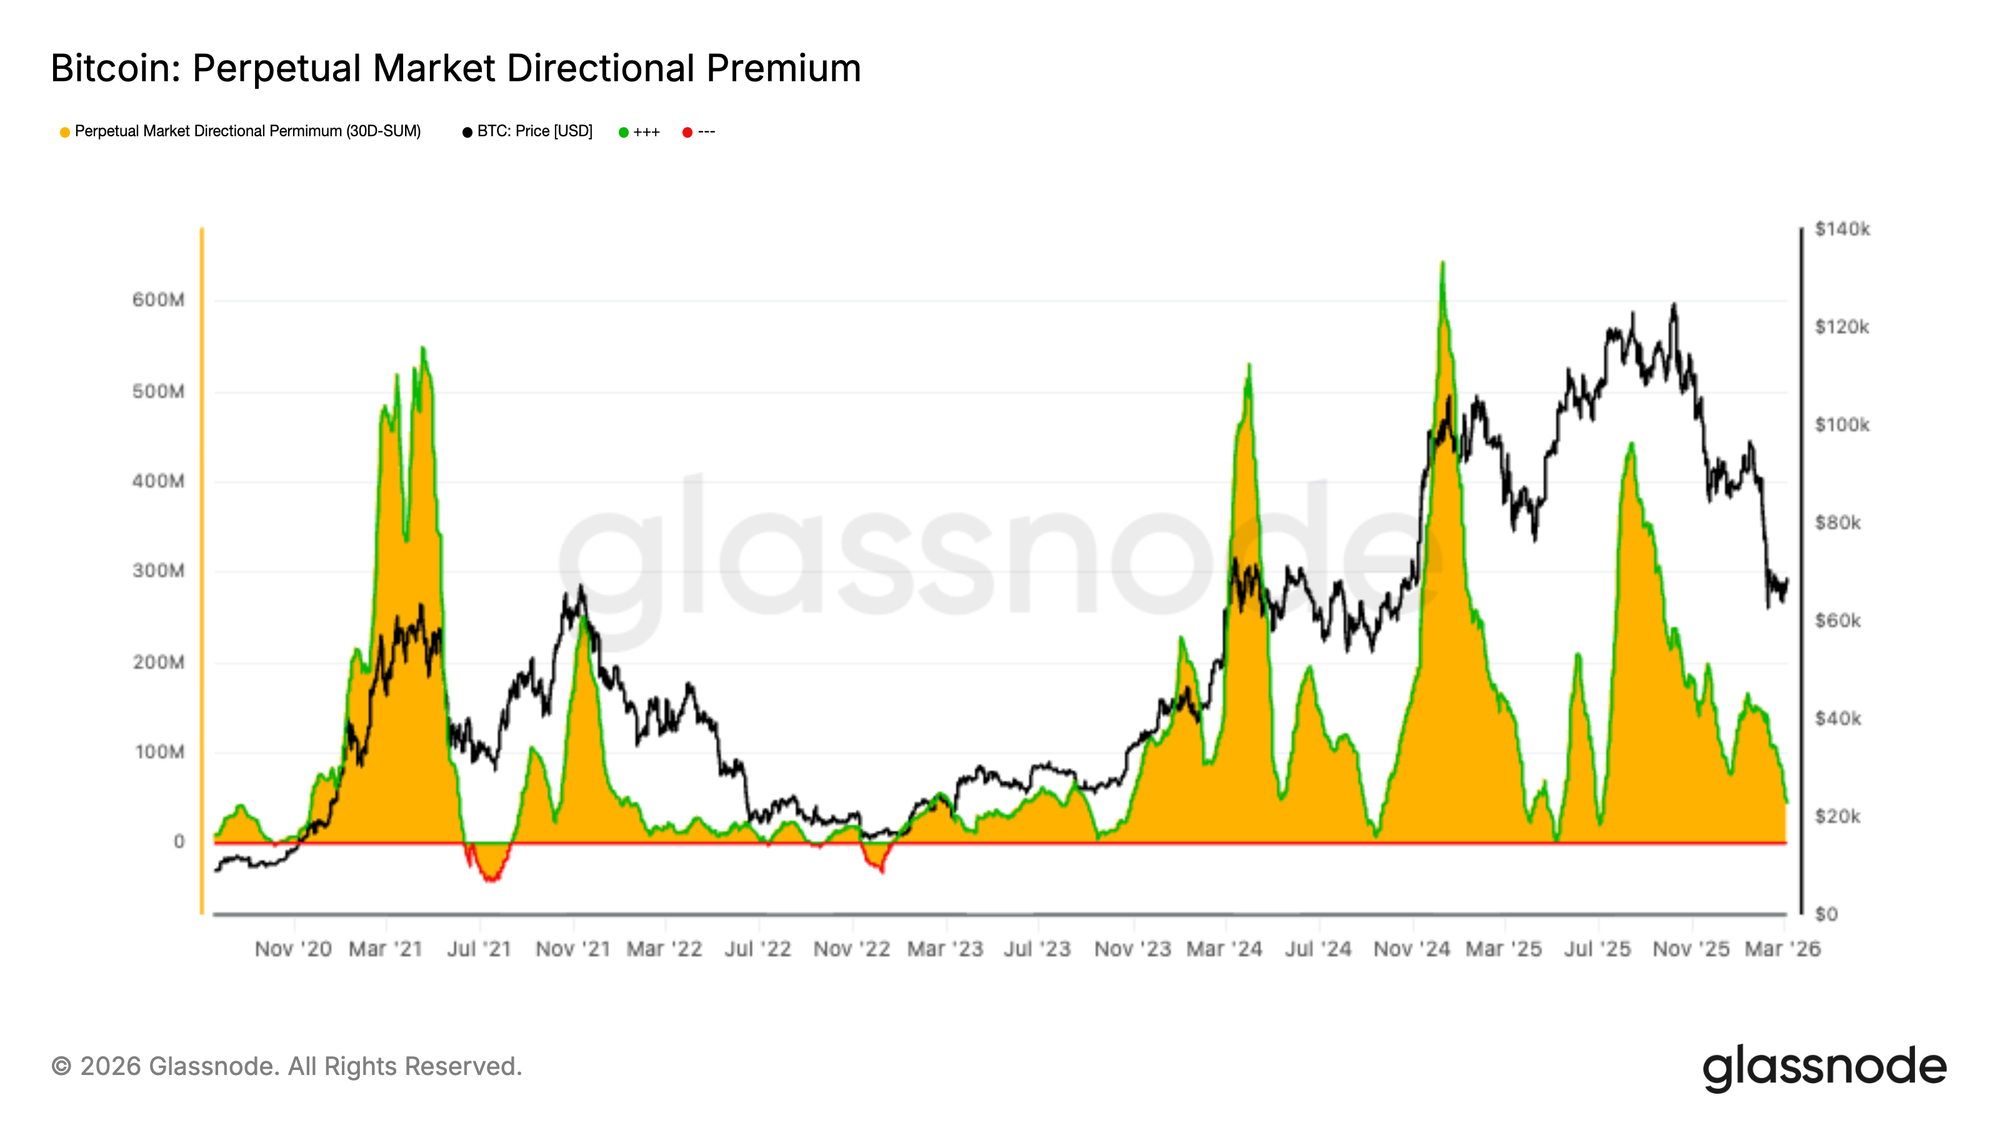
永续市场定向溢价继续走低,反映了永续期货市场看涨头寸的持续减少。随着更广泛的市场回调,该指标近几周稳步下降,杠杆和方向性信心也随之冷却。
在过去几天里,溢价进一步压缩至周期低点附近,表明投机性多头敞口继续平仓。这种动态表明衍生品交易者仍持谨慎态度,对杠杆上行敞口的需求明显 subdued。
虽然下跌反映了看涨动能的减弱,但也表明过剩杠杆正从系统中清除。溢价的稳定可能标志着衍生品头寸正接近更中性的水平。
波动率压缩信号稳定
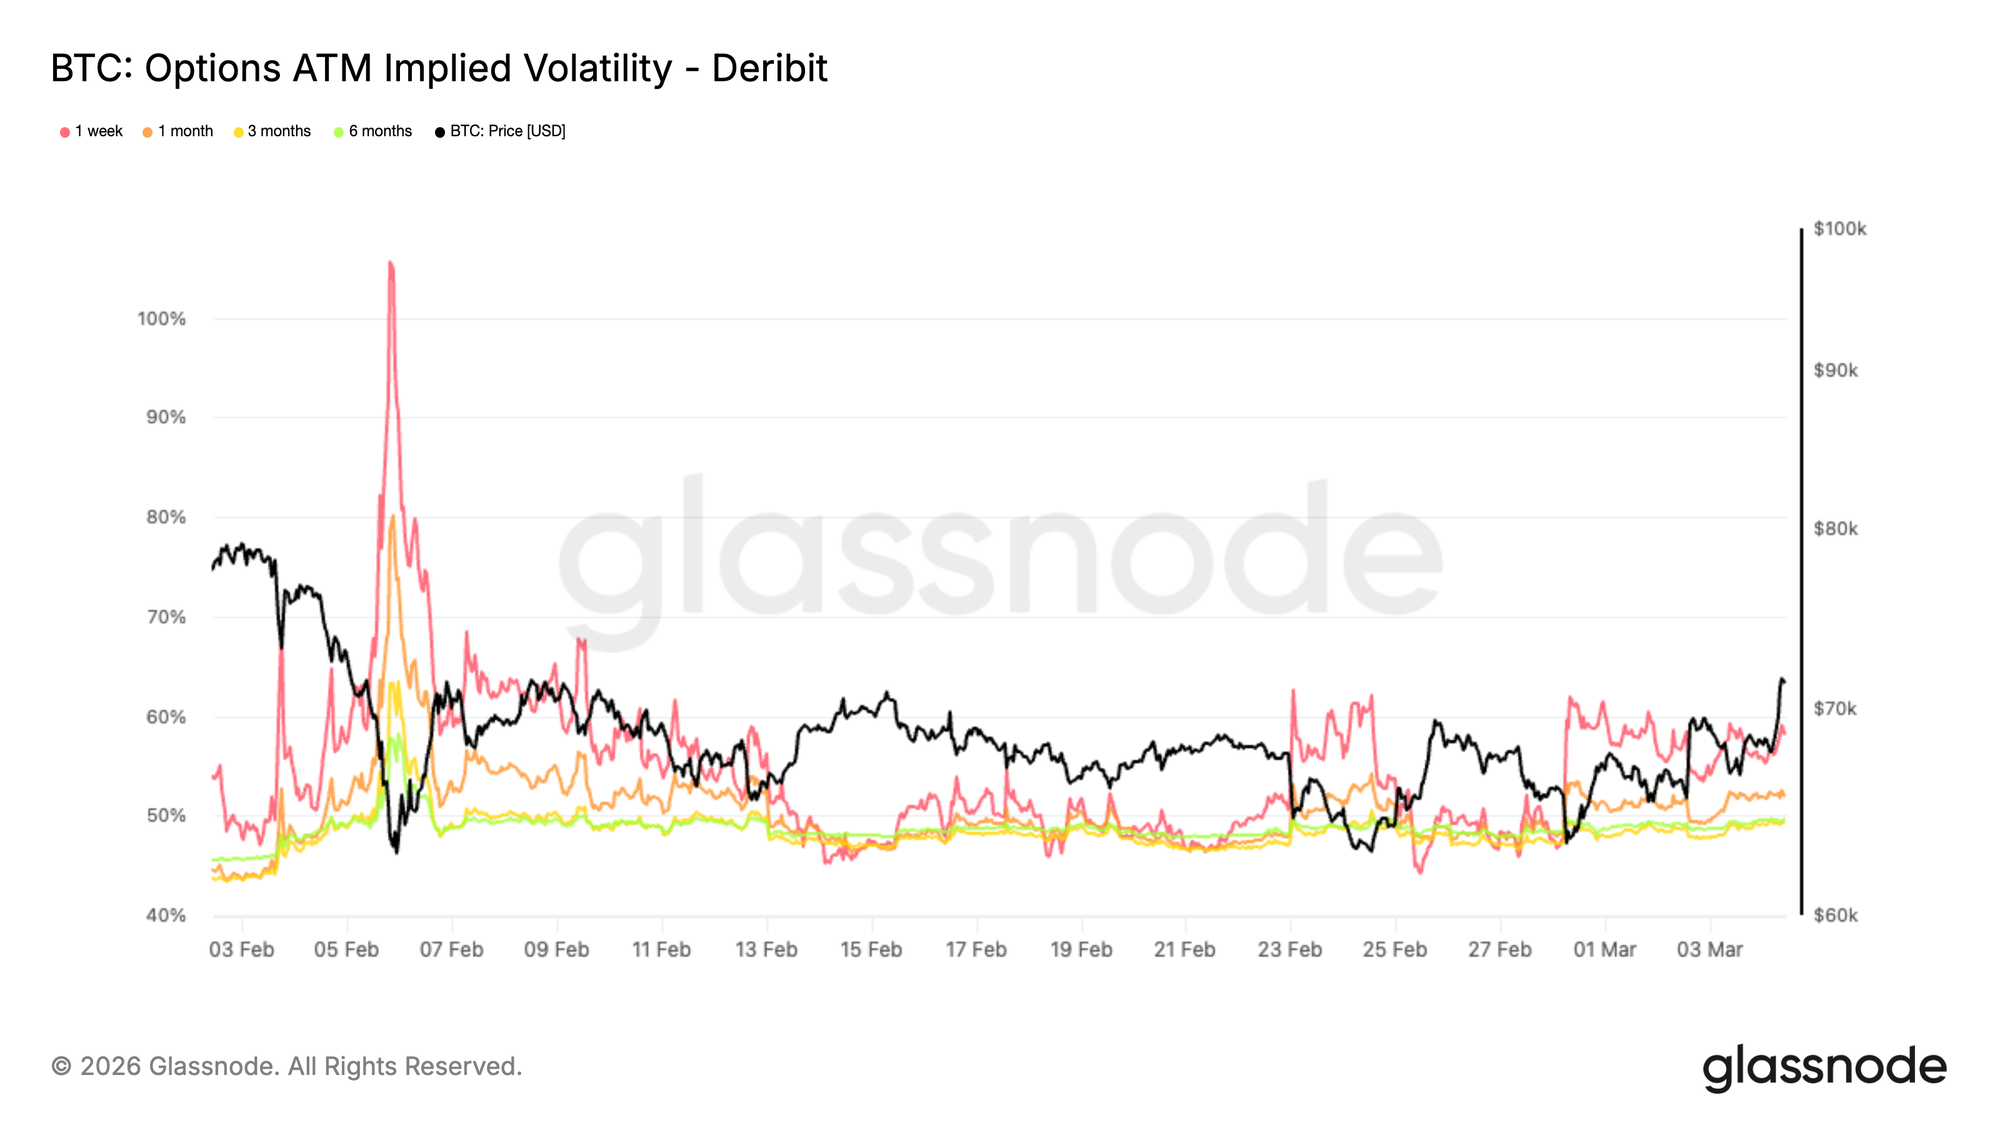
隐含波动率在二月初观察到飙升后继续压缩。 across the main tenors, ATM IV 已显著走低,表明交易者不再积极 pricing 尾部风险。
这种转变反映了在经过一段 forced 去杠杆和清算驱动的波动后,情绪的稳定。随着恐慌性定价消退,期权市场开始从压力状况过渡到更中性的波动机制。
较低的隐含波动率也改变了头寸动态。当波动率下降而价格稳定时,期权多头持有者面临 increasing theta decay,使得方向性 conviction 更加重要。
就目前而言,波动率压缩表明市场正从危机定价转向整理阶段,其中头寸而非恐慌对冲成为价格行动的主导驱动力。
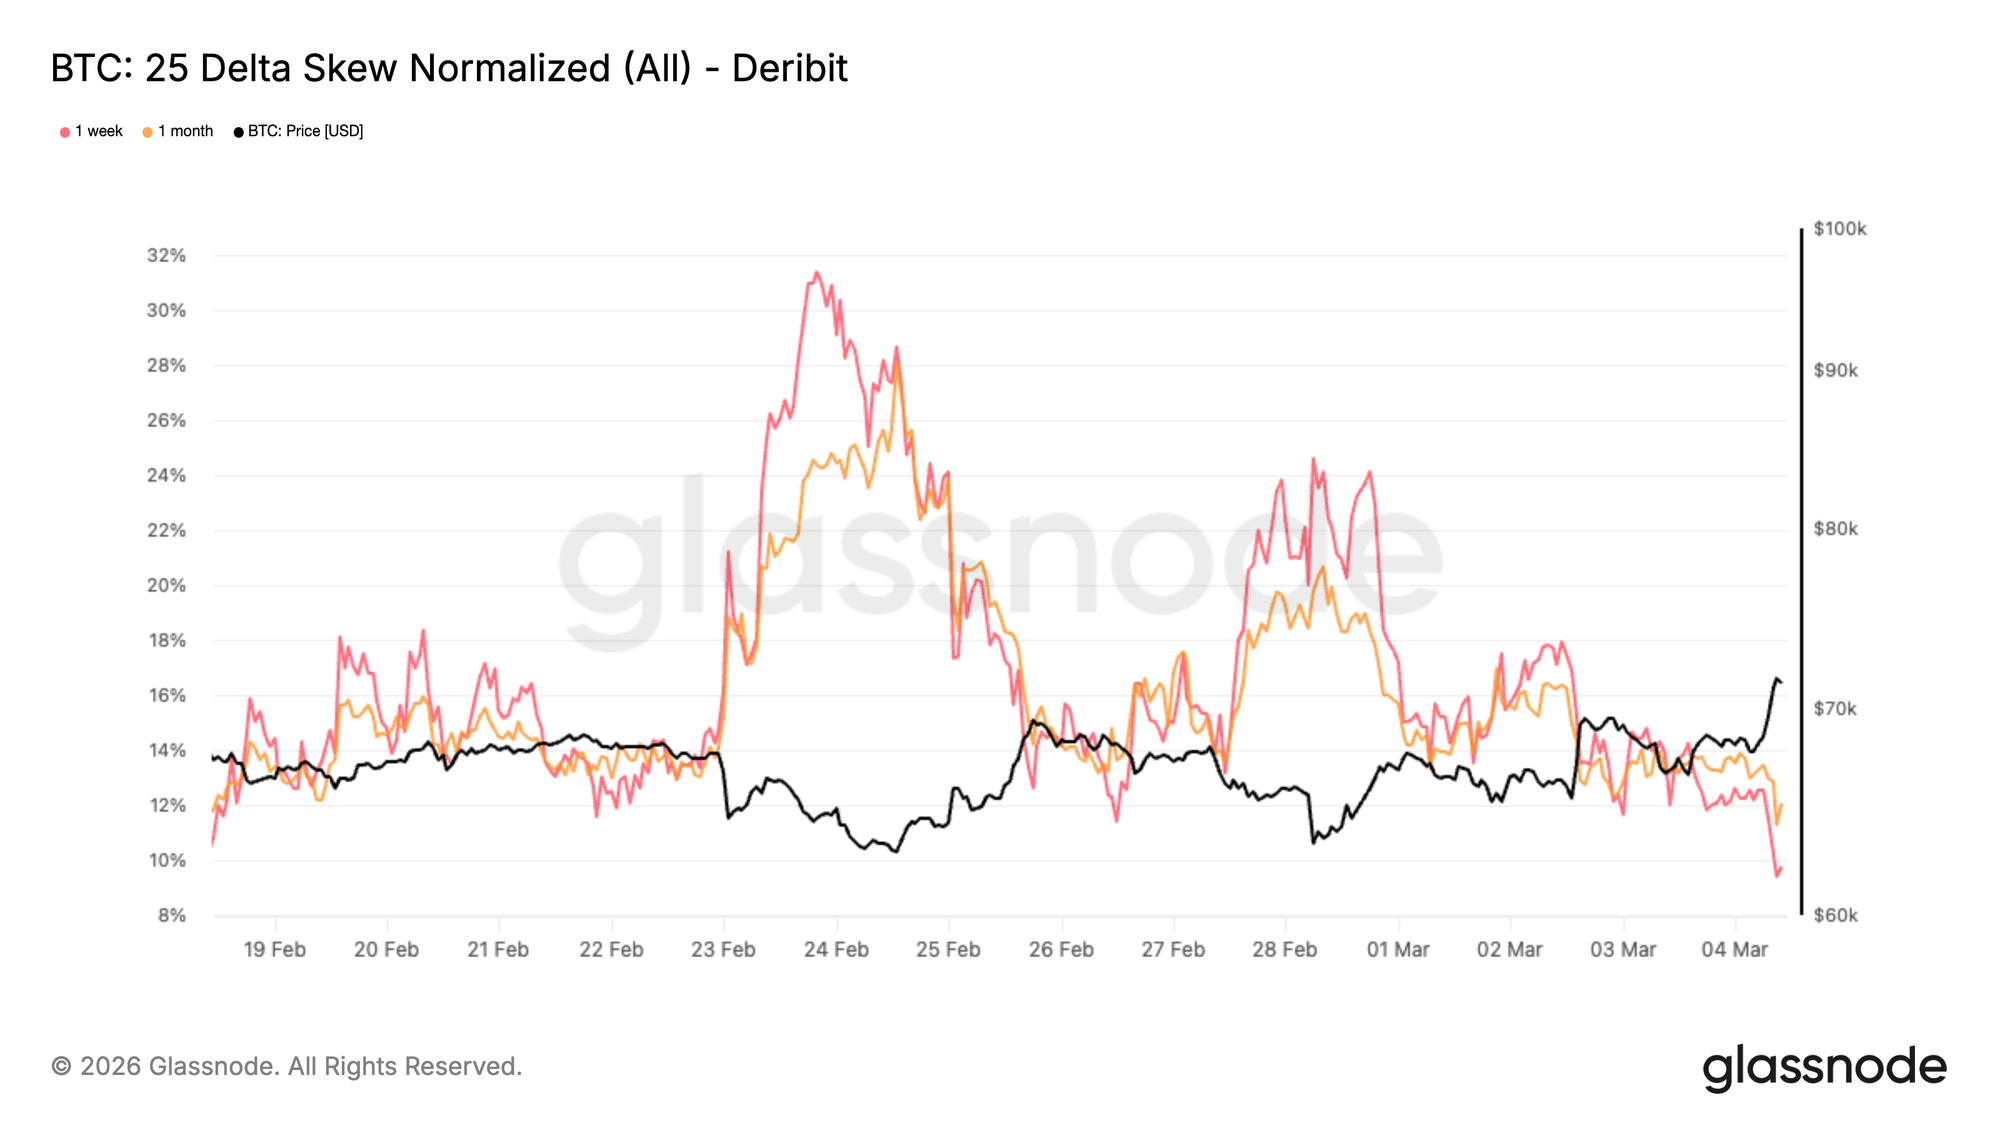
偏斜正常化反映下行恐惧消退
偏斜已从二月份抛售期间观察到的极端水平大幅压缩。过去两周,如图表所示,比特币价格的每一次下跌都在期权市场引发了 progressively milder 的反应。交易者在竞购下行保护方面远没有那么激进,逐渐将偏斜拉低。在抛售高峰期间,看跌期权需求激增,并将偏斜推入深度看跌区域,因为交易者急于对冲 further downside。这种紧迫感显然已经缓解。
我们所看到的并非完全正常化,而是风险的重新定价:偏斜已从20多降至10初,仍然反映了对保护的需求,但处于远没有那么紧张的水平。这种转变表明,对下行对冲的 immediate need 正在消退。一些保护性头寸正在平仓,而对上行敞口的兴趣正在 slowly reappearing。
历史上,这种类型的偏斜压缩往往发生在市场走出压力阶段并开始 transition into 更平衡的头寸环境时。
期权流转向看涨期权
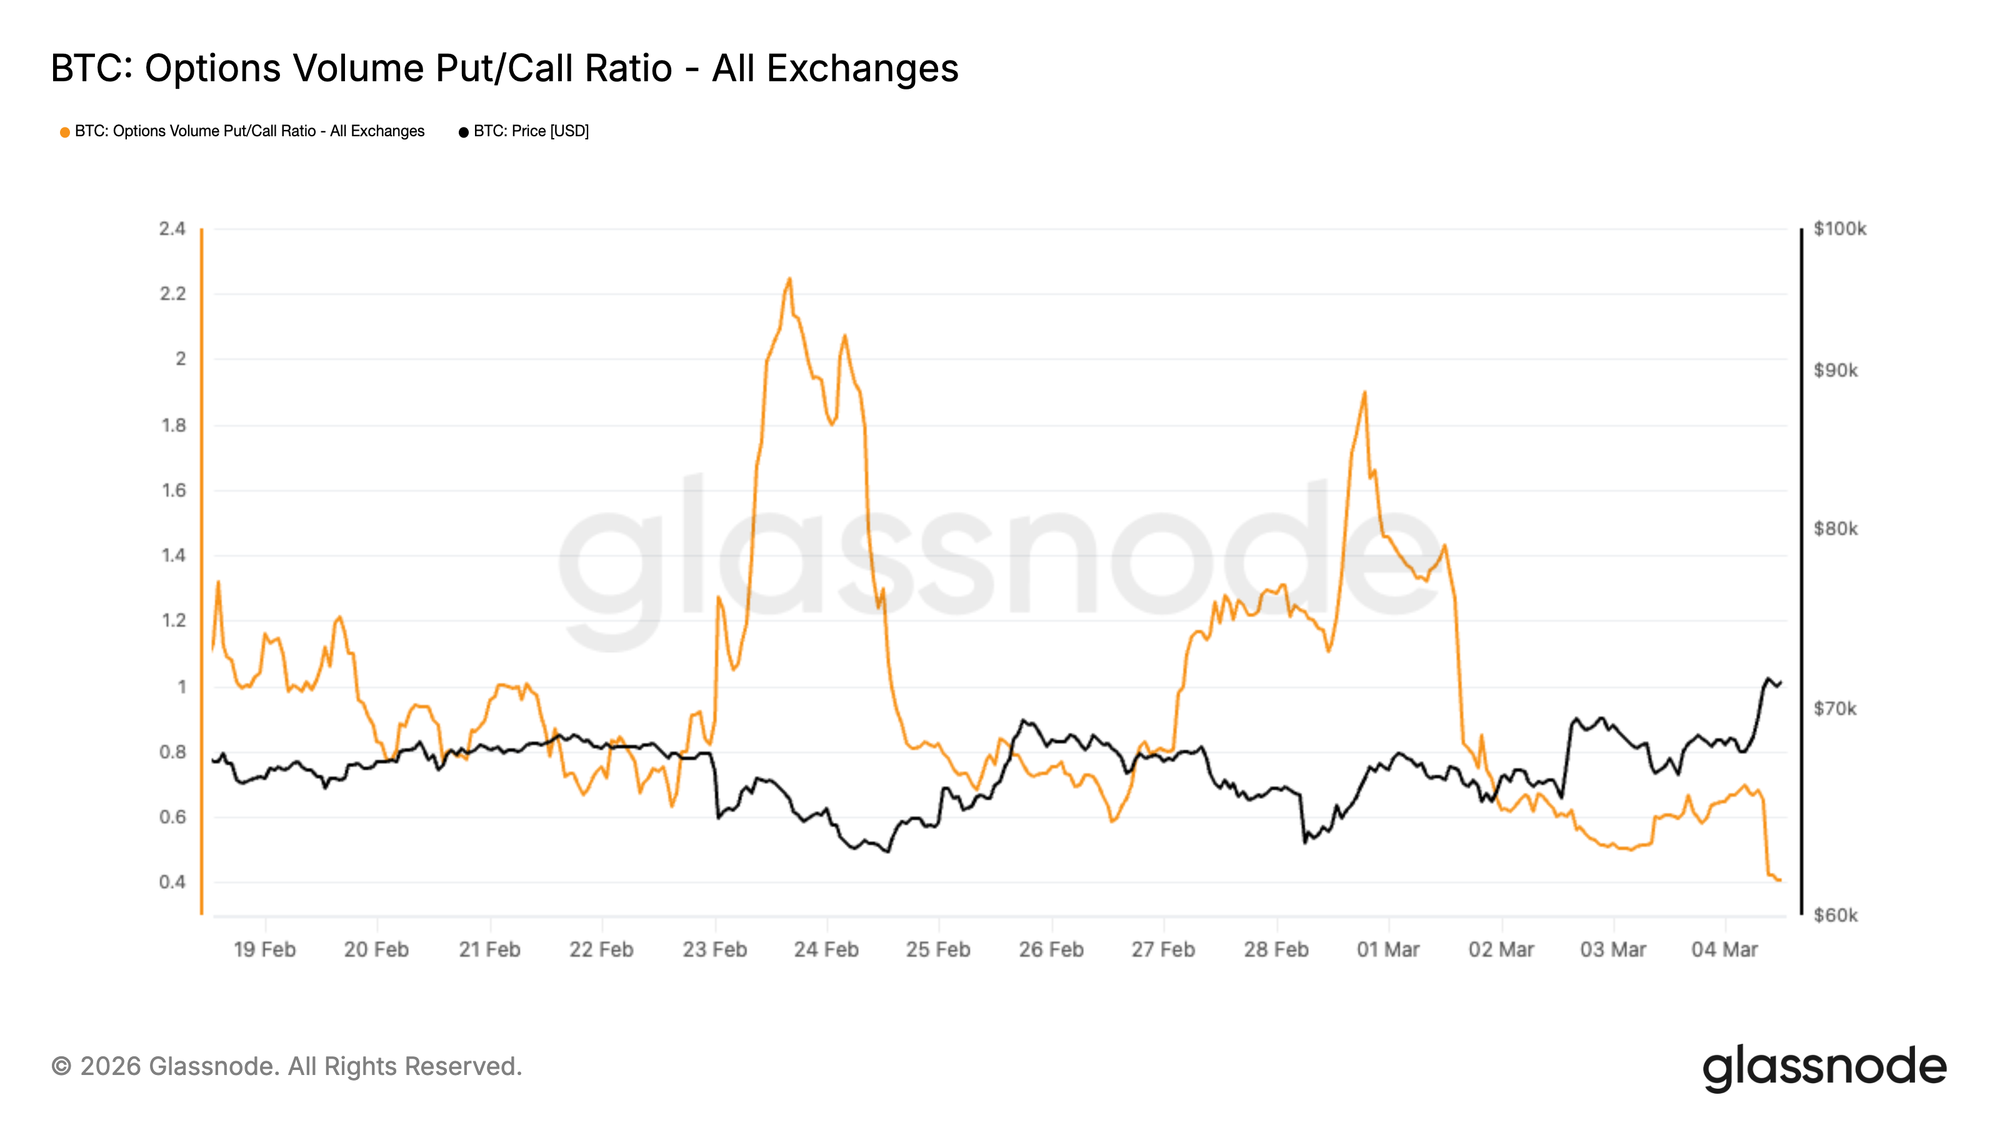
看跌/看涨成交量比率衡量看跌期权和看涨期权之间的相对交易活动。当该比率下降时,表明看涨期权活动相对于看跌期权正在增加。
随着隐含波动率压缩,看跌期权持有者面临 increasing theta decay 和 mark-to-market pressure。随着下行 momentum 减弱,这些头寸的持有成本更高,促使交易者买回其对冲头寸。这种动态可以在保护性头寸平仓时产生 incremental 现货需求。
这种环境激励交易者为战术性上行波动布局,这一转变在看跌/看涨成交量比率中可见。自2月28日以来,该比率已从1.89降至0.4,标志着期权流的 significant reversal,并突显了市场布局上行的 growing willingness。
这种转变也反映在围绕75,000美元行权价的兴趣增加上。
波动率下降和看涨活动上升的结合表明市场正逐渐从防御性对冲转向更具 opportunistic 的上行头寸布局。
75,000美元成为关键伽马磁铁
转向看涨活动的趋势也可见于围绕75,000美元行权价不断增长的兴趣,该行权价已成为做市商最显著的负伽马水平。
75,000美元行权价目前承载着 substantial concentration of negative gamma,估计 across expiries 约为23亿美元,其中约18亿美元集中在3月27日到期日。
负伽马环境可以 amplify 价格 movements,因为做市商对冲流 reinforce prevailing trend。当价格接近这些区域时,对冲活动可以将市场拉向行权价,产生磁铁效应。过去一周,这个磁铁 effectively 从60,000至65,000美元区域上移至75,000美元行权价。
就目前而言,75,000美元是未来几个交易日中头寸和流动性可能 converge 的关键水平。
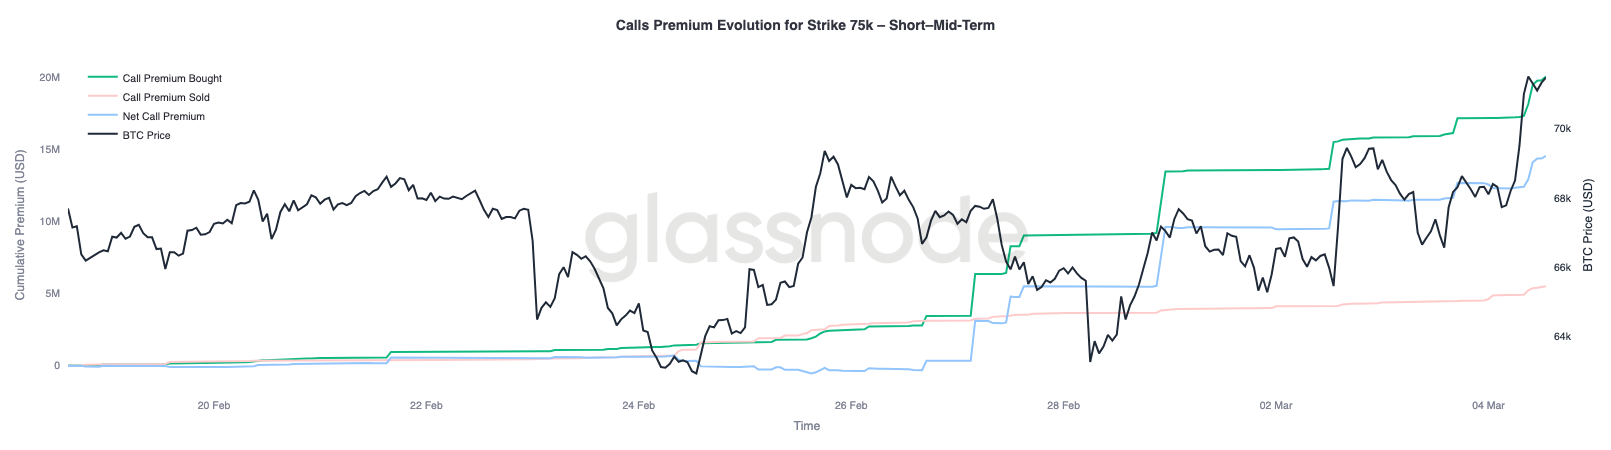
观察接下来三个月度到期日的75,000美元看涨期权的溢价动态,大约有1,450万美元的净看涨期权溢价被交易。这代表了买入溢价和卖出溢价之间的差额。
值得注意的是,近三分之二的净溢价是在过去一周积累的,助推了当前的反弹。
结论
比特币仍脆弱地整理在7万美元关口下方,多项指标表明买方动能已显著减弱。已实现利润急剧收缩,突显市场参与者在 elevated prices 交易的意愿降低,而盈利供应百分比的下降将当前行情置于历史上常与熊市早期阶段相关的背景中。同时,短期持有者成本基础 near 7万美元正成为关键的行为天花板,如果价格尝试近期复苏,该区域很可能充当派发区。
然而,在表面之下,一些稳定迹象开始显现。现货抛压在边际上正在缓和,ETF流出放缓且 early inflows returning,衍生品杠杆继续从系统中清除。在期权市场,随着恐慌性对冲消退和头寸转向上行敞口,波动率和偏斜正在正常化。随着75,000美元行权价成为主要的伽马磁铁,市场似乎正从压力驱动的抛售转向更平衡的头寸机制。这是否会演变成可持续的复苏,最终将取决于更强的现货需求回归以吸收上方供应。
免责声明:本报告不提供任何投资建议。所有数据仅用于信息和教育目的。任何投资决策均不应基于此处提供的信息,您应对自己的投资决策全权负责。
所呈现的交易所余额源自 Glassnode 全面的地址标签数据库,这些标签通过官方发布的交易所信息和专有聚类算法收集。虽然我们力求在呈现交易所余额时确保最高准确性,但请注意,这些数字可能并不总是包含交易所储备的全部,特别是当交易所不披露其官方地址时。我们敦促用户在使用这些指标时保持谨慎和判断力。Glassnode 对任何差异或潜在错误不承担责任。