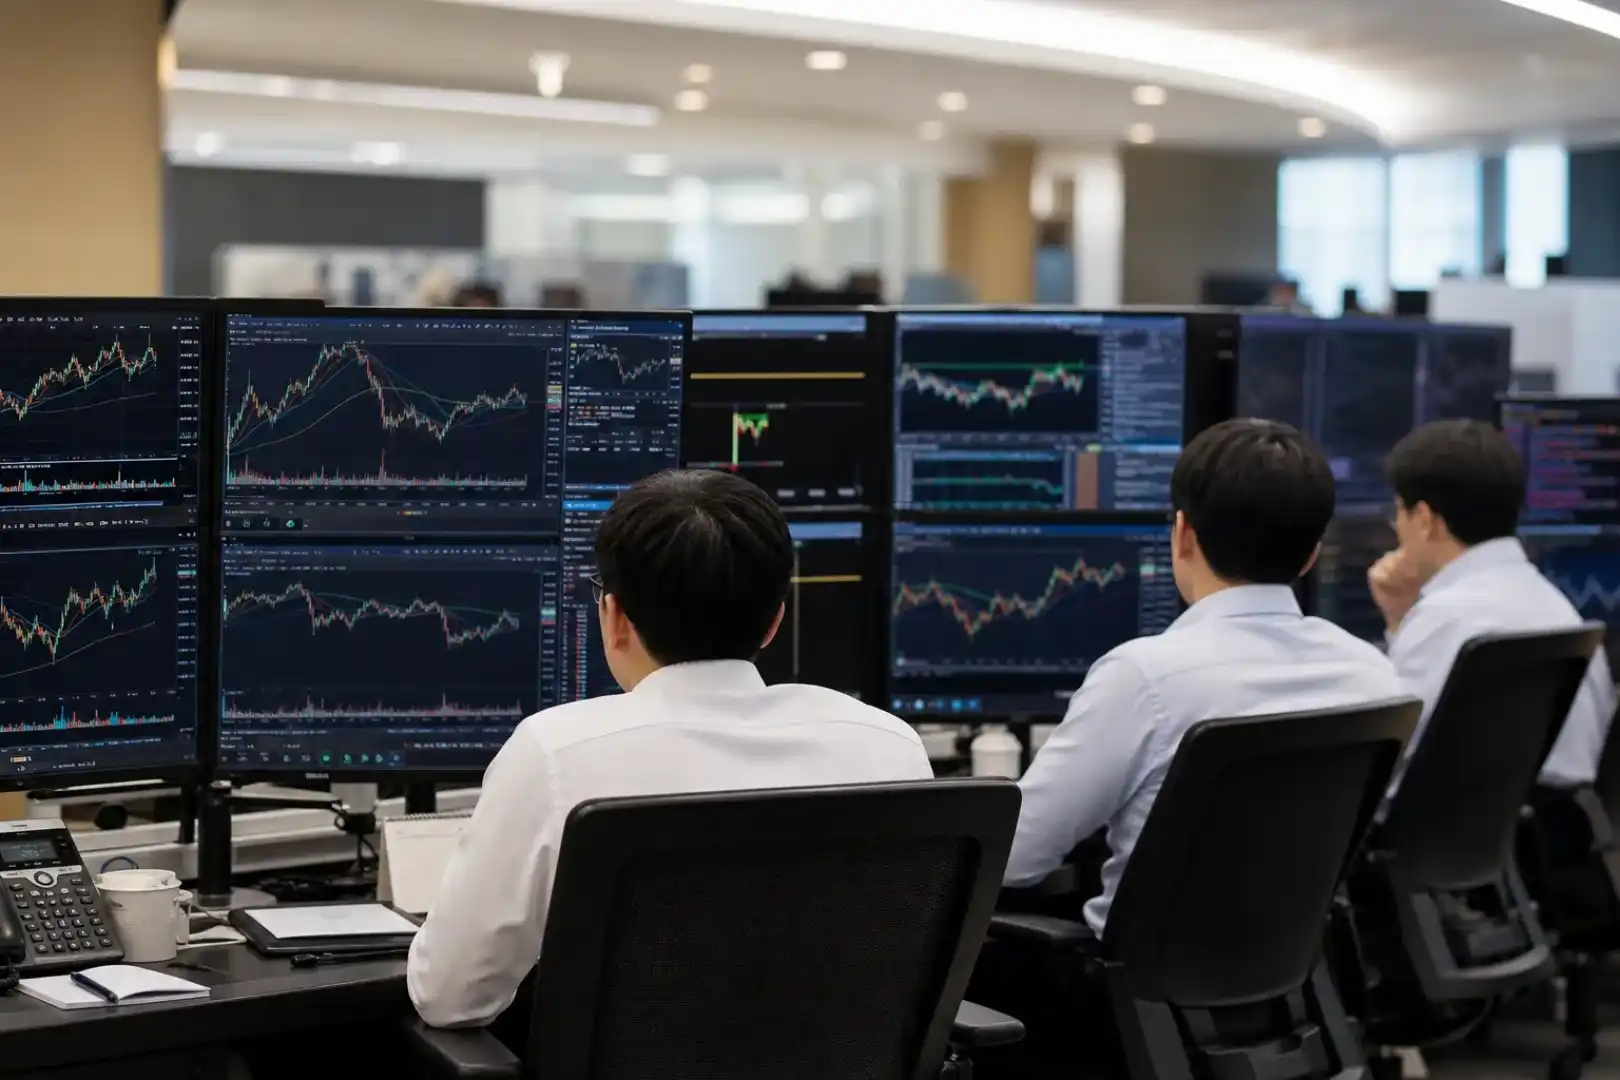
Trends in U.S. Stocks (August 18): U.S.-Iran Deal Prospects Dim, Major Indices See Two Consecutive Down Days, Chip Stocks Defy Market Decline

marsbitPublished on 2026-08-18Last updated on 2026-08-18

Abstract

**Market Overview:** On August 18th, U.S. stock indices declined for a second consecutive day. The S&P 500 fell 0.52%, the Dow dropped 0.51% to a two-week low, and the Nasdaq slipped 0.32%. The decline was driven by heightened geopolitical risk as U.S.-Iran negotiations reached a key deadline without an extension, dimming the prospect of a long-term agreement. **Key Drivers:** * **Geopolitics & Oil:** The failure to extend the U.S.-Iran memorandum led to a surge in oil prices, with Brent crude closing above $90/barrel for the first time in three weeks. * **Treasury Yields:** The 30-year U.S. Treasury yield hit a high not seen since 2007, driven by heavy corporate issuance (notably for AI investments) and ongoing fiscal deficits. * **Sector Performance:** While the "Magnificent Seven" tech giants all closed lower, semiconductor stocks bucked the trend. The Philadelphia Semiconductor Index rose 1.6%, led by memory chipmakers (e.g., SanDisk, Micron) and optical communication companies, as investors focused on the strong demand outlook for AI-related hardware. * **Currency & Safe Havens:** The U.S. Dollar Index fell for a third day, while the offshore Chinese Yuan hit a three-year high. Gold prices rose to a two-month peak, supported by safe-haven demand outweighing pressure from rising yields. Bitcoin also gained. **Outlook:** Market focus remains on potential escalation in the Middle East and its impact on oil, alongside continued scrutiny of AI-related earnings and d...

Written by: Trend Research

With the U.S.-Iran negotiation window expiring and long-term agreement prospects dimming, the three major U.S. stock indices closed lower for the second consecutive day, with the Dow hitting its lowest close in two weeks. The S&P 500 fell 0.52% to 7,745.06, the Dow Jones declined 0.51% to 53,459.78, and the Nasdaq dropped 0.32% to 26,644.911. The VIX rose 6.48% to 17.42. The "Magnificent Seven" all closed in the red, with Meta down 3.5% leading the losses. However, memory chip stocks and optical communication stocks bucked the trend and moved higher, with the Philadelphia Semiconductor Index rebounding 1.6% and re-entering a bull market. Middle East risks pushed U.S. Treasury yields higher, with the 30-year yield reaching its highest level since 2007. Prospects of a U.S.-Iran deal boosted oil prices, with Brent crude closing above the $90 mark for the first time in three weeks. Gold reached its highest closing level in over two months. The U.S. Dollar Index fell for the third straight day, while offshore USD/CNY broke through 6.74 intraday, reaching a new high in over three years. Market dynamics were clear: Geopolitical risks lifted oil prices and safe-haven assets, but the demand logic for AI chips continues to strengthen, prompting continued fund allocation to memory and optical communication sectors.

U.S.-Iran Negotiation Window Expires, Long-Term Deal Prospects Dim, Oil Prices Surpass $90

The core macro variable on Monday was geopolitics. The memorandum of understanding window for U.S.-Iran negotiations expired without an extension agreement. Trump stated he was in no hurry to end the war in Iran, did not seek to extend the U.S.-Iran MOU, said Iran "would not make the kind of deal I think is necessary," and warned of "bombing the hell" out of Oman if it obstructed negotiations. Iran was similarly firm, ruling out an extension of the MOU and stating it had set a final deadline for U.S. compliance.

With no signs of narrowing differences, oil prices surged. WTI crude for September delivery rose 2.55% to $84.50/barrel, reaching its highest level this month. Brent crude for October delivery rose 2.65% to $90.87/barrel, closing above the $90 mark for the first time in three weeks.

The "dark shipping" of Middle Eastern oil producers using transponder shutdowns to secretly transport crude through the Strait of Hormuz continues, reportedly exceeding 4 million barrels per day. However, this covert supply chain has not completely offset the geopolitical risk premium. Short-term upward momentum for oil prices remains driven by political factors rather than supply-demand fundamentals.

30-Year U.S. Treasury Yield Hits Highest Since 2007, Bond Selloff Continues

U.S. Treasury yields continued to climb. The 30-year yield briefly exceeded 5.31%, its highest since 2007. The 10-year yield rose about 3 basis points to approximately 4.72%, while the 2-year yield increased about 1 basis point to roughly 4.18%.

The core factor driving long-end yields higher is supply pressure. Companies are issuing bonds on a large scale to fund the AI boom; August's U.S. investment-grade corporate bond issuance has already reached $145.2 billion, surpassing the monthly record of $136 billion set in August 2020. Concurrently, the U.S. government's nearly $2 trillion annual fiscal deficit continues to boost Treasury supply.

Major overseas holders are also selling. U.S. Treasury Department data shows China and Japan led overseas sales of U.S. Treasuries in June, with both countries and the U.K. reducing holdings. China's holdings, after rebounding in May, fell by $25.9 billion month-over-month to $633.4 billion, their lowest level since 2008.

Bank of America's Hartnett noted in a recent report that with U.S. government debt approaching $40 trillion and the AI financing frenzy pushing corporate bond supply up 61% year-over-year, this is structurally crowding out Treasury buyers, with debt interest payments already at $1.4 trillion. Hartnett views going long on gold as the best hedge against dollar devaluation, bond market collapse, and political risk.

Chip Index Re-enters Bull Market, Memory and Optical Communication Stocks Lead Gains Against Trend

Rising Treasury yields pressured the Magnificent Seven, but the semiconductor sector, with its independent AI chip demand narrative, bucked the trend. The Philadelphia Semiconductor Index rebounded 1.6%. The preceding bear market lasted only 21 days, the shortest since March 2020.

Memory chip stocks performed strongest. SanDisk closed up nearly 9%, and Western Digital gained over 5%. Micron has risen 17.5% over the past five sessions. The market sees strong recent financial data disclosures from Anthropic and OpenAI as key catalysts, improving visibility into AI chip demand.

Optical communication stocks also advanced. Coherent closed up nearly 8%, and Lumentum gained 4.6%. Demand for high-speed optical interconnects from AI data centers continues to be validated, with funds continuing to concentrate on more certain AI hardware sub-sectors amid macro uncertainty.

SpaceX rebounded over 4%. Previously pressured by capital expenditure concerns, Monday's rebound shows market confidence in the long-term logic of AI infrastructure investment remains.

Magnificent Seven All Close Lower, Divergence Between Chips and Seven Widens

The "Magnificent Seven" all closed lower on Monday, acting as a major drag on the broader market. Meta fell 3.5%, leading the declines, with losses for the other six relatively moderate.

The collective weakness of the Seven occurred against a backdrop of persistently rising Treasury yields. Higher long-term interest rates pressure the discount rates used to value high-multiple growth stocks, prompting funds to temporarily withdraw from large-cap tech amid macro uncertainty.

However, this withdrawal is not a systematic exit. The strength in the chip index indicates funds are simply rotating within the tech sector, switching from the Seven to higher-certainty AI hardware sub-sectors.

Dollar Falls for Third Day, Yuan Hits Three-Year High, Gold Rises to Two-Month High on Safe-Haven Demand

The U.S. Dollar Index fell for the third consecutive day, hitting an intraday low not seen in over two months. Offshore USD/CNY broke through 6.74 intraday, reaching a high not seen in over three years. Gold closed at a new high of over two months, rising over 1% intraday; COMEX gold for August delivery closed up 0.85% at $4,417.8/ounce. While rising Treasury yields typically pressure gold, safe-haven demand driven by escalating geopolitical risks outweighed interest rate factors.

Bitcoin broke through $64,000 intraday, rising 3% from the day's low. Digital assets found support against a weaker dollar backdrop. COMEX silver for August delivery closed up 1.74% at $66.121/ounce.

What to Watch Today

Market focus on Tuesday will be in two directions.

First, subsequent developments in the U.S.-Iran situation. Following the MOU expiration, any new contacts or escalation in confrontation will directly impact oil prices and risk asset performance. Trump's "no hurry" stance suggests geopolitical risk premium will be difficult to eliminate in the short term.

Second, Baidu's earnings report and conference call. Key points will be the pulling effect of AI large models on cloud business and the recovery pace of advertising. With the Golden Dragon Index underperforming, Baidu's results will test whether global funds' stance on Chinese stocks is seeing marginal changes.


Trending Cryptos

Related Questions

QWhat were the main factors contributing to the rise in oil prices as mentioned in the article?

AThe main factor was the heightened geopolitical risk from the U.S.-Iran tensions. The article states that the negotiating window for the U.S.-Iran memorandum of understanding expired with no extension. Hardline statements from both sides, including warnings from Trump, dimmed prospects for a long-term agreement. This political uncertainty, rather than fundamental supply and demand, drove the risk premium in oil prices.

QWhy did U.S. Treasury yields, particularly the 30-year yield, rise significantly according to the article?

AAccording to the article, the 30-year U.S. Treasury yield rose to its highest level since 2007, driven primarily by supply pressures. Two key factors were cited: massive corporate debt issuance (a record for August) to fund AI investments, and continuous high issuance of government bonds to finance the U.S. deficit. Additionally, major foreign holders like China were reportedly selling U.S. Treasuries, reducing demand and pushing yields higher.

QHow did the Philadelphia Semiconductor Index perform relative to the broader market, and which specific chip sectors were highlighted?

AThe Philadelphia Semiconductor Index rebounded 1.6%, returning to a bull market after a very short bear market period. This performance was strong and went against the trend of the broader market, where major indices were down. The article specifically highlighted that memory chip stocks (like SanDisk, Western Digital, Micron) and optical communication stocks (like Coherent, Lumentum) were the leaders of this gain, driven by confidence in AI-related demand.

QWhat was the contrasting performance between the 'Magnificent Seven' tech stocks and the semiconductor sector?

AThe performance was contrasting or diverging. The 'Magnificent Seven' tech giants, including Meta, all closed lower, acting as a drag on the main indices. This was attributed to pressure from rising long-term bond yields, which negatively impact high-valuation growth stocks. Meanwhile, the semiconductor sector, particularly AI hardware segments, outperformed and closed higher. The article suggests this indicates money rotated within the tech sector from mega-cap tech into AI hardware perceived as having higher demand certainty.

QWhat were the price movements for key currencies and gold, and what were the driving forces behind them?

AThe U.S. Dollar Index fell for a third consecutive day, hitting a two-month low. Offshore Chinese Yuan (CNH) strengthened, breaking past 6.74 per dollar to a three-year high. Gold prices rose over 1% to close at a two-month high. The article attributes gold's strength to strong safe-haven demand due to heightened geopolitical risk, which outweighed the typical negative pressure from rising U.S. Treasury yields. The movements in currency and gold were partly linked to dollar weakness and risk-off sentiment.

Related Reads

South Korean Retail Investors 'Move from Seoul to Wall Street': Buying SK Hynix ADR, Betting on Triple-Leverage ETF

A surge of Korean retail investors is shifting funds from the volatile Seoul market to Wall Street, intensifying their bets on the AI theme through unconventional and high-risk instruments. Data shows Korean investors were net buyers of about $4.5 billion in US stocks in July, nearing a yearly peak. A notable trend is their purchase of approximately $840 million worth of SK Hynix American Depositary Receipts (ADRs), despite a significant 10% premium over the company's domestic shares, leading analysts to label the move as speculative and irrational. Simultaneously, Korean traders are heavily favoring leveraged ETFs. The triple-leveraged semiconductor ETF SOXL was the most-bought US product in July, with leveraged products occupying four of the top ten spots. Experts note that this shift in geography does not represent a diversification of risk; instead, investors are merely expressing the same concentrated bet on AI hardware through different, often riskier, US-listed vehicles. Analysts warn that while this capital inflow is unlikely to systemically impact the vast US institutional market, it risks creating localized distortions and amplifying volatility, particularly in the targeted sectors and instruments. The move follows a sharp correction in the Korean market, where high leverage in semiconductor stocks and related ETFs had previously led to significant losses, prompting this search for alternative avenues to chase the AI narrative.

marsbit18m ago

South Korean Retail Investors 'Move from Seoul to Wall Street': Buying SK Hynix ADR, Betting on Triple-Leverage ETF

marsbit18m ago

Bithumb's First Half Report: Net Loss Exceeds $76 Million, Where Did the Profits Go?

**Title: Bithumb H1 2026 Report: Net Loss Exceeds $76M – Where Did the Profits Go?** Despite a headline net loss of approximately 108.7 billion KRW (~$76.44 million) for the first half of 2026, a detailed breakdown reveals Bithumb's core exchange business remained profitable. The significant loss was primarily driven by two major non-operating items: substantial losses on the disposal and valuation of the company's own cryptocurrency holdings (net loss ~$48.21 million) and a sharp increase in litigation provisions (~$25.93 million), largely linked to a regulatory fine. Operating revenue fell 48.7% year-on-year to ~$119 million, almost entirely from transaction fees, as market activity cooled. While the company drastically cut marketing and subsidy expenses by ~70% to protect margins, more rigid costs like payment processing and salaries declined only modestly. This highlights the vulnerability of its highly fee-dependent revenue model in a down market. Total assets decreased by ~$584 million, but this was largely attributable to an ~86% drop in client KRW deposits. The market value of client crypto assets under custody also fell (~32.7%), partly influenced by declining cryptocurrency prices rather than solely client withdrawals. In summary, the report indicates underlying exchange profitability was eroded by significant crypto asset losses and mounting regulatory/legal costs, against a backdrop of declining trading revenue. Future focus should be on revenue recovery, managing crypto-related损益, and the ongoing impact of regulatory challenges.

marsbit37m ago

Bithumb's First Half Report: Net Loss Exceeds $76 Million, Where Did the Profits Go?

marsbit37m ago

BitMart's Final 9 Days: A True Exchange Crisis Is Never About Shutting Down

BitMart's Final 9 Days: A True Exchange Crisis Is Not About Shutting Down On August 17, 2026, with just 9 days until BitMart's scheduled cessation of trading, the focus shifted from the platform's orderly closure to serious questions about user withdrawals, platform solvency, employee payments, and reserve transparency. Stakeholders, claiming to represent users and staff, publicly demanded asset/liability disclosures, explanations for withdrawal delays, a user repayment plan, and an independent audit, setting an August 19 deadline. While BitMart CEO Sheldon Lee denied allegations of insolvency or wrongdoing, the controversy highlighted a core vulnerability of centralized exchanges (CEXs). When an exchange announces its shutdown, normal user behavior changes dramatically, triggering a mass withdrawal event—the ultimate stress test for its liquidity and custodial integrity. The key question becomes not whether the platform has assets, but whether it holds sufficient *liquid* assets to cover all user liabilities on demand. The article argues that the trust placed in CEXs is based on the convenience they provide, abstracting users from direct control of their private keys. This trust is rarely questioned during normal operations but becomes critically exposed during a wind-down. The situation underscores the limitations of simple Proof of Reserves, which shows "what we have" but not the crucial "what we owe." True financial credibility requires transparent, auditable data on assets, liabilities, and segregated user funds. BitMart's situation reflects a broader, often overlooked issue in the crypto industry: while there is extensive focus on growth mechanisms for exchanges, there is little discussion or established protocol for a safe and transparent "exit mechanism." The final measure of an exchange's integrity, the article concludes, is not its user count or trading volume during a bull market, but its ability to ensure every last user can successfully withdraw their assets when the doors are closing. The outcome will be determined not by statements, but by whether the final user's funds securely leave the platform.

marsbit1h ago

BitMart's Final 9 Days: A True Exchange Crisis Is Never About Shutting Down

marsbit1h ago

Don't Speculate on 100x Coins, Just Bet on 'Cash Cows': Which Projects Are Worth Dollar-Cost Averaging in the Bear Market?

In a bearish crypto market, finding sustainable investments is more prudent than chasing speculative meme coins. This article analyzes projects generating consistent revenue, highlighting them as potential "cash cows" for long-term dollar-cost averaging (DCA). The top performers are "picks-and-shovels" plays. **Pump.fun**, a Solana-based meme coin launchpad, leads with $415.3M in monthly revenue, profiting from a 1.25% fee on token transactions. Despite market volatility, it has averaged tens of millions in monthly income in 2024. Perpetual DEX **Hyperliquid** stands out as a "bear market star," accumulating ~$352M in revenue over seven months. Its model funnels ~99% of fees into buying back and permanently burning its HYPE token. Established giants are also adapting. **Uniswap**, after enabling its fee switch, now earns protocol revenue (e.g., $5.6M recently), which is used to buy back and burn UNI, giving the token direct value accrual. Similarly, oracle provider **Chainlink** generates stable monthly revenue (~$4.57M recently) from its essential data, cross-chain, and automation services. Its new Payment Abstraction feature automatically converts service fees into LINK, accruing value in its treasury. The core thesis is clear: in a downturn, focus on projects with proven, resilient business models—those acting as essential infrastructure or capturing consistent transaction fees—rather than speculative narratives.

marsbit1h ago

Don't Speculate on 100x Coins, Just Bet on 'Cash Cows': Which Projects Are Worth Dollar-Cost Averaging in the Bear Market?

marsbit1h ago

Trading

Spot

Hot Articles

How to Buy CHIP

Welcome to HTX.com! We've made purchasing USD.AI (CHIP) simple and convenient. Follow our step-by-step guide to embark on your crypto journey.Step 1: Create Your HTX AccountUse your email or phone number to sign up for a free account on HTX. Experience a hassle-free registration journey and unlock all features.Get My AccountStep 2: Go to Buy Crypto and Choose Your Payment MethodCredit/Debit Card: Use your Visa or Mastercard to buy USD.AI (CHIP) instantly.Balance: Use funds from your HTX account balance to trade seamlessly.Third Parties: We've added popular payment methods such as Google Pay and Apple Pay to enhance convenience.P2P: Trade directly with other users on HTX.Over-the-Counter (OTC): We offer tailor-made services and competitive exchange rates for traders.Step 3: Store Your USD.AI (CHIP)After purchasing your USD.AI (CHIP), store it in your HTX account. Alternatively, you can send it elsewhere via blockchain transfer or use it to trade other cryptocurrencies.Step 4: Trade USD.AI (CHIP)Easily trade USD.AI (CHIP) on HTX's spot market. Simply access your account, select your trading pair, execute your trades, and monitor in real-time. We offer a user-friendly experience for both beginners and seasoned traders.

4.3k Total ViewsPublished 2026.04.21Updated 2026.06.02

How to Buy CHIP

Discussions

Welcome to the HTX Community. Here, you can stay informed about the latest platform developments and gain access to professional market insights. Users' opinions on the price of CHIP (CHIP) are presented below.

活动图片