Trading Volume Increased by 2.5x, Why Did Circle's Revenue Only Grow by 7%?

marsbitPublished on 2026-08-05Last updated on 2026-08-05

Abstract

Circle's Q2 performance presents a seemingly contradictory picture: the transaction volume of its stablecoin USDC surged 151% year-over-year to $14.8 trillion, while its "Total Revenue & Reserve Revenue" grew by only 7% to $701 million. This discrepancy highlights the core of Circle's business model. Revenue is primarily driven not by transaction volume, but by the average amount of USDC in circulation and the yield generated from its reserves. Key points: 1. **Revenue Drivers:** Over 90% of revenue comes from "reserve income," which is a function of average USDC circulation (up 25% YoY) and the reserve yield (which fell by 66 basis points). The net effect was a mere ~5% increase in reserve income. 2. **Transaction vs. Revenue:** High transaction volume indicates robust usage of USDC for payments and settlements, but does not translate directly to revenue. It must first convert into a sustained, average circulating balance. 3. **Cost Structure:** After accounting for distribution and other costs, the metric "Revenue Less Direct Costs" (RLDC) grew faster than total revenue, with its margin improving. However, rising operating expenses (up 23% YoY) meant that Adjusted EBITDA growth was limited to 8%. 4. **New Initiatives:** Circle reported progress on new networks like the Circle Payments Network and upcoming products (Arc, Agent Stack), but these are currently measured by adoption metrics (e.g., transaction run-rate, number of services) rather than material revenue contri...

Stablecoin issuer Circle reported somewhat paradoxical second-quarter results. The on-chain transaction volume of USDC reached $14.8 trillion, while "Total Revenue and Reserve Revenue" stood at $701 million. According to Circle's unaudited earnings press release accompanying its Form 8-K, these two figures were placed in the same announcement, easily leading people to view trading volume as a direct amplifier of revenue.

Yet, when compared year-over-year, transaction volume grew by 151%, while revenue only increased by 7%. These are not two malfunctioning data lines; they reveal the true contours of Circle's business model. On-chain transaction volume records the intensity of USDC usage, while the income statement cares more about how much USDC remains in the system on average and how much return that reserve can generate in the quarter.

On-Chain Transactions Are Busy, So Why Aren't the Books Keeping Up?
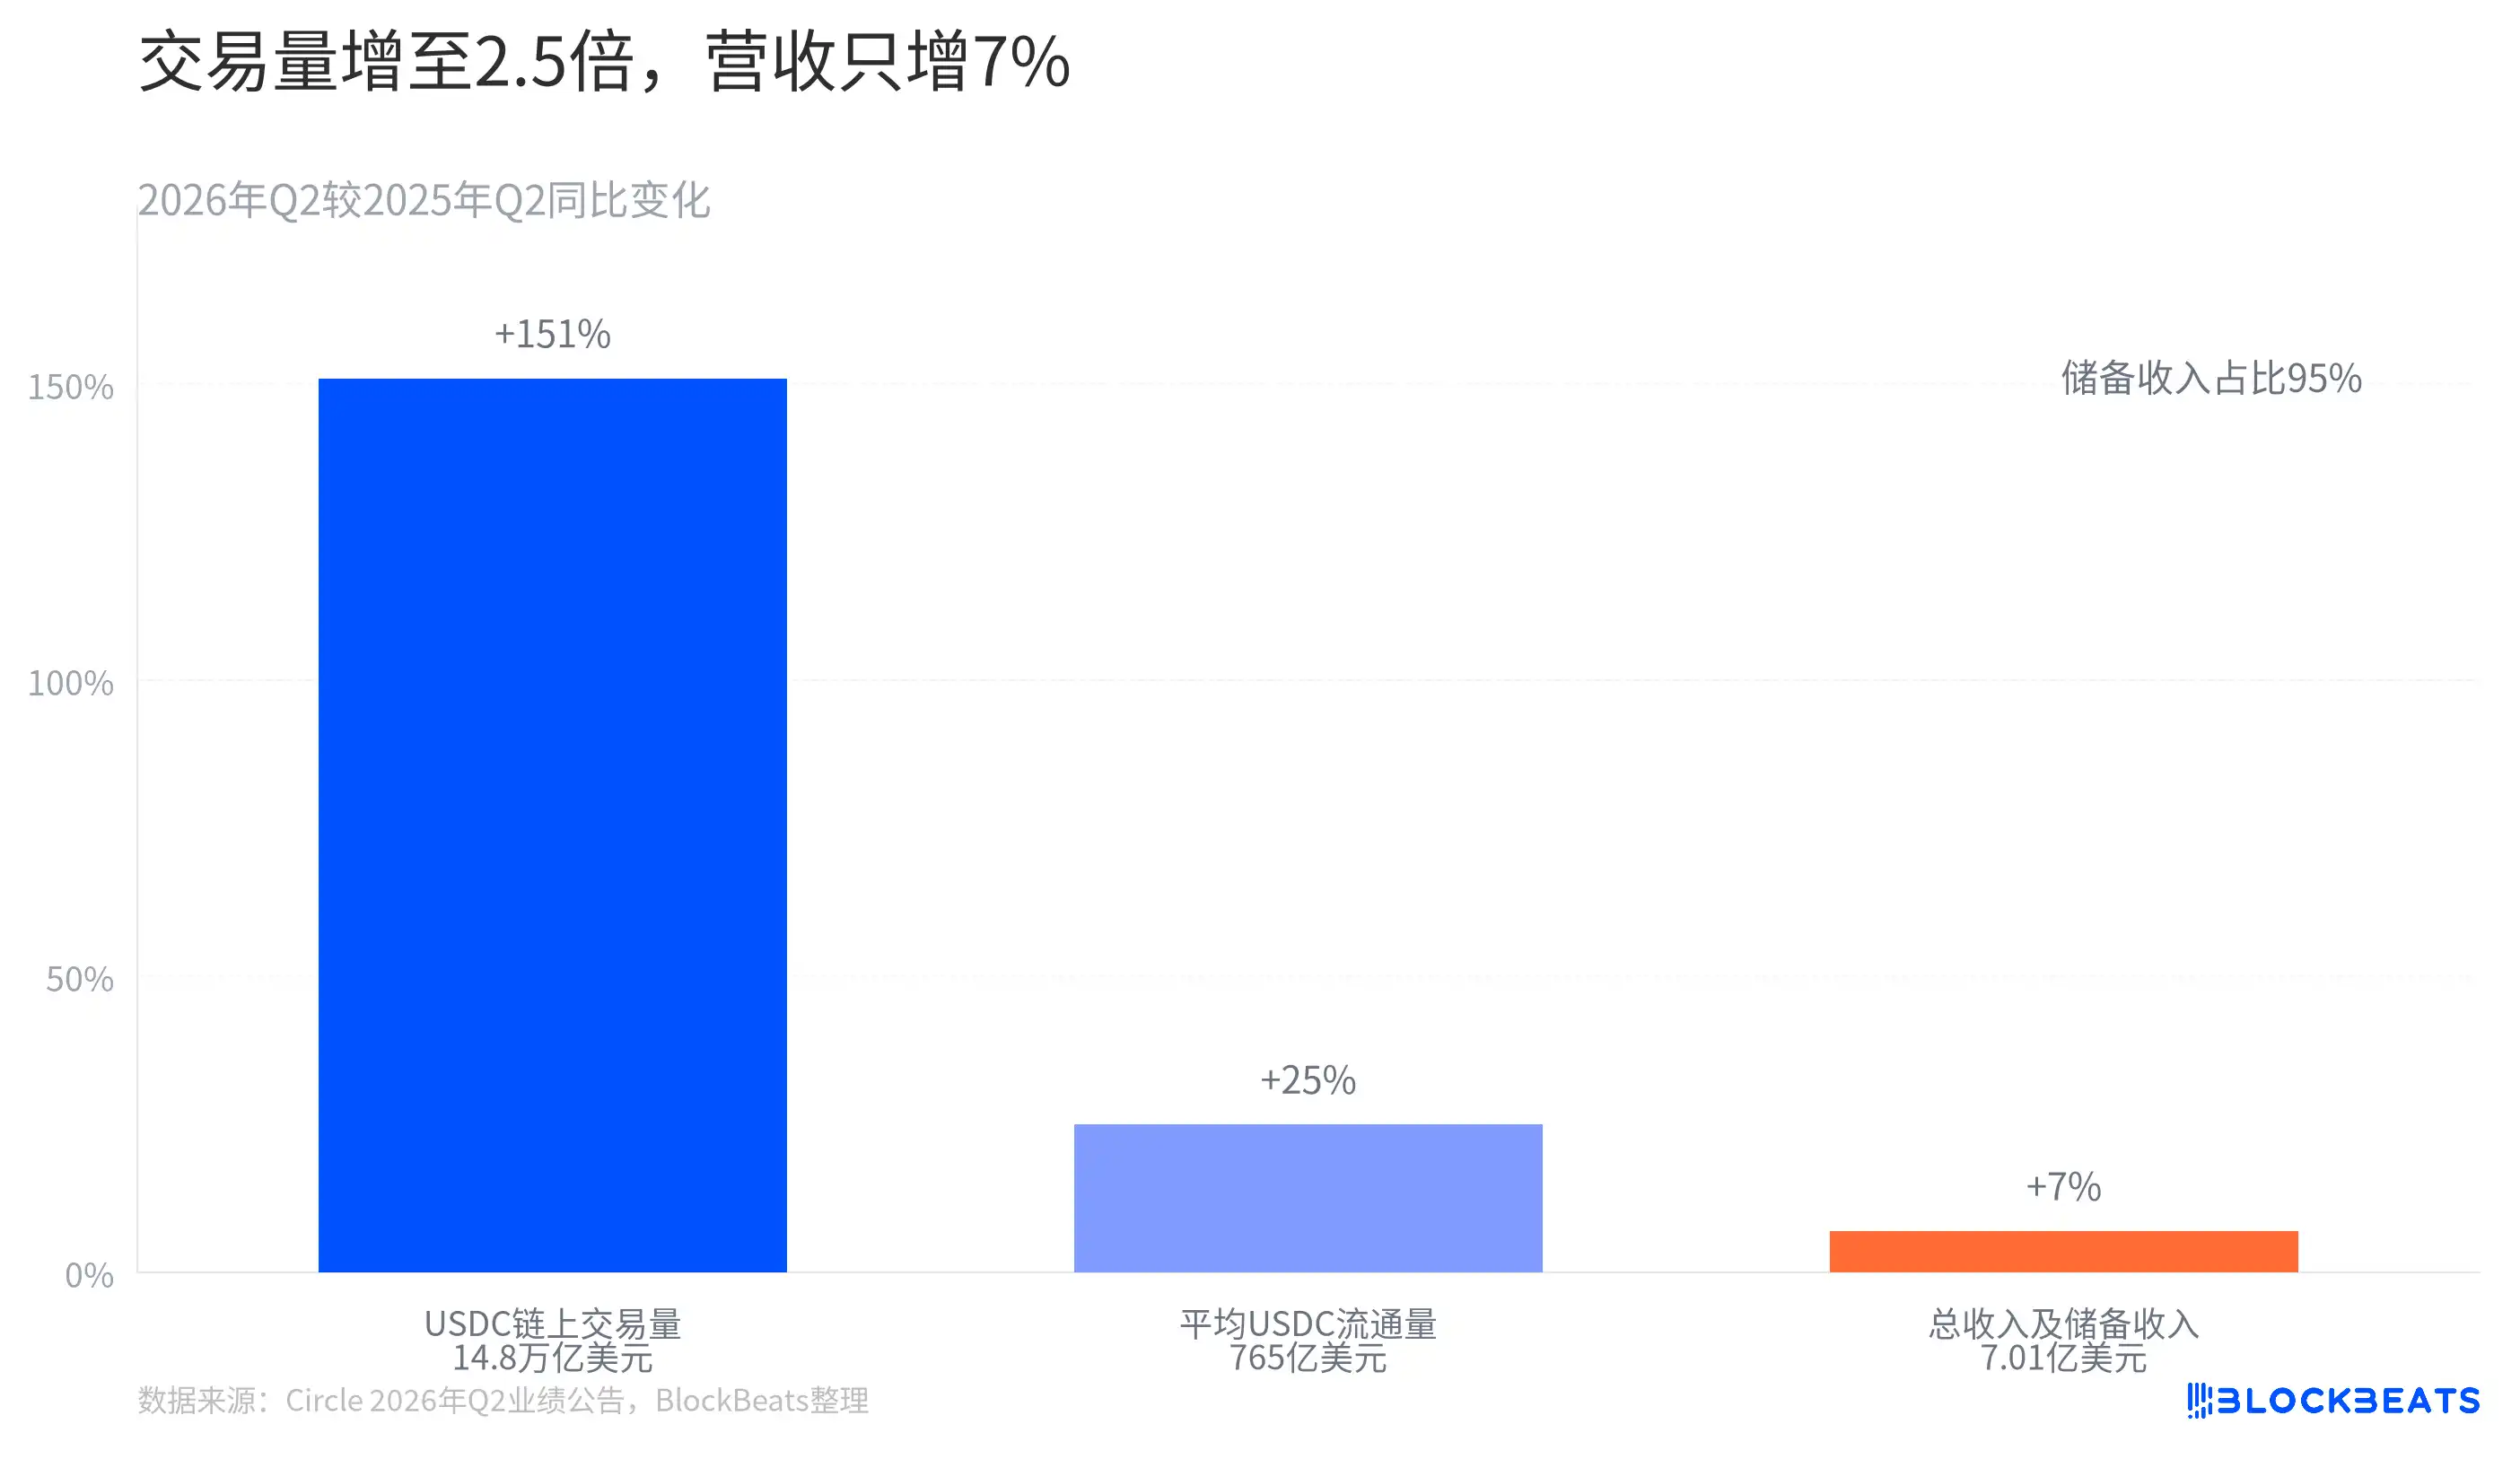
Figure 1 places three growth rates together, making the gap immediately concrete. Transaction volume is the largest blue bar this quarter, average USDC circulation sits in the middle, and revenue growth is the smallest. According to Circle's announcement, reserve revenue accounts for over 90% of "Total Revenue and Reserve Revenue". For these results, transaction volume is not the variable closest to revenue.

This relationship is not hard to understand. An on-chain transfer can indicate that USDC was mobilized for payment, exchange, or settlement, but it does not mean Circle earns a proportional fee for that specific transfer. The announcement does not list on-chain transaction volume as a revenue calculation metric. Instead, reserve revenue changes with average circulation and reserve yield—these two are the most direct levers for quarterly revenue.

Circle's other revenue for the quarter was $34 million. According to the company's announcement, the year-over-year growth primarily came from subscription and service revenue. However, the announcement does not break out Circle Payments Network, Arc, or Agent Stack as separate revenue items. Directly converting the operational progress of these products into revenue would skip a segment the company has not yet disclosed.

Why Didn't the Extra USDC Bring a Proportionate Increase in Revenue?
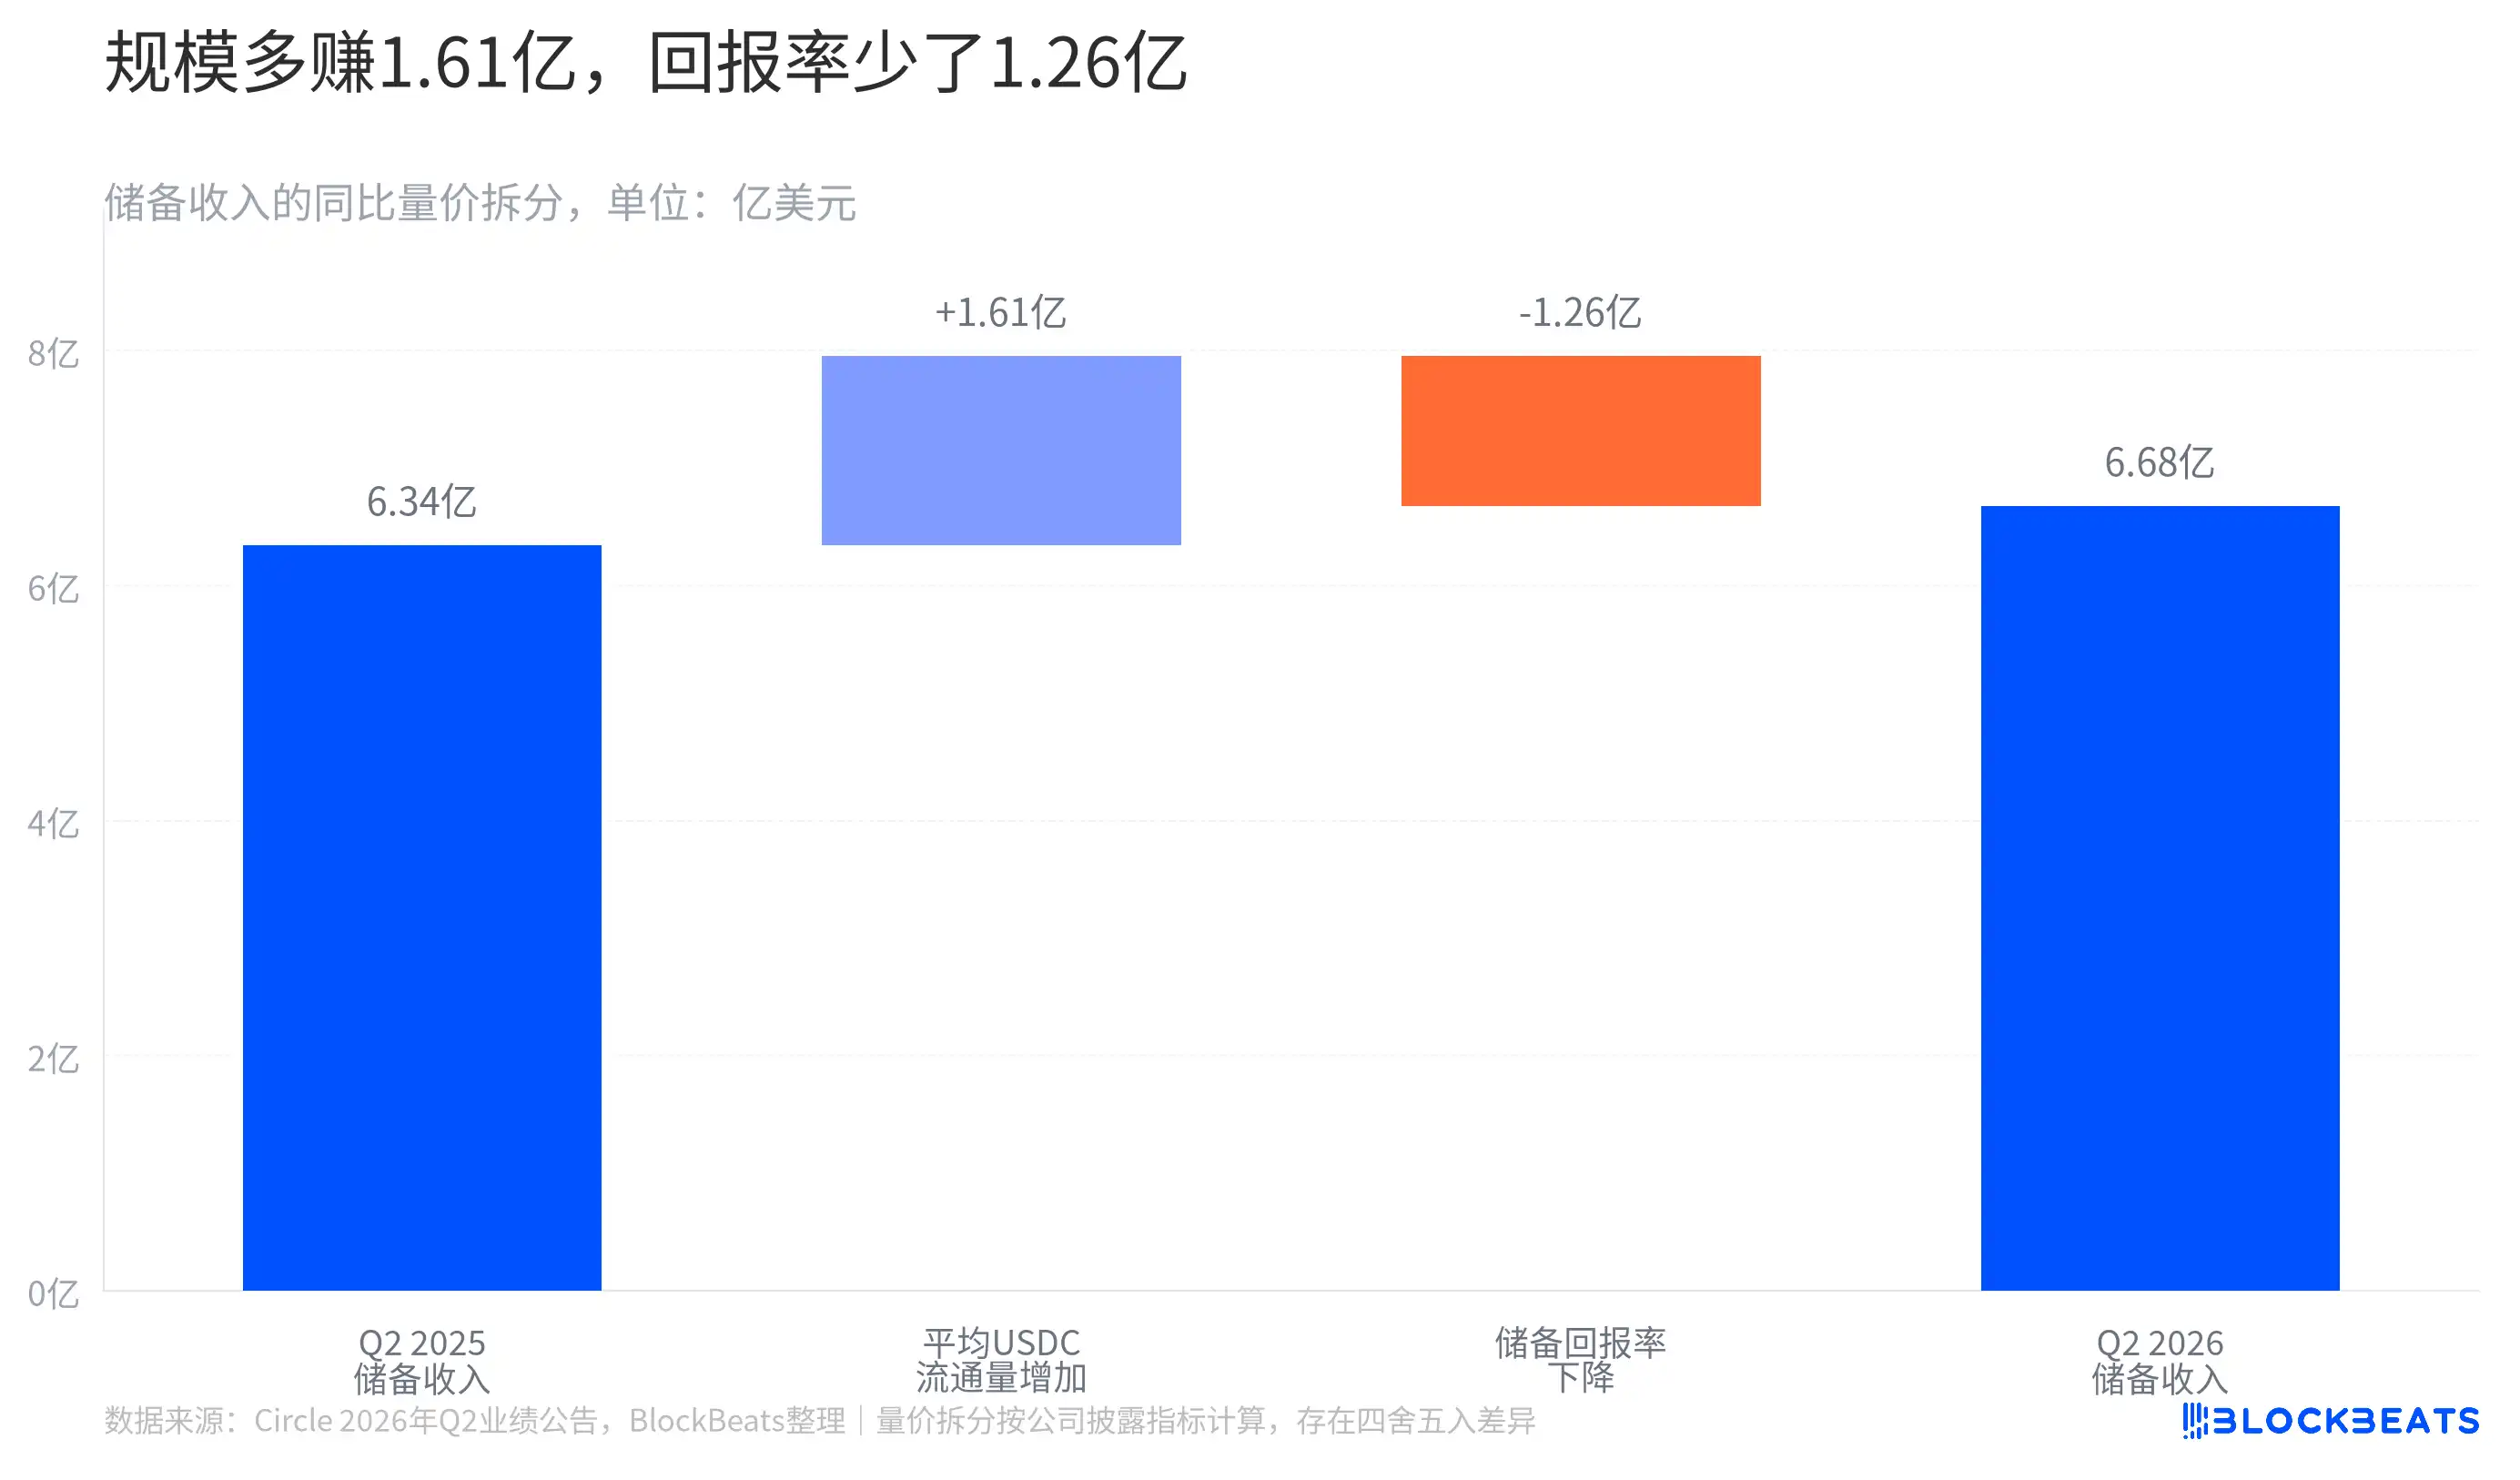
Circle's explanation for reserve revenue is straightforward. According to Exhibit 99.1 of the 8-K, average USDC circulation increased by 25% year-over-year, but the reserve yield decreased by 66 basis points. One quantity grew larger, the other grew thinner, resulting in reserve revenue increasing by only about 5% compared to the same period last year.

Figure 2 breaks this down into volume and yield. The two segments of change in the chart are not a formal attribution separately disclosed by Circle but are static, quarterly estimates based on the average circulation and reserve yield disclosed by the company. If one only looks at the growth in average balance, reserve revenue would appear significantly elevated. After accounting for the yield decline, almost all of that new revenue increment was erased.

It can be seen as a growing deposit. More dollars are deposited, but each dollar generates a thinner return for the quarter. The heat of on-chain activity hasn't disappeared; it must first be converted into persistently circulating USDC, then enter Circle's income statement through the reserve yield. This process is much slower than a single transaction and is also more susceptible to the interest rate environment.

This also explains why the same announcement can simultaneously contain statements like "the network is expanding" and "the current interest rate environment is slowing revenue growth." The former refers to USDC usage and distribution, the latter to the pricing of reserve returns. Both can be true simultaneously.

Before Revenue Comes In, It Must Pass Through Distribution Costs
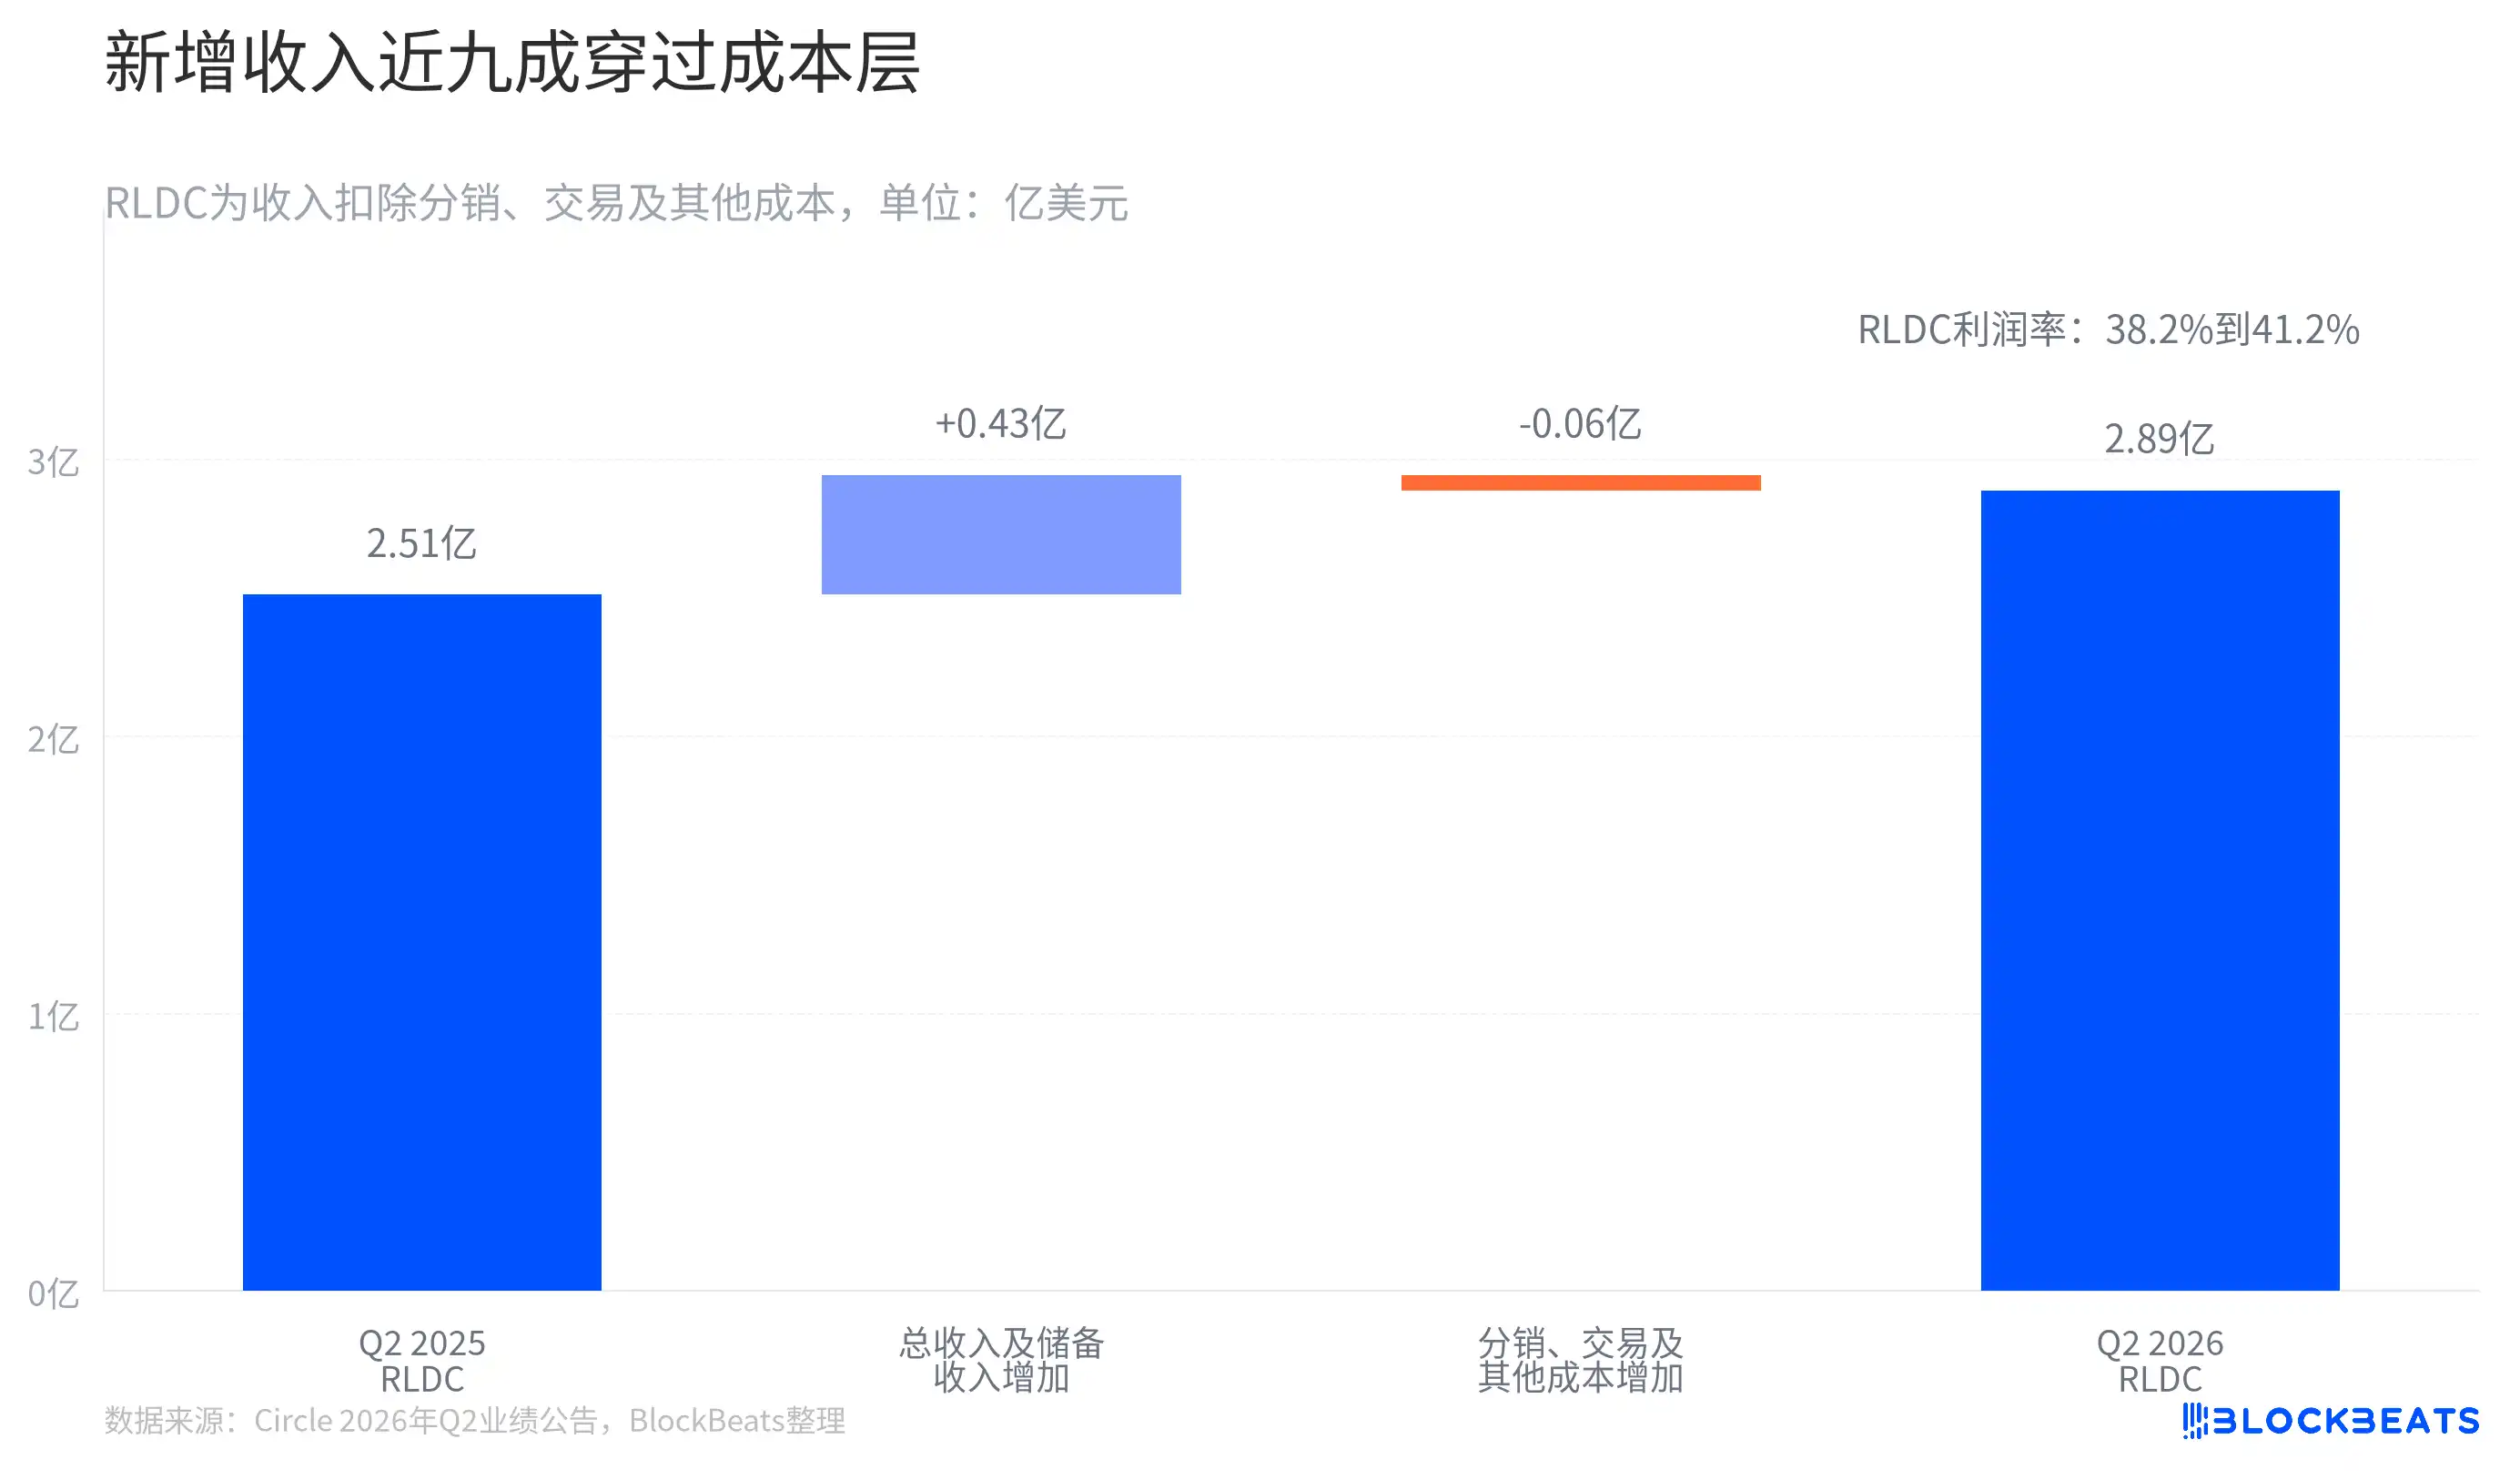
Revenue reaching Circle's hands also does not equal operating profit. The company refers to the intermediate metric after deducting "Total Distribution, Transaction and Other Costs" from "Total Revenue and Reserve Revenue" as RLDC. In Figure 3, this number increased from $251 million to $289 million. According to the company's announcement, its growth rate was faster than that of Total Revenue and Reserve Revenue.

The most easily misinterpreted element in this chart is the short orange bar. It does not mean Circle paid less in costs; rather, the year-over-year increase in costs was much smaller than the increase in revenue. Based on calculations using the unrounded announcement data, nearly 90% of the incremental revenue passed through this cost layer, becoming RLDC increment. The RLDC margin also increased from 38.2% to 41.2%.

However, RLDC is not gross profit, let alone adjusted EBITDA or net profit. Operating expenses such as R&D, infrastructure, and personnel costs still follow. According to Circle's announcement, adjusted operating expenses increased by 23% year-over-year, while adjusted EBITDA only grew by 8%. Directly interpreting the improvement after distribution costs as "all new revenue stayed with the company" would be reading the financial statements a step too fast.

The quarter-over-quarter rhythm is also not as lively as the year-over-year headlines suggest. According to Circle's Q1 earnings announcement and this quarter's announcement, average USDC circulation only increased by 1.7%, and Total Revenue and Reserve Revenue only increased by 1.0%.

During the same period, adjusted operating expenses increased by 7.9%, while adjusted EBITDA decreased by 5.2%. This set of changes does not indicate business stagnation but hints at another reality. When USDC circulation only shifts slightly between quarters, investments in new products and infrastructure land on the expense statement first; the profit statement does not automatically accelerate in sync.

The New Network Shows Signals, But Revenue Boundaries Remain Beyond the Financials

Circle provided many network-level updates this quarter. According to the company's announcement, as of quarter-end, the Circle Payments Network's annualized transaction volume over the past 30 days reached $14.7 billion, with 175 financial institutions onboarded. This is a metric about network density, not quarterly revenue, and cannot be compared using the same yardstick as USDC's on-chain transaction volume.

The announcement also stated that Arc is scheduled to launch its public mainnet on September 16th, and Agent Stack already has over 900 paid services. The former remains a disclosed launch plan by the company; the latter is a service count, not a client count, revenue amount, or profit. They indicate Circle is building out infrastructure beyond stablecoin issuance, but the disclosures this quarter are insufficient to verify that these products have become a second revenue curve.

Circle's second-quarter results are, first and foremost, a scorecard determined jointly by average USDC circulation, reserve yield, and the structure of distribution costs. Transaction volume proves USDC is being used frequently; the income statement answers how that usage navigates through the two layers of reserves and cost structure.


Trending Cryptos

Related Questions

QWhy did Circle's revenue only increase by 7% when the on-chain transaction volume of USDC grew by 151%?

ACircle's revenue primarily depends on 'reserve income,' which is generated from the average amount of USDC held in its ecosystem and the yield from the reserves backing those stablecoins. While transaction volume indicates usage frequency, it does not directly translate to revenue. In this quarter, the average circulating supply of USDC grew 25%, but the reserve yield decreased by 66 basis points. The significant growth in transaction volume did not proportionally increase the average stable USDC balance held, and the lower yield on reserves further limited revenue growth.

QWhat are the two main factors that directly drive Circle's reserve income, as explained in the article?

AThe two main factors directly driving Circle's reserve income are: 1) The average circulating supply of USDC, which grew by 25% year-over-year. 2) The reserve yield (or return rate) on the assets backing USDC, which decreased by 66 basis points year-over-year. The positive effect of a larger balance was largely offset by the decline in yield.

QWhat is the key difference between the metrics 'on-chain transaction volume' and 'average USDC circulation' in relation to Circle's financial performance?

AOn-chain transaction volume measures the total value of all USDC transfers on blockchains, indicating the intensity of its use for payments, trading, or settlements. Average USDC circulation refers to the typical amount of USDC held by users over a period, representing the stable pool of funds generating reserve yield for Circle. Revenue is closely tied to the latter, not the former.

QWhat does the RLDC metric represent, and why did its growth outpace the growth of total revenue & reserve income?

ARLDC stands for 'Revenue Less Distribution, Trading & Other Costs.' It represents the revenue after subtracting costs directly associated with distributing USDC (like partner incentives) and trading activities. Its growth (15%) outpaced total revenue growth (7%) because the incremental costs associated with the new revenue were relatively low, allowing a larger portion of the new income to flow through to this metric. This improved the RLDC margin from 38.2% to 41.2%.

QAccording to the article, why can't the operational progress of Circle's new products (like Payments Network, Arc) be directly translated into current revenue figures?

AThe operational progress of new products like Circle Payments Network and Arc cannot be directly translated into current revenue because the disclosed metrics are network-level indicators (e.g., annualized transaction volume, number of connected institutions, launch dates, number of services) rather than recognized revenue, profit, or customer count. These metrics show infrastructure development and network density but do not yet constitute a verifiable second revenue stream for the company in the current financial period.

Related Reads

ChangXin's "Peer": The Fate of Fujian Jinhua Integrated Circuit Co., Ltd. Is Regrettable

China's DRAM industry saw a pivotal moment with ChangXin's (CXMT) successful IPO. However, the fate of its 2016 counterpart, Fujian Jinhua Integrated Circuit, offers a stark contrast. Both were founded the same year with similar missions, massive investment, and 12-inch wafer fab goals to break into the DRAM market dominated by Samsung, SK Hynix, and Micron. Fujian Jinhua initially progressed faster by partnering with Taiwan's United Microelectronics Corporation (UMC) for 32nm DRAM technology. This strategy, however, led to a protracted legal battle. In 2017, Micron sued UMC and Jinhua for trade secret theft. The situation escalated in October 2018 when the U.S. Commerce Department added Fujian Jinhua to its Entity List, citing its imminent mass production as a threat. This resulted in an immediate halt of equipment, software, and technical support from American suppliers, followed by UMC suspending cooperation. Although Jinhua was eventually cleared of criminal charges in late 2023 after a nearly six-year legal saga, it missed the critical industry growth window. In contrast, ChangXin took a different path from the start, focusing on building its own R&D system and securing intellectual property, notably through a license for former Qimonda patents. While also facing U.S. scrutiny and initial heavy losses, ChangXin benefited from a more mature domestic supply chain when it reached mass production. It achieved profitability in 2025 and represents the rise of China's DRAM industry. Jinhua's story is a crucial lesson. It was the first Chinese DRAM company to confront the complex realities of international IP disputes, export controls, and supply chain vulnerabilities. Today, it has resumed operations with a 40,000 wafers-per-month capacity, aiming for 60,000. While it missed its initial opportunity, its experience informed the strategic evolution of later Chinese semiconductor firms.

marsbitJust now

ChangXin's "Peer": The Fate of Fujian Jinhua Integrated Circuit Co., Ltd. Is Regrettable

marsbitJust now

Crypto Fear and Greed Index Rises Over Last 24 Hours! Has It Exited the Fear Zone? Here are the Details

The Crypto Fear and Greed Index, a key indicator measuring investor sentiment in the cryptocurrency market, showed a limited recovery over the past 24 hours. According to data from CoinMarketCap, the index rose by 2 points to reach 37. Despite this increase, the indicator remains in the "Fear" zone, reflecting a continued cautious approach among investors. The index, which ranges from 0 (extreme fear) to 100 (extreme greed), suggests that while there is a slight improvement in investor confidence, market participants are still largely risk-averse. CoinMarketCap calculates the index by considering factors such as the price movements of the top 10 cryptocurrencies, overall market volatility, derivatives market data (like put/call ratios), stablecoin supply ratios, and user search data. Analysts note that the modest index rise points to a slight easing of market panic. However, its persistence in the fear zone indicates ongoing investor caution due to macroeconomic events, interest rate policies, and regulatory uncertainty. Experts suggest that for a sustained improvement in sentiment, increased trading volumes and stronger institutional capital inflows are necessary. Key factors expected to influence market mood in the coming period include capital flows into spot Bitcoin and Ethereum ETFs and developments in global monetary policy. While the index alone is not a sufficient tool for investment decisions, its potential to exit the fear zone is seen as a significant signal for the future direction of the crypto market.

cryptonews.ru1m ago

Crypto Fear and Greed Index Rises Over Last 24 Hours! Has It Exited the Fear Zone? Here are the Details

cryptonews.ru1m ago

Playing the "Decoupling" Card Again? Domestic Optical Modules Face a Stress Test

The U.S. Federal Communications Commission (FCC) is reportedly drafting a ban on importing new models of Chinese-made optical transceiver modules, with a potential implementation target of 2026. This "decoupling" move comes as Chinese firms, led by industry leaders like Zhongji Innolight and Eoptolink, dominate the global optical module market with over 60% share, and hold an even larger position in the high-speed 800G and 1.6T segments critical for AI data centers. Market reactions were mixed: U.S. optical module stocks initially rose, while Chinese A-shares opened lower but largely recovered by the close. Analysis suggests a complete U.S. decoupling from Chinese modules faces significant hurdles. North American cloud giants (Meta, Google, Microsoft, Amazon) and NVIDIA have massive demand for high-speed modules, estimated at around 40 million units in 2026. U.S. manufacturers' combined monthly production capacity for these modules is less than one-fifth that of a single major Chinese player like Zhongji Innolight, which reported production of 23.76 million units in 2025. Chinese companies are heavily reliant on the U.S. market, with over 90% of revenue for top firms coming from overseas, primarily the U.S. However, they have begun mitigating risks by establishing assembly plants in Southeast Asia and Mexico. Industry observers note the final impact depends on whether any potential U.S. restrictions target specific companies or products based on origin. Past U.S. sanctions on Chinese tech firms have often spurred increased domestic R&D and market diversification. Despite initial stock volatility, shares of major Chinese optical module companies pared losses, indicating market belief in the sector's resilience and the practical difficulties of abruptly replacing Chinese supply.

marsbit44m ago

Playing the "Decoupling" Card Again? Domestic Optical Modules Face a Stress Test

marsbit44m ago

When the Competition in Chip Manufacturing Equipment Stops Being Just About Who Is More Advanced

The competition in chip manufacturing equipment is no longer solely about who has the most advanced technology. While performance, yield, and cost remain key, U.S. export controls are adding a critical new dimension: long-term supply chain reliability. Major chipmakers like Samsung and SK Hynix, despite having mature supply chains with leading American and European vendors, are reportedly evaluating etching equipment from China's AMEC for their Chinese factories. This move is not primarily about immediate replacement or AMEC's current capabilities. Instead, it's a risk mitigation strategy. Companies are concerned that future U.S. policies could disrupt their access to spare parts, software updates, and maintenance for existing equipment over its decade-long lifespan. For chipmakers investing billions in fabs with long planning cycles, this policy-induced uncertainty is a significant new risk. The U.S., through its controls, is inadvertently eroding the very reliability and certainty that were foundational strengths of its equipment suppliers. This creates a pivotal shift for Chinese semiconductor equipment. Previously seen largely as a "domestic replacement" option when foreign gear was unavailable, they are now being assessed as potential "contingency suppliers" by global players—even before a supply disruption occurs. This provides a crucial entry point for validation in real production lines, which is essential for iterative improvement. Chinese equipment, particularly in areas like etching, has progressed from prototypes to participating in mass production within China, gaining valuable experience. However, this does not signify full global competitiveness. Gaps remain in advanced lithography, metrology, and other key tools. The current evaluations are largely confined to foreign firms' China-based fabs, not their global procurement networks. The core change is in the decision-making framework. Efficiency-driven globalization favored single, optimal suppliers. An era of heightened geopolitical risk is forcing companies to value "replaceability." While technical prowess remains paramount, supply chain certainty is now being factored into a device's competitive equation. Ultimately, U.S. policies have not made Chinese equipment more advanced, but they have given global customers a compelling reason to start testing it. The competition has expanded: it's no longer just about who is more advanced, but also about who can be relied upon to stay.

marsbit45m ago

When the Competition in Chip Manufacturing Equipment Stops Being Just About Who Is More Advanced

marsbit45m ago

Trading

Spot

Hot Articles

Discussions

Welcome to the HTX Community. Here, you can stay informed about the latest platform developments and gain access to professional market insights. Users' opinions on the price of S (S) are presented below.

活动图片