Three-Year High Smashes Rate-Cut Hopes, Who's Using CPI to Clean Out Whale Holdings?

Foresight NewsPublished on 2026-06-11Last updated on 2026-06-11

Abstract

U.S. CPI inflation accelerated to 4.2% year-over-year in May, reaching a three-year high and dampening market expectations for Federal Reserve rate cuts in 2026. The surge was primarily driven by a sharp 23.5% annual increase in energy prices, fueled by geopolitical conflicts. While core CPI rose 2.9% year-over-year, showing relative moderation, the hotter-than-expected headline data prompted a repricing in interest rate markets. Traders now overwhelmingly expect the Fed to hold rates steady, with some even pricing in potential rate hikes for late 2026 or 2027. The report triggered declines in major U.S. stock indices and pressured risk assets like Bitcoin, which remained volatile around $61,000-$62,000. Analysts note that while the energy-driven inflation spike is concerning, the controlled core figures provide the Fed room for patience. However, the "higher for longer" interest rate narrative has solidified. For crypto markets, this translates to continued outflows from Bitcoin ETFs, heightened volatility, and a market seemingly in a "capitulation" phase, with leverage reset but sustained demand yet to materialize.


By Ma He, Foresight News


On the evening of June 10th, Beijing time, the U.S. Bureau of Labor Statistics officially released the Consumer Price Index (CPI) data for May 2026. The report showed that driven by a significant surge in energy prices triggered by geopolitical conflicts, U.S. inflationary pressures rebounded noticeably, further dampening market expectations for the Federal Reserve's interest rate cut path within the year. According to data from the U.S. Bureau of Labor Statistics, the CPI rose 0.5% month-over-month (seasonally adjusted) in May, slightly slower than April's 0.6% increase, but rose 4.2% year-over-year (unadjusted), accelerating significantly from 4.2% in April and reaching the highest level since April 2023. Core CPI (excluding food and energy) rose 0.2% month-over-month, below market expectations of 0.3% and April's 0.4%; it rose 2.9% year-over-year, slightly up from the previous reading of 2.8%, in line with market expectations.


Energy prices were the core driver of this month's inflation rebound. The energy index rose 3.9% month-over-month and surged 23.5% year-over-year. Among them, gasoline prices rose 7.0% month-over-month, soaring 40.5% year-over-year; fuel oil rose 58.9% year-over-year. The U.S. Bureau of Labor Statistics explicitly stated that the energy index contributed to over 60% of the month-over-month increase in the overall CPI for May. Geopolitical conflicts involving Iran and related tensions have continued to push up international oil prices since February, with WTI crude once breaking above $100 per barrel, directly transmitting to U.S. domestic gasoline and energy service costs.


Following the data release, by the close on June 11th, the S&P 500 index fell approximately 1.62%, and the Nasdaq index declined 1.98%. The U.S. dollar index strengthened, and the U.S. Treasury yield curve shifted upward overall.


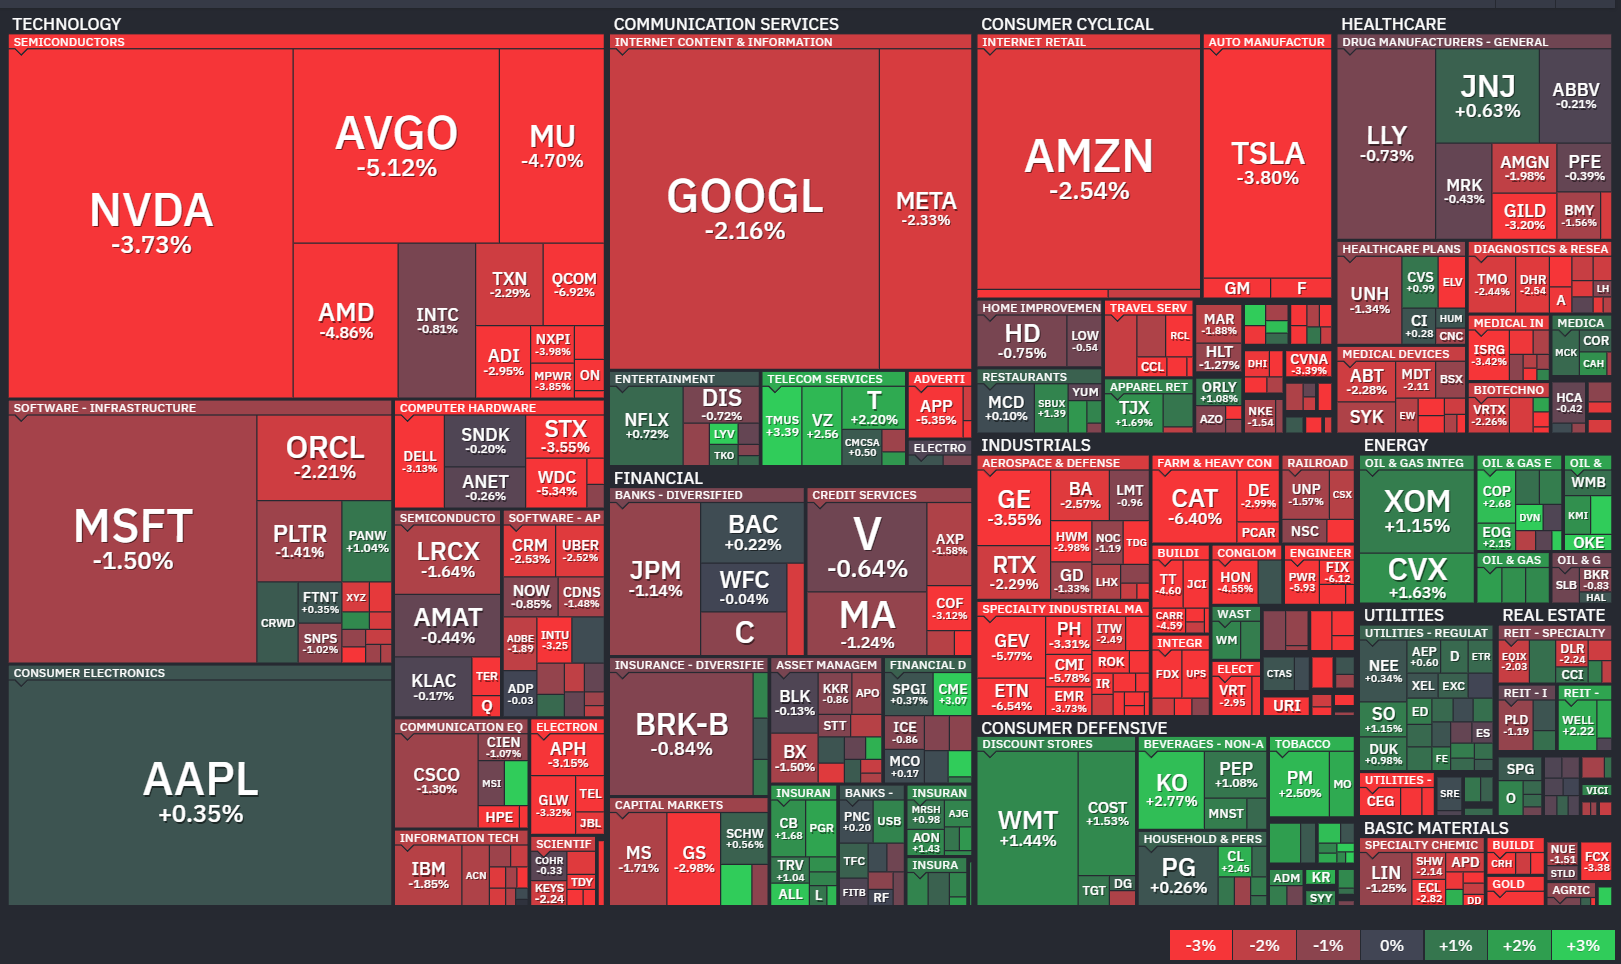
As a typical risk asset, the crypto market also faced clear pressure—Bitcoin price fluctuated between $61,000 and $62,000 around the data release, with market concerns that hot data could further squeeze liquidity expectations.


No Fed Rate Cuts This Year?


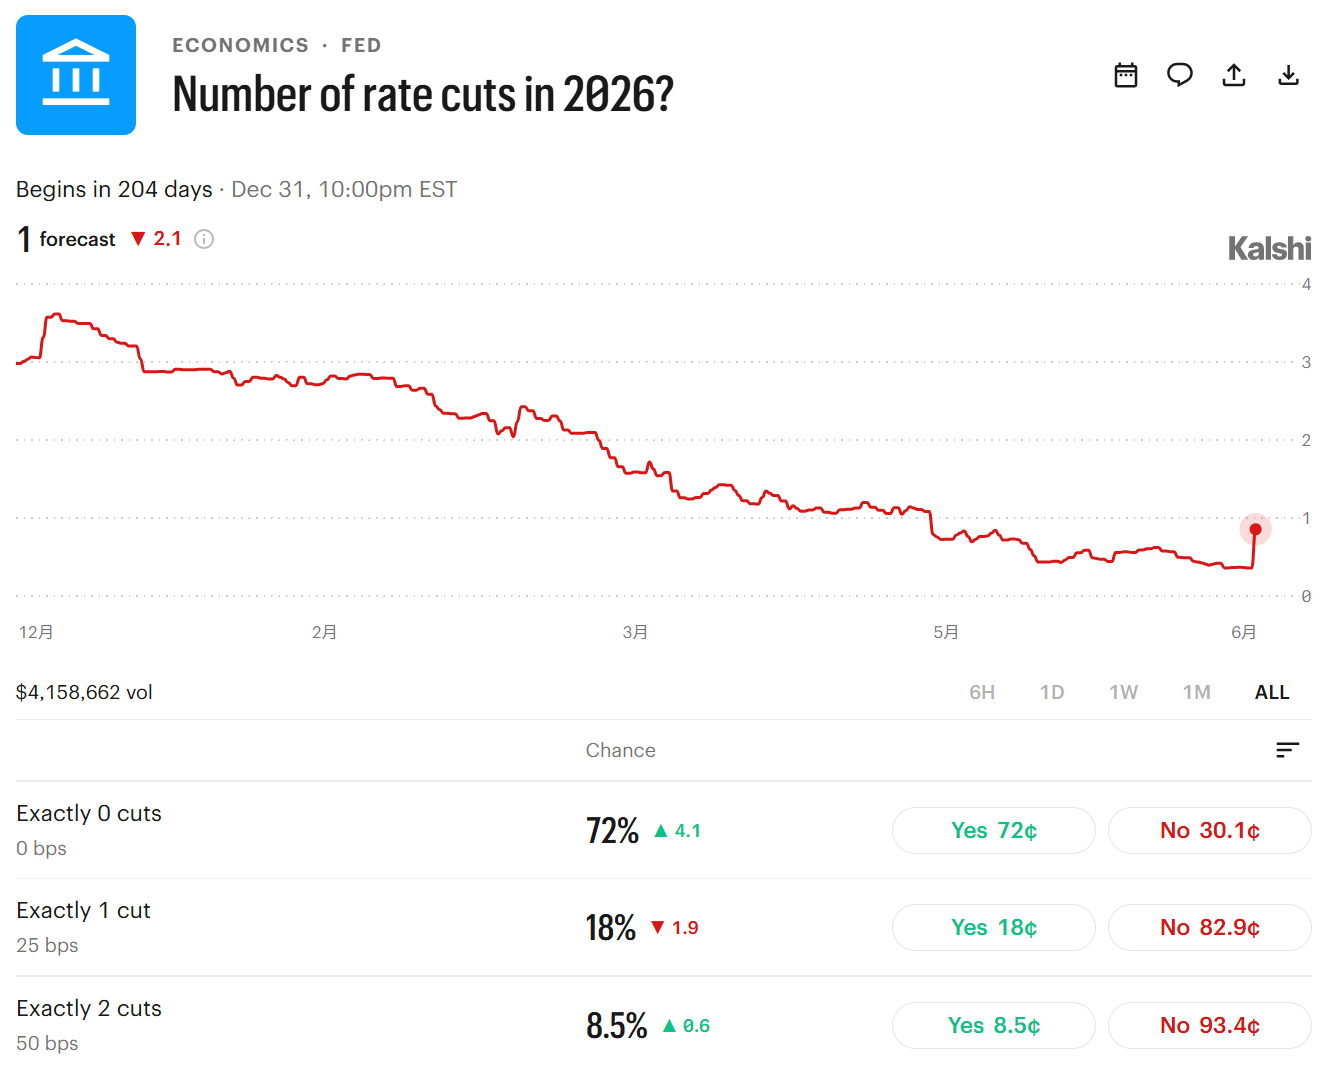
More crucial was the repricing in the interest rate derivatives market. According to the CME FedWatch Tool, the probability of the FOMC meeting on June 16-17 maintaining the federal funds rate unchanged in the current 3.50%-3.75% target range exceeds 96%. The probability of rate cuts for the entire year has significantly decreased, with some traders even starting to price in the possibility of the first rate hike at the end of 2026 or in 2027. The market had previously anticipated 1-2 rate cuts of 25 basis points in 2026, but this path has now been substantially delayed or canceled.


Most institutions believe that this CPI reinforces the expectation of 'higher-for-longer' interest rates, but there is still some distance from truly restarting a rate hike cycle.


Olu Sonola, Chief U.S. Economist at the international credit rating agency Fitch, said: "Headline inflation is indeed hot and heating up, but this isn't yet a story of panic-style rate hikes." He believes that core inflation remains relatively contained, providing the Fed with room to continue holding steady. What will truly determine the policy direction moving forward will be the upcoming months' core inflation and inflation expectation data.


Seema Shah, Chief Global Strategist at Principal Asset Management, stated that while headline inflation above 4% remains unsettling, energy is the primary driving force, and housing inflation is moderating, with no broad "second-round inflation effects" seen yet. Therefore, the Fed still has reason to remain patient.

She also pointed out that the market's current pricing for further rate hikes may be on the high side.


J.P. Morgan Asset Management believes this data may be close to a cyclical peak in this round of inflation. David Kelly, the firm's Chief Global Strategist, said that although inflation levels remain above the target range, "the most likely decision for the Fed at the upcoming policy meeting is to keep rates unchanged" and continue observing subsequent data changes.


The latest data from Kalshi shows the market's bet on the Fed holding rates steady this year has surged to 72%, while the probability of a single 25-basis-point cut has dropped to 18%.


This stands in stark contrast to market expectations at the beginning of the year. In early 2026, the market generally believed the Fed would start a rate-cutting cycle against the backdrop of persistently declining inflation. April's CPI year-over-year had already risen to 3.8%, and the May data further confirmed the inflation rebound trend, making the high-interest-rate policy environment a mainstream narrative once again. While the external shock from energy prices has some temporary nature, if it transmits to core service prices, it will force the Fed to reassess the neutral interest rate level.


For the new Chair Wash, the June meeting is an important debut. Wash was formally sworn in as Fed Chair in late May 2026, succeeding Jerome Powell whose term ended. The June meeting will release a new Summary of Economic Projections and dot plot, and the market will closely watch officials' latest assessments of the inflation path, labor market, and policy rates.


Analyzing at a deeper level, the slowdown in core CPI month-over-month to 0.2% in May provided some relief signals, indicating underlying inflation pressures are not spiraling out of control broadly. However, the Fed historically places more emphasis on the "trend" of core indicators rather than single-month fluctuations, especially against a backdrop of volatile energy prices. The persistent stickiness of housing costs, potential second-round effects (energy costs pushing up other goods and services prices), and geopolitical uncertainties all add complexity to policy formulation.


Crypto and U.S. Stocks


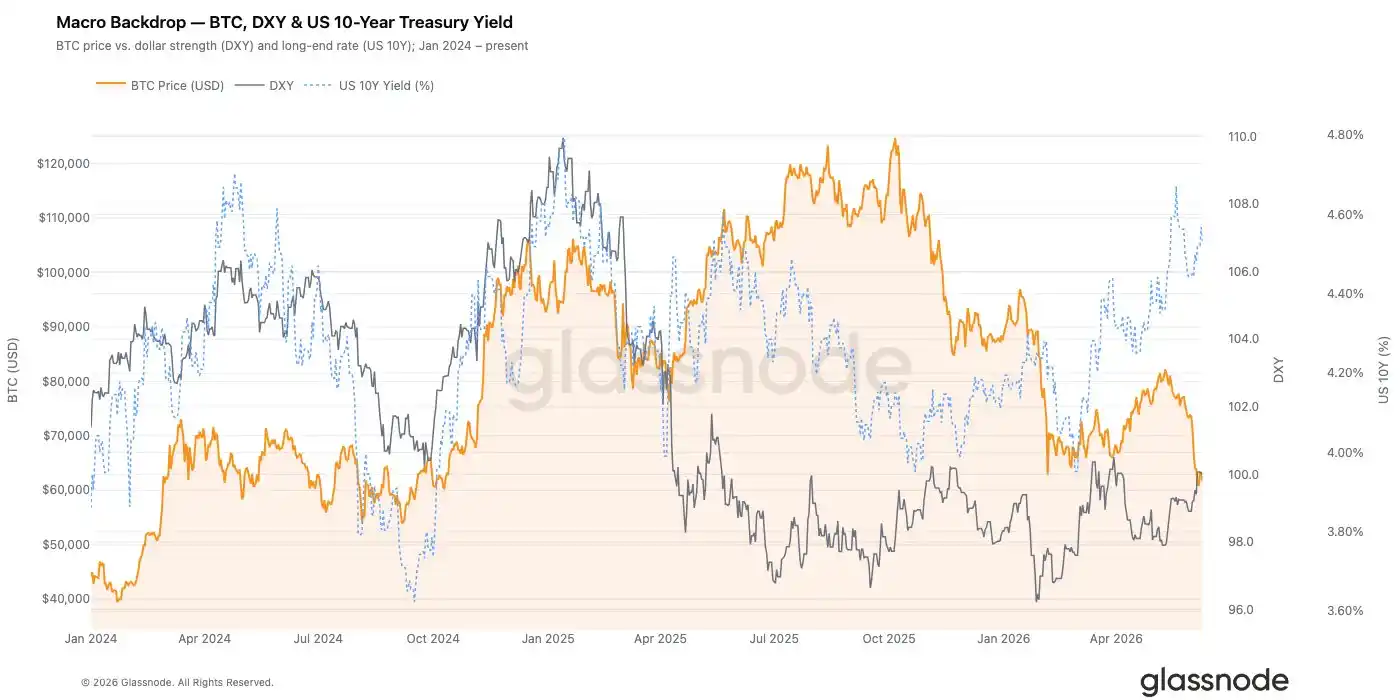
The Fed's policy path is the core anchor for the global liquidity environment. A high-interest-rate or delayed-rate-cut environment is typically accompanied by a stronger dollar, rising U.S. Treasury yields, and pressure on valuations of risk assets. The correlation between crypto assets like Bitcoin and growth-oriented assets like Nasdaq has significantly increased over the past few years. Marginal changes in liquidity expectations are often first reflected in BTC prices and ETF fund flows.


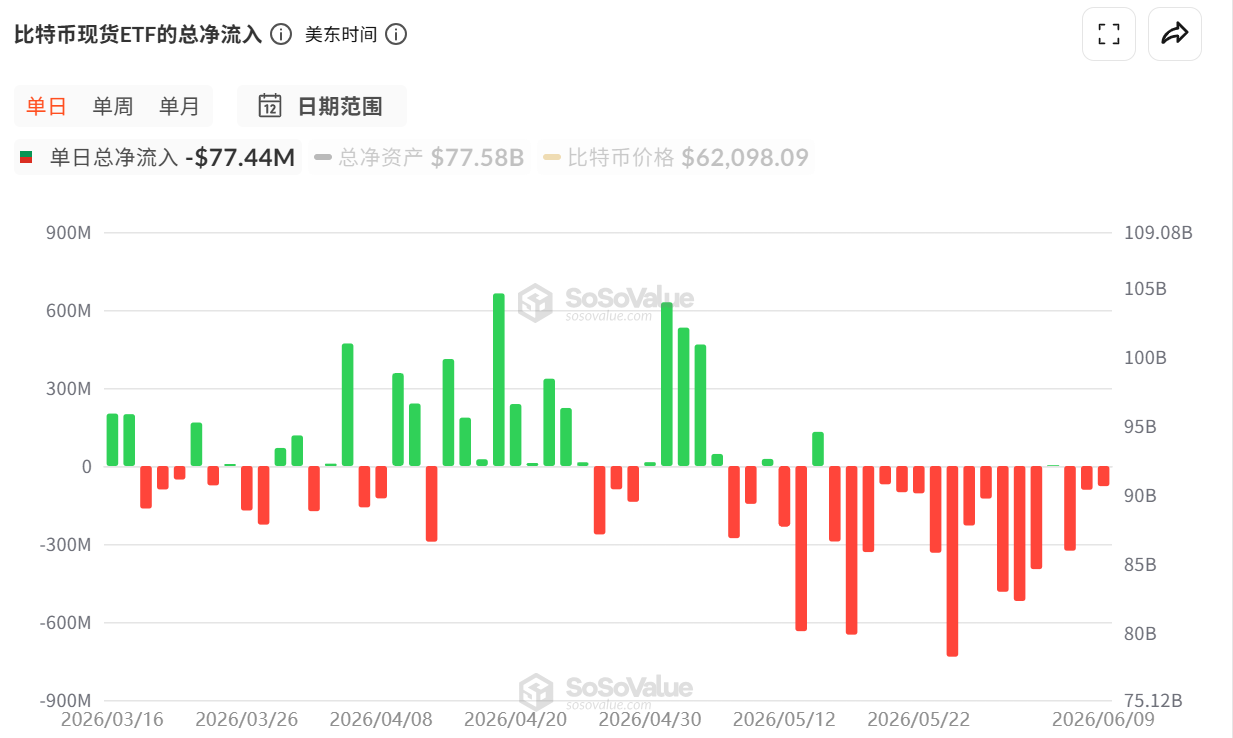
Data from SoSoValue shows that since May this year, Bitcoin spot ETFs have seen significant and continuous net outflows, putting pressure on Bitcoin's price. BTC once fell below the $60,000 mark, later fluctuating around $62,000, with the risk of breaking down again at any time.


Although the current crypto ecosystem is much more mature than during the 2022-2023 bear market, in the short term, CPI data could still trigger a pullback in risk appetite, leverage unwinding, and amplification of short-term volatility.


The latest weekly report data from Glassnode shows that Bitcoin continues to exhibit characteristics of a later-stage correction, with recent buyers suffering significant losses, realized losses remaining high, and several major sources of demand substantially weakened. Bitcoin's price drop to around $60,000 triggered a significant deleveraging event, clearing a large number of speculative positions in the market. While this helps reset leverage levels, spot demand has not yet shown substantive recovery. The options market remains in a defensive posture, implied volatility stays elevated, demand for downside protection is strong, and dealer positioning is concentrated around current spot levels. Combined with declining institutional participation and slowing corporate treasury accumulation, these data points indicate that risk appetite remains low.


Overall, the market appears to be progressing further into a capitulation phase. Although leverage has largely been reset and valuation metrics have reached historically low levels, the demand response typically associated with long-term market lows has not yet materialized.


Historical experience shows that when inflation is mainly driven by supply-side factors like energy and core data remains relatively controlled, markets often gradually repair expectations for a "soft landing" after digesting the initial shock.


As for U.S. stocks, major investment banks maintain optimistic expectations. J.P. Morgan Asset Management believes this data may be close to a cyclical peak in this round of inflation. David Kelly, the firm's Chief Global Strategist, said that although inflation levels remain above the target range, "the most likely decision for the Fed at the upcoming policy meeting is to keep rates unchanged" and continue observing subsequent data changes.


J.P. Morgan indicates that "one-off shocks" like energy shocks may become the new normal. The AI investment cycle continues, but it also warns that inflation is higher than pre-pandemic, the correlation between stocks and bonds may structurally increase, and the 60/40 portfolio faces greater pressure.


Goldman Sachs recently raised its year-end target for the S&P 500 to 8,000 points (previously 7,600), expecting 24% EPS growth in 2026. It believes earnings growth remains the main driver of the stock market, though it noted in recent comments that the probability of Fed rate cuts this year has significantly decreased.

Related Questions

QAccording to the article, what was the primary driver behind the unexpected rise in the US CPI for May 2026, and by how much did it contribute to the monthly increase?

AThe primary driver was energy prices, specifically due to geopolitical conflicts. The energy index contributed over 60% of the overall CPI's monthly increase.

QHow did the market's expectation for Federal Reserve monetary policy in 2026 change after the release of the May CPI data?

AMarket expectations shifted dramatically. The probability of the Fed holding rates steady for the entire year rose sharply to around 72%, while expectations for 1-2 rate cuts earlier in the year were largely abandoned. Some traders even began pricing in the possibility of a rate hike by late 2026 or 2027.

QWhat contrasting signals does the May CPI report present when comparing the 'Headline CPI' and the 'Core CPI'?

AThe report presents a contrast. The Headline CPI rose sharply by 4.2% year-over-year, a three-year high, driven by surging energy costs. However, the Core CPI (excluding food and energy) rose at a slower-than-expected pace of 0.2% month-over-month and 2.9% year-over-year, indicating that underlying, broader inflationary pressures were more contained.

QWhat impact did the CPI data have on Bitcoin and related crypto market indicators, according to on-chain data firm Glassnode?

AThe data contributed to a bearish environment. Bitcoin experienced significant deleveraging near $60,000, clearing out speculative positions. On-chain data showed severe losses for recent buyers, weakened demand, high implied volatility for downside protection, and a general lack of recovery in spot demand, indicating the market was in a 'capitulation phase'.

QDespite the hot inflation data, why do several cited economists and institutions believe the Fed is unlikely to panic and restart a hiking cycle immediately?

AThey point to the relatively controlled Core CPI figures as providing room for patience. They argue that the inflation surge is primarily driven by temporary energy shocks (supply-side) and has not yet translated into broad-based 'second-round effects' across other goods and services. Therefore, the most likely immediate action is for the Fed to hold rates steady and observe future data.

Related Reads

Xpeng and NIO Compete on Computing Power, Li Auto Shifts Architecture

On June 15, 2026, Li Auto unveiled details of its self-developed chip, Mahe M100, for its new L9 Livis model. CTO Xie Yan stated the goal was not just a faster chip, but a fundamentally different one, targeting the chip architecture itself. While competitors like NIO, Xpeng, and Huawei highlight TOPS (computing power) figures for their self-developed chips, Li Auto’s Mahe M100 focuses on redesigning the underlying architecture. It employs a "dynamic data flow architecture" to address memory bandwidth bottlenecks in large model inference, claiming up to 3x the effective computing power of Nvidia's Thor U for its specific workloads and a 40% reduction in latency. The chip's design was peer-reviewed and accepted at ISCA 2026. However, this performance is highly optimized for Li Auto's own VLA2.1 algorithm, meaning it may not generalize as well to other tasks. Li Auto aims to achieve full-stack in-house development with Mahe M100, covering chip, compiler, OS, AI algorithms, and domain controller—a level of vertical integration few competitors match. Beyond the chip, CEO Li Xiang introduced a new strategic narrative: the "embodied intelligent vehicle," defined as an integration of an EV, a professional driver, an AI computer, and a life assistant. This shifts competition from features like large screens to systemic AI capabilities. A key commitment was that Li Auto's Mahe VLA autonomous driving model will match Tesla's FSD V14 by Q4 2026, with specific OTA milestones set for July, September, and December. Financially, Li Auto faces pressure with declining revenue and vehicle gross margins since Q4 2025, while maintaining high R&D investment (approx. ¥12B in 2026, 50% AI-related). Its 2026 sales target is 550,000 vehicles, up from 406,000 in 2025. The new L9 Livis garnered over 10,000 pre-orders in two weeks. The effectiveness of these strategic moves—new products, OTAs, and the novel chip architecture—will begin to show in Q3 2026 financial results, with the year-end FSD V14 benchmark being the ultimate test.

marsbit36m ago

Xpeng and NIO Compete on Computing Power, Li Auto Shifts Architecture

marsbit36m ago

The Year of AI Applications: Saying 'Yes' While Ignoring Risks? A Comprehensive Open Source Log of Software Development's Journey

The Year of AI Applications: Blindly Saying "Yes" While Ignoring Risks? A Software Development Log Goes Fully Open Source. AI-generated code harbors risks hidden within seemingly correct programs, potentially leading to data leaks or asset loss. The open-source project "Narwhal AI Code Risks," from Peking University's Narwhal-Lab, compiles real-world cases, early warning signs, and typical risk pathways. Its goal is to help developers identify potential hazards early and avoid repeating past mistakes. In 2026, code is generated faster than ever but deployed with less scrutiny. The danger often lies not in glaring errors, but in code that appears normal—syntactically correct, passing all checks—yet introduces subtle but critical flaws like non-existent dependencies, excessive permissions, or exposed databases. A stark example is the Moonwell cbETH oracle incident. A configuration file error, where a cryptocurrency price was set to ~$1.12 instead of ~$2,200, slipped through 28 checks and a pull request signed by both AI (Claude, Copilot) and human developers. This "semantic deviation" resulted in a loss of $1.78 million. The risk is that AI can produce functionally valid code that is semantically wrong for the business context. As AI moves beyond simple code completion to modifying configurations, installing dependencies, and operating via autonomous agents, it traverses longer, less traceable paths within software engineering, blurring traditional boundaries and oversight points. The Narwhal AI Code Risks project structures information into three layers: `/cases` for documented real-world incidents, `/inferred` for early warning signals, and `/scenarios` for clear, generalized risk patterns not yet tied to specific events. This aims to create a lasting, public record to prevent collective amnesia about past AI-coding pitfalls. Risks are categorized into seven areas: Software Supply Chain (e.g., recommending fake packages), Code-Level Vulnerabilities (e.g., reintroducing path traversal bugs), Cloud & Infrastructure Misconfiguration (e.g., overly permissive settings), Agent Risks (from autonomous tool execution), Vertical Domain Risks (e.g., in finance, healthcare), Intellectual Property & Compliance issues, and Human Factors (like over-reliance on AI output). The project's core value is transforming isolated incidents into reusable knowledge—a foundational resource for developers to spot similar issues, for security researchers to build upon, for toolmakers to create detection rules, and for the community to contribute new findings. As AI integration accelerates, this open-source "logbook" serves as a crucial navigational aid, charting past errors to help future projects steer clear of the same traps.

marsbit36m ago

The Year of AI Applications: Saying 'Yes' While Ignoring Risks? A Comprehensive Open Source Log of Software Development's Journey

marsbit36m ago

The Foundation of SpaceX's Trillion-Dollar Valuation: Who is Dividing Up Musk's Annual Tens of Billions in Capital Expenditure?

SpaceX's trillion-dollar valuation is built on its three core businesses: Starlink (profitable, 60% of revenue), rockets (driving down launch costs), and AI (a major investment area). This creates a financial cycle: Starlink funds rocket development, which enables low-cost launches for AI hardware, generating future revenue. This cycle fuels annual capital expenditures of tens of billions, flowing to a vast supply chain. Suppliers are categorized by their replaceability. The first group includes irreplaceable players like NVIDIA (GPU/CUDA ecosystem), Eutelsat (critical radio spectrum), Filtronic (specialized amplifiers), Materion (strategic beryllium), and STMicroelectronics (antenna chips). The second group consists of hard-to-replace suppliers due to high switching costs, such as Honeywell (flight control), Carpenter Technology (specialty alloys), Hexcel (carbon fiber), Broadcom (data exchange), and Linde (industrial gases). The third group comprises high-volume, cost-critical suppliers for mass-produced items like Starlink terminals. Key names include Wistron NeWeb (primary manufacturer) and several A-share companies like Shenzhen Sunway (connectors), Pies New Materials (forgings), Western Superconducting (alloys), and Yingliu (castings). Other niche players include Trimble (timing), Astronics (power distribution), and CTS (thermal management). The article argues that investing in these suppliers, rather than SpaceX stock directly, offers an alternative opportunity. The rationale is threefold: procurement is just beginning to scale, SpaceX's IPO brings new transparency to its supply chain, and the situation mirrors early stages of past "super terminal" ecosystems like Apple or Tesla. While risks exist (commodity cycles, geopolitical factors, technology shifts), the core thesis is that SpaceX's massive, ongoing procurement will translate into reliable revenue for its key suppliers, regardless of its own stock price volatility.

marsbit1h ago

The Foundation of SpaceX's Trillion-Dollar Valuation: Who is Dividing Up Musk's Annual Tens of Billions in Capital Expenditure?

marsbit1h ago

SpaceX's Trillion-Dollar Valuation Base: Who's Sharing in Musk's Annual Tens of Billions in Capital Expenditure?

**Title: The Foundation of SpaceX's Trillion-Dollar Valuation: Who Benefits from Musk's Annual $100 Billion Capital Expenditure?** This article argues that investors seeking to benefit from SpaceX's growth might find greater opportunities in its supply chain rather than directly investing in the company itself, drawing parallels to historical successes with Apple, Tesla, and NVIDIA suppliers. **SpaceX's Business Model & Cash Flow:** SpaceX generates revenue from three main areas: 1. **Starlink:** Its profitable core, earning $11.3B in 2023 (60% of revenue), funding other ventures. 2. **Rockets (Falcon/Starship):** Requires $3B+ in annual R&D but achieves the world's lowest launch costs. 3. **AI:** Currently unprofitable (-$6B+ in 2023), investing heavily in ground-based supercomputers (220,000 GPUs) and future orbital data centers. The cycle is: Starlink profits → fund cheaper rockets → low-cost launches deploy AI hardware → AI compute rentals generate future revenue. This cycle drives annual procurement spending of tens of billions of dollars. **The Supply Chain Beneficiaries:** Suppliers are categorized by their replaceability: **1. Nearly Irreplaceable (High Barriers to Entry):** * **NVIDIA:** Powers the Colossus supercomputer; its CUDA ecosystem creates immense switching costs. * **Eutelsat (SATS):** Controls critical radio spectrum for satellite communications; holds a ~3% stake in SpaceX. * **Filtronic (FTC):** Supplies millimeter-wave signal amplifiers for Starlink satellites; SpaceX constitutes 83% of its revenue. * **Materion (MTRN):** Global leader in beryllium production, a strategic material used in Starship structures. * **STMicroelectronics (STM):** Supplies phased-array antenna chips for Starlink satellites. **2. Replaceable, but Switching Cost is Prohibitively High:** * **Honeywell (HON):** Provides flight control and inertial navigation systems with decades of certification. * **Carpenter Technology (CRS):** Manufactures ultra-pure specialty steel alloys for Raptor engines. * **Hexcel (HXL):** Supplies custom carbon fiber composites developed over a decade with SpaceX. * **Broadcom (AVGO):** Manages high-speed data switching. * **Linde Group:** Supplies industrial gases (liquid oxygen/nitrogen) from facilities built near SpaceX launch sites. **3. High-Volume, Cost-Critical Manufacturing:** Focuses on mass-producing components like Starlink user terminals (target: 30 million units). * **Key Players:** Wistron NeWeb (6285, primary terminal manufacturer), several Chinese A-share companies (e.g., Sunway Communication, PAX New Materials, Western Metal Materials, Yingliu Co.), and smaller US firms like Trimble (TRMB, timing systems). **Why Now?** Three factors make the supply chain opportunity timely: 1. **Volume Ramp-Up:** SpaceX plans 100 launches in 2026, aims for 30 million Starlink terminals, and will deploy AI data centers, meaning procurement will accelerate. 2. **Increased Transparency:** The IPO provides public financial data, allowing investors to track supplier order growth. 3. **Historical Precedent:** The current phase is likened to Tesla's early mass-production stage (circa 2018), suggesting a long growth runway for suppliers. **Conclusion:** The article posits that while investing in SpaceX stock is betting on Elon Musk's ambitious vision at a high valuation, investing in its established suppliers is a bet on the tangible, recurring revenue from its massive procurement budget, which is largely decoupled from day-to-day stock price volatility.

链捕手1h ago

SpaceX's Trillion-Dollar Valuation Base: Who's Sharing in Musk's Annual Tens of Billions in Capital Expenditure?

链捕手1h ago

Trading

Spot
Futures
活动图片