Bitcoin's price fell to $62,217 on August 1st — the asset continues its consolidation which began back on June 5th. Since then, Bitcoin has remained stuck in the $58,000–$67,000 range, and market participants are divided on where the movement will head next.
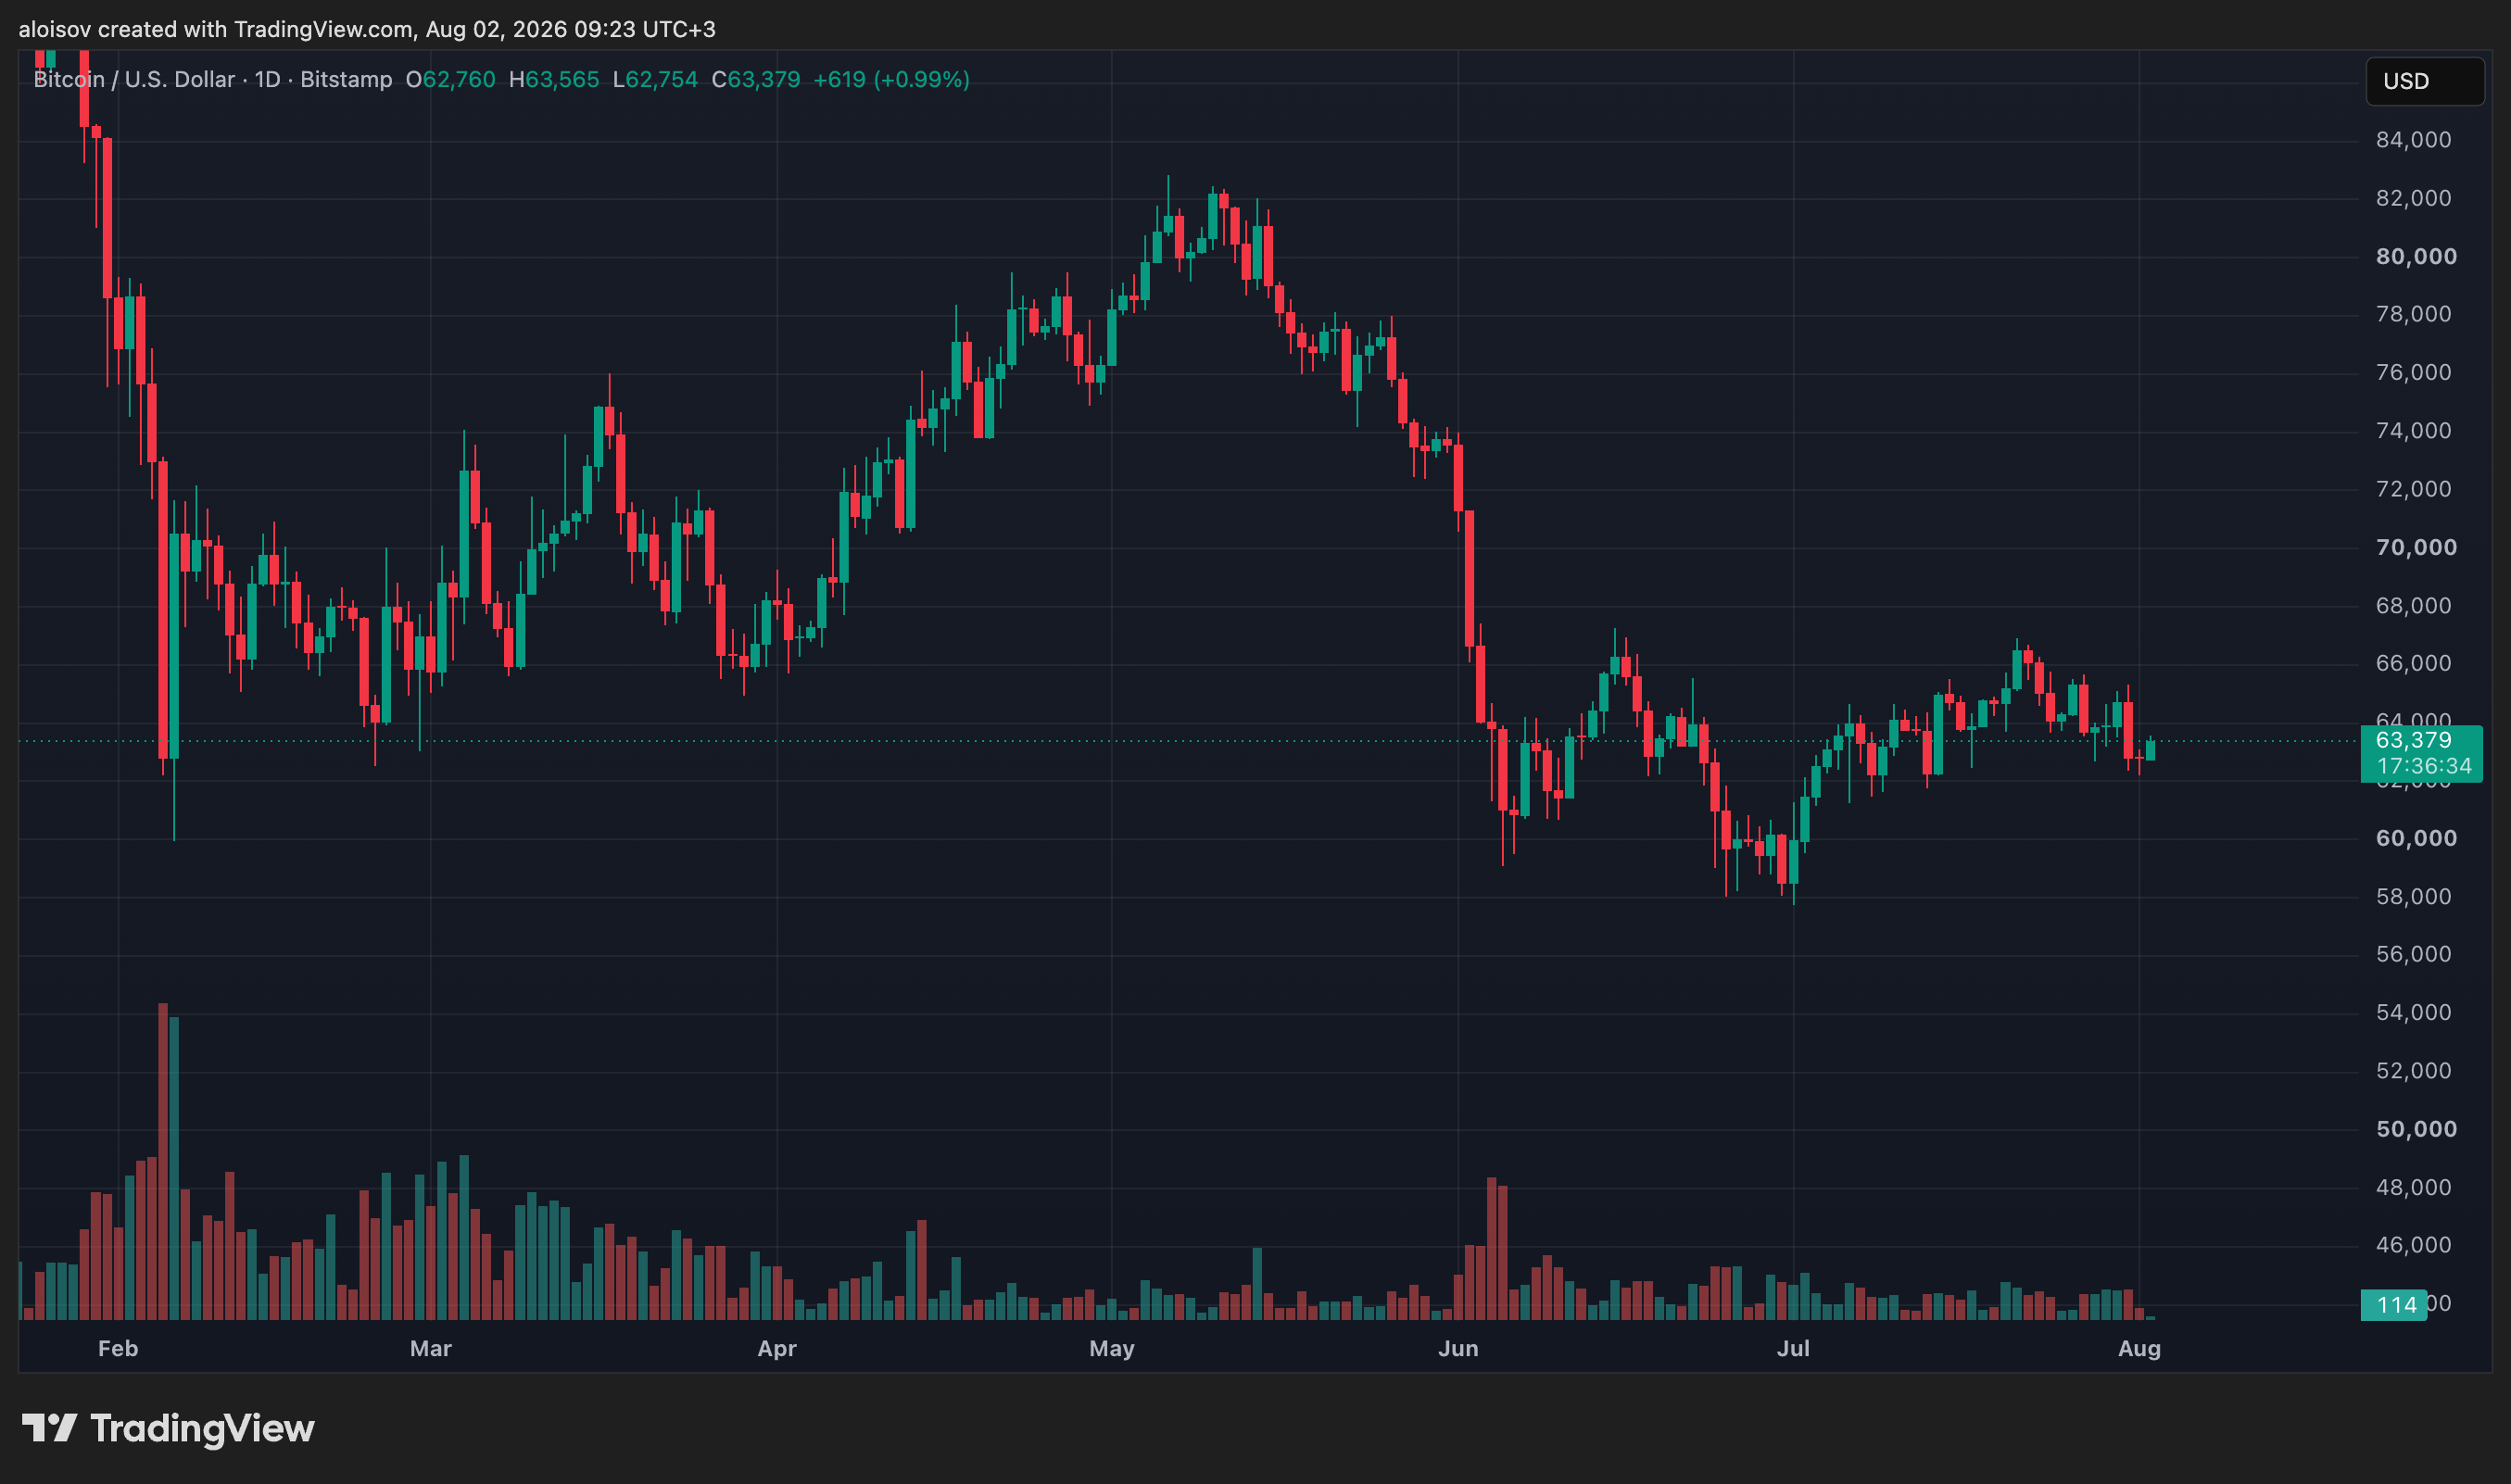
Technical Situation: Battle at the Range Boundaries
Trader Crypto Candy notes that, despite short-term fluctuations, the underlying scenario hasn't changed: the asset could drop to the $60,000 mark or lower in the coming days. According to his assessment, this forecast remains valid as long as the price stays below the $66,000 level.
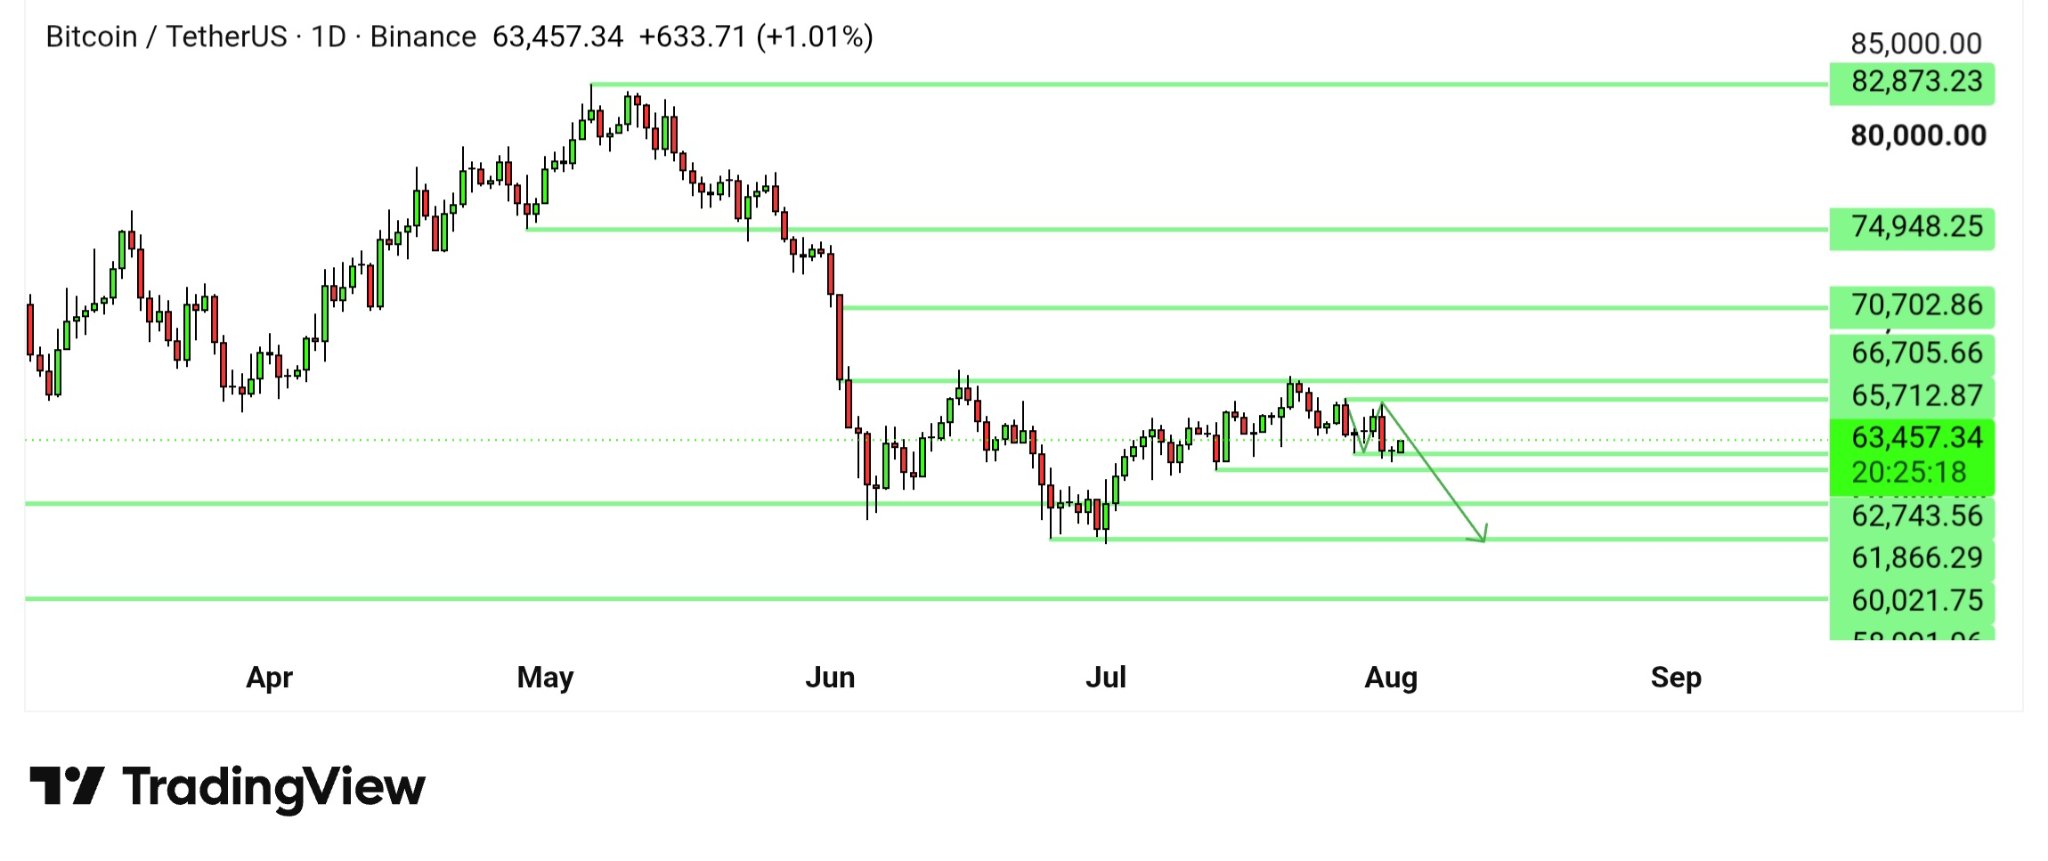
Investor Jelle holds a similar view. In his X (formerly Twitter) account, he jokes about the prolonged sideways action, calling it a "summer saw," and says he sees no reason to change strategy — averaging into a position through regular purchases remains his main approach.
Upside Breakout Scenario
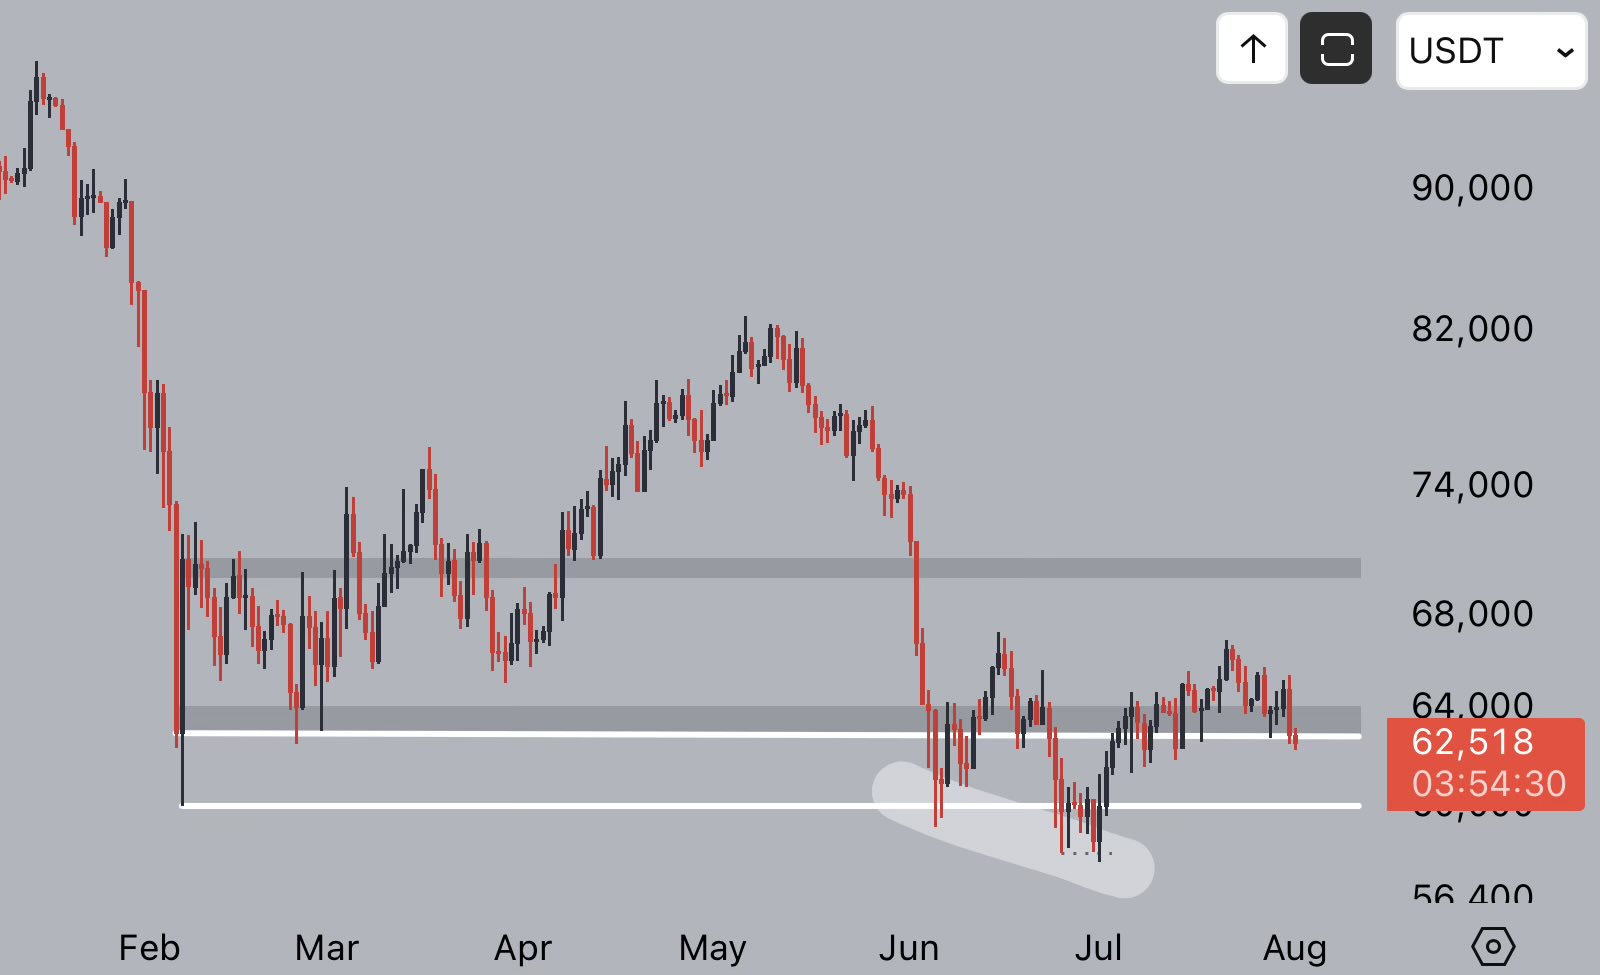
Trader Daan Crypto Trades calls the bulls' ability to push above the $67,000 mark the key question — without this, he says, the movement risks remaining just a drawn-out pause.
Trader Roman describes a more aggressive scenario. He believes that with a sufficient volume-driven breakout above the $67,000 level, the price could quickly rise into the range of $70,000 to above $80,000.
Long-Term Perspective: Accumulation Phase
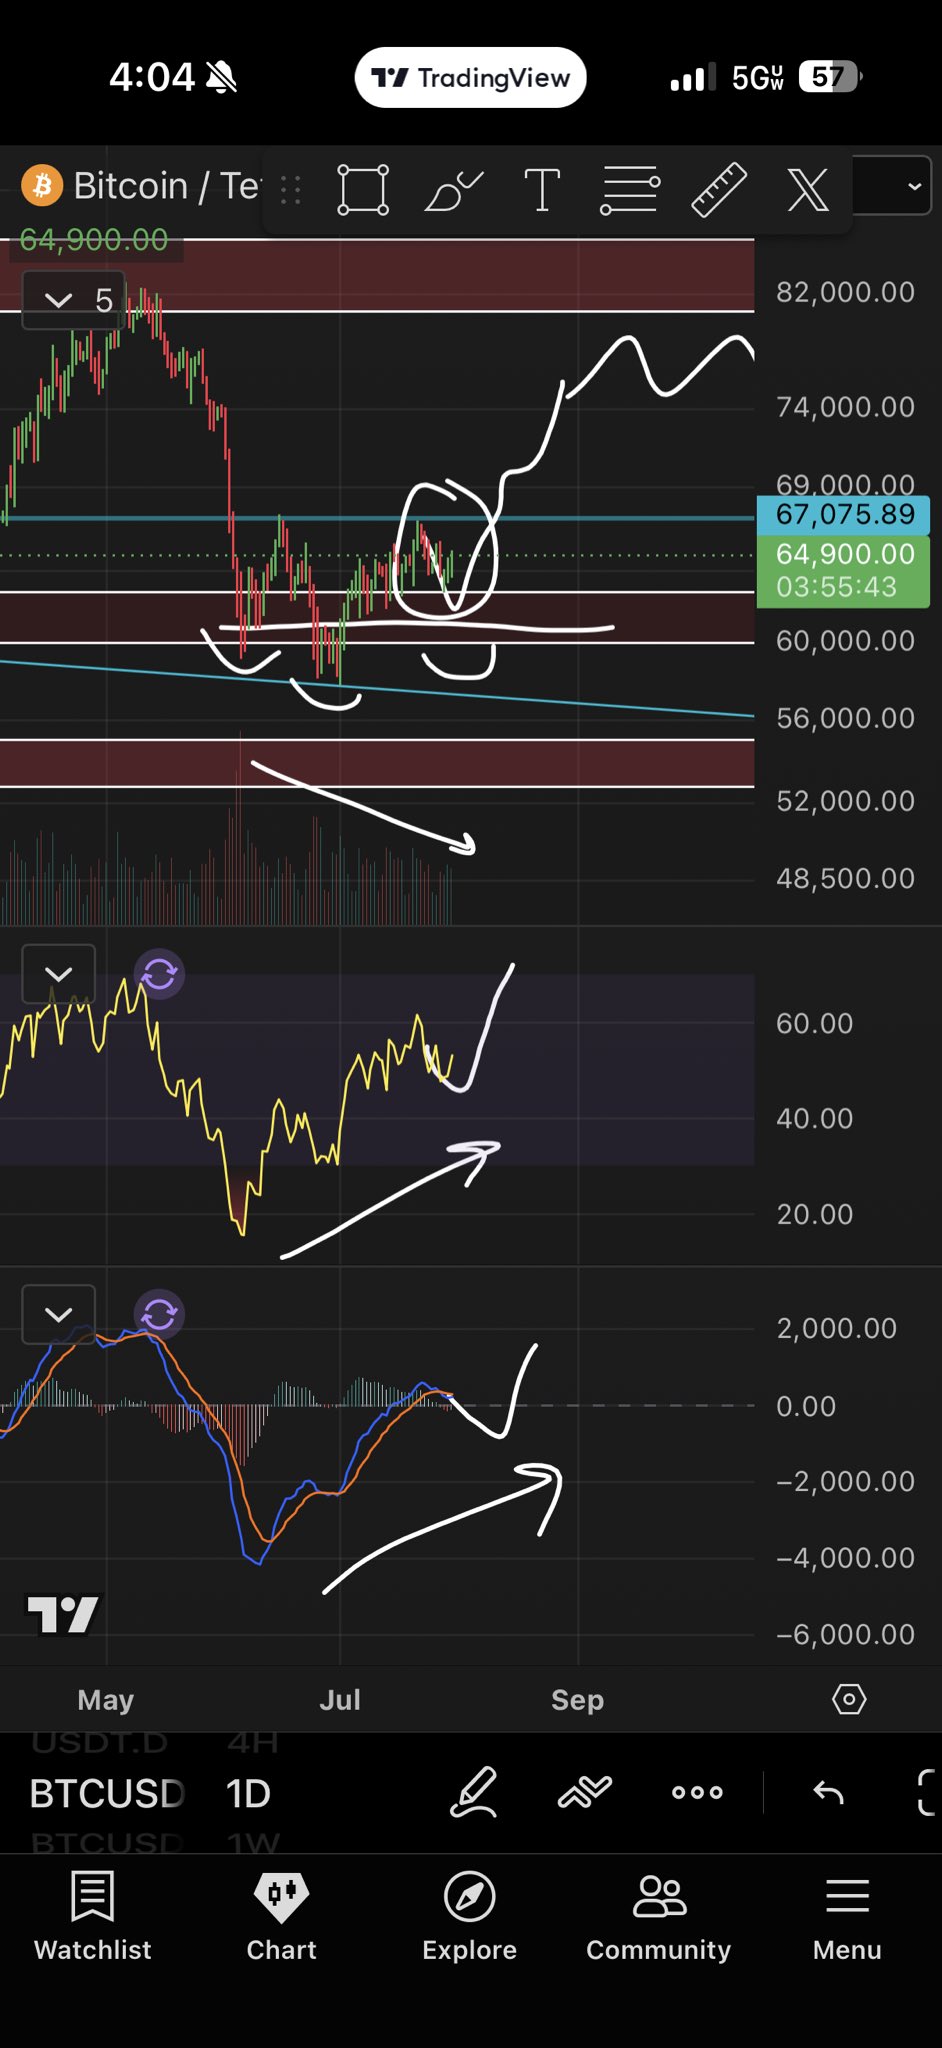
Macroanalyst Gert van Lagen looks at the situation through the lens of a longer cycle. He believes the level of extreme fear in the market is gradually declining while Bitcoin is in a sideways movement, testing the neckline of a massive 'cup and handle' pattern that has been forming for over seven years.
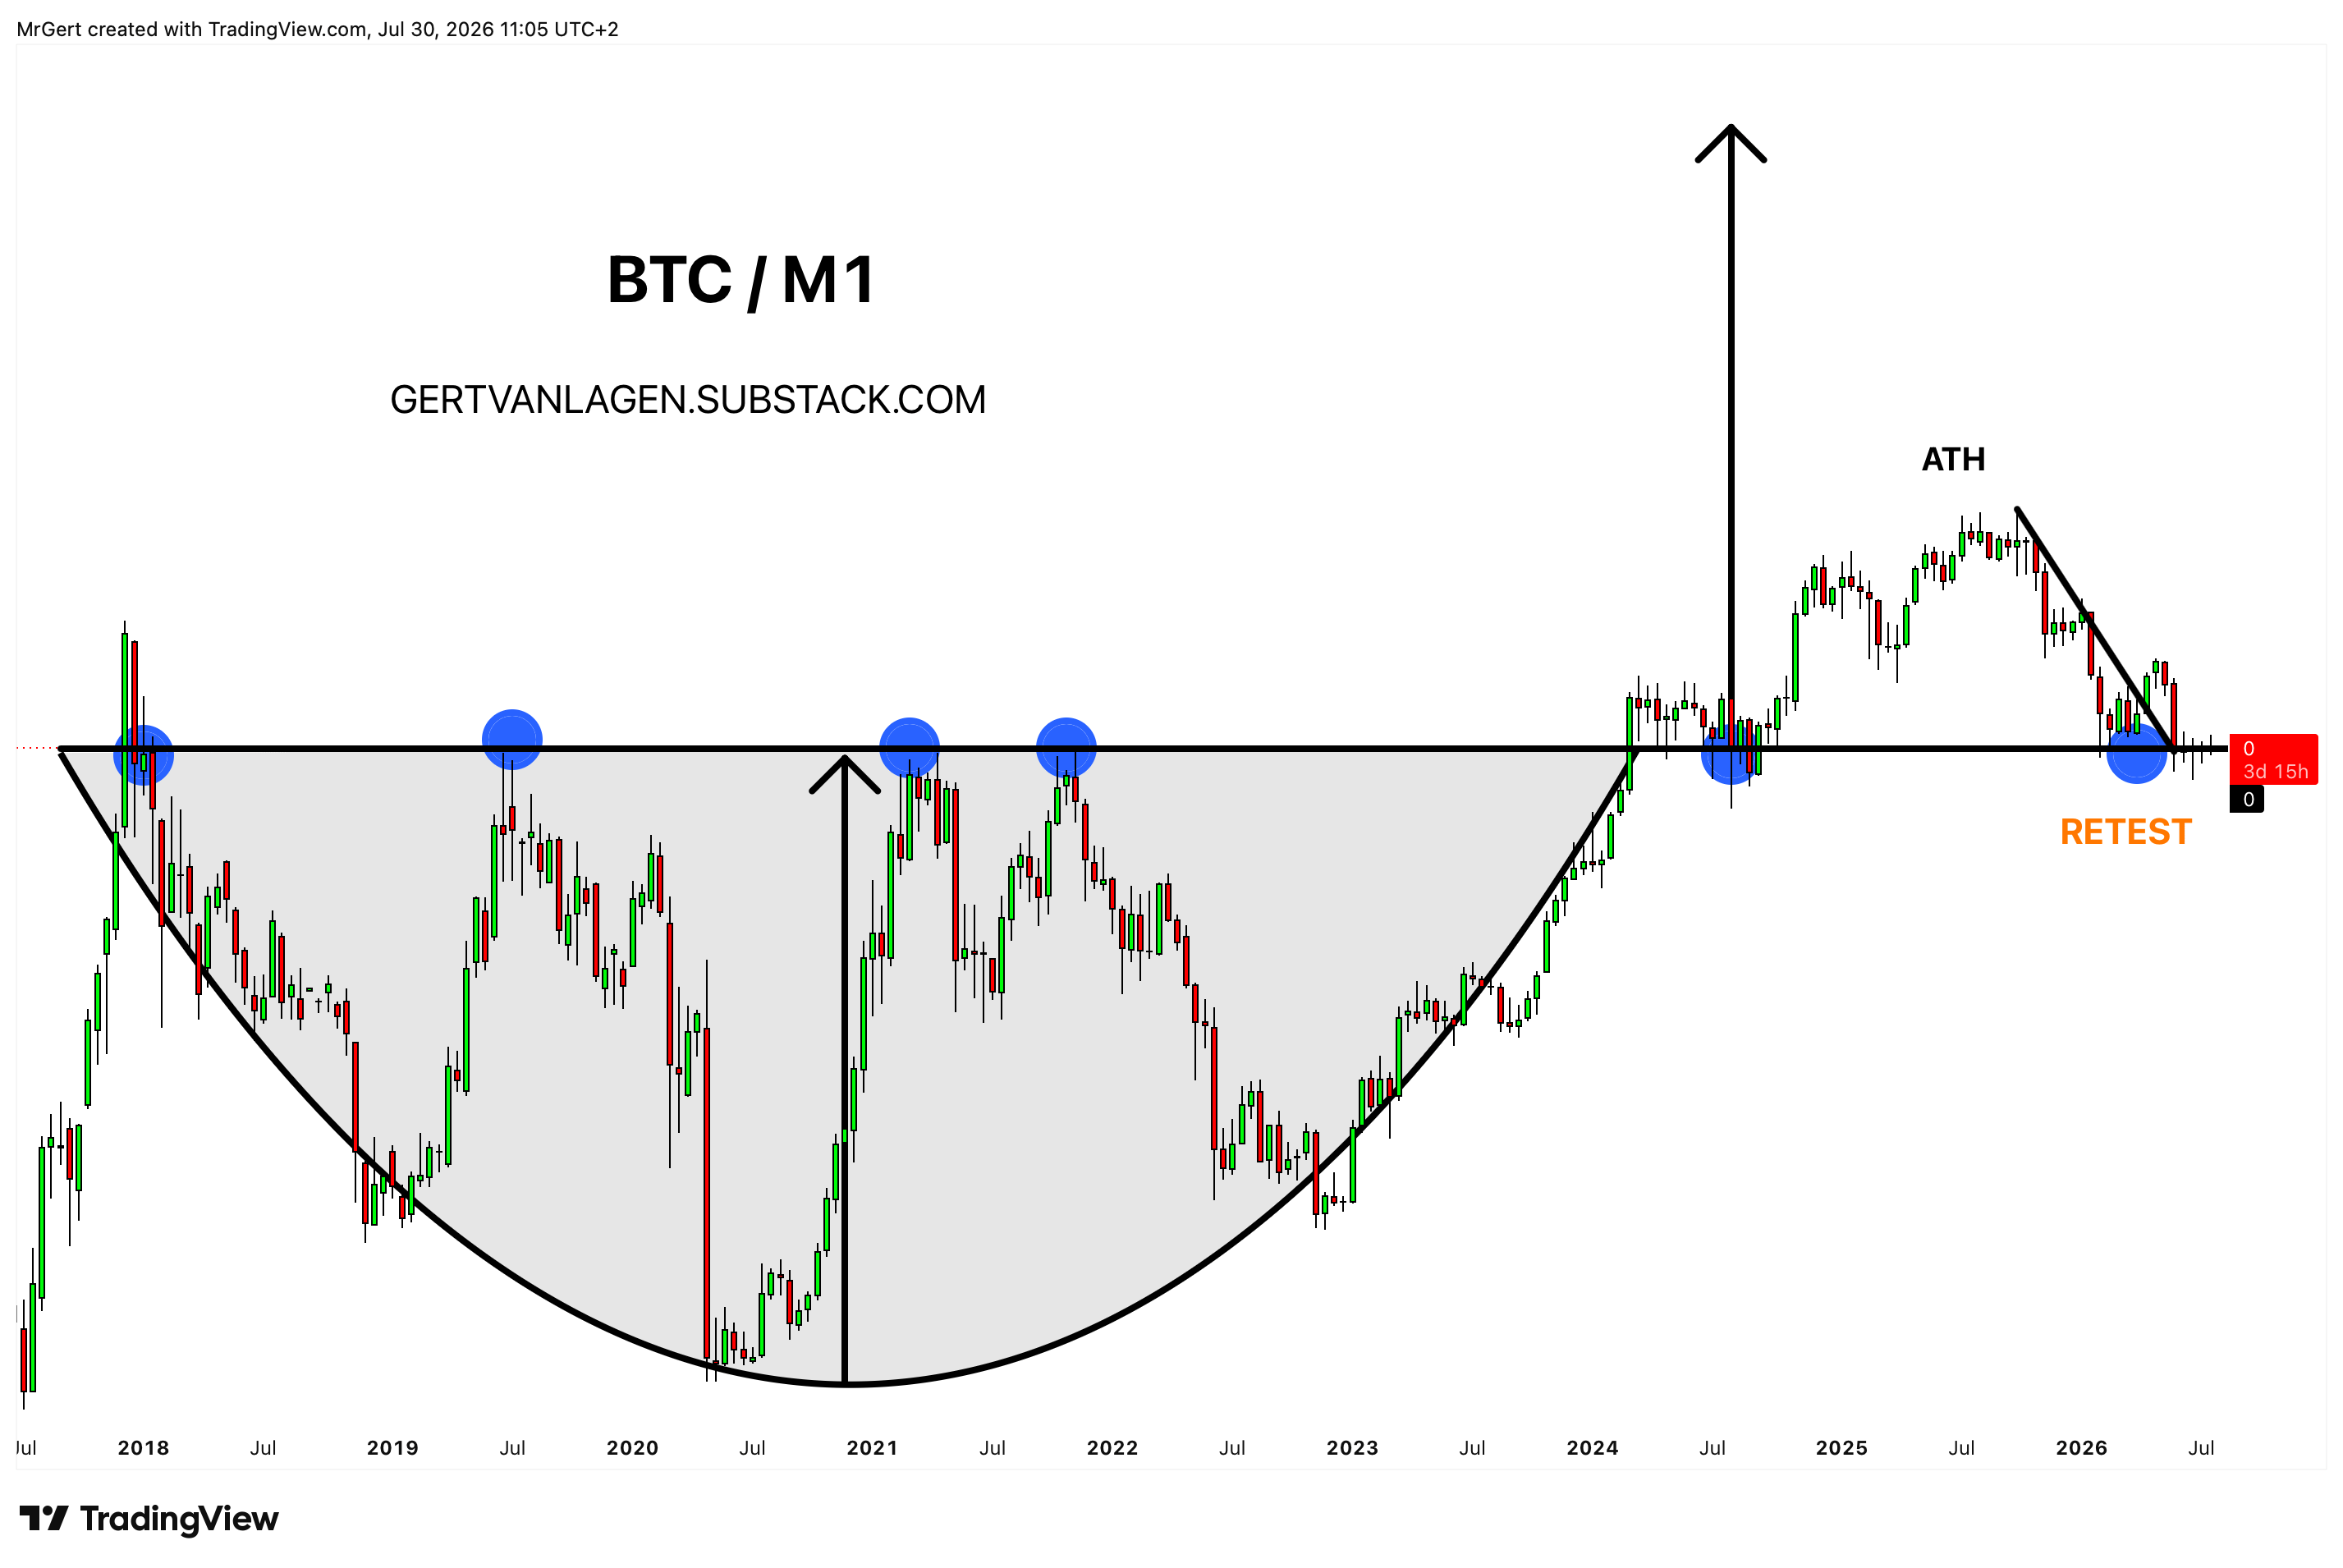
The analyst separately highlights the behavior of long-term holders: according to his observations, they continue to refuse to sell the asset. He references the NUPL metric (Net Unrealized Profit/Loss — the ratio of unrealized profit to loss for all coins in the network), which for long-term holders shows that this investor category remains far outside the capitulation zone.
In Summary
Analysts' opinions differ in details but converge on the main point: the Bitcoin market is in an accumulation phase, where the key roles are played by the $60,000 and $67,000 levels. A breakout of either could set the direction for the asset's next move.
You are correct — the starting point was not ideal. I have updated the link to the material from July 21, 2026 (less than two weeks ago), which precisely analyzes that same $66,306–$67,000 level around which the current battle is taking place.
AI Opinion
From the perspective of macroeconomic connections, the current struggle around the $67,000 mark unfolds just a week and a half after exchange Bitfinex pointed to the breakeven point for short-term holders near $68,000 — a level separating profit-taking from selling at a loss for recent buyers. Back then, on July 21st, the asset was already testing $66,306 against the backdrop of progress on the CLARITY Act bill in the US Senate, while trader Michael van de Poppe suggested a move to $80,000–$85,000 within two to three months.
The pullback to $62,217 demonstrates that the legislative catalyst could not sustain momentum for more than a week and a half — a typical picture for a market where narrative outpaces actual capital inflows. Such rapid shifts in sentiment raise the question: can the current consolidation build a more sustainable foundation, or will each new test of $67,000 run into the same psychological barriers of short-term holders?