# Earnings Related Articles

HTX News Center provides the latest articles and in-depth analysis on "Earnings", covering market trends, project updates, tech developments, and regulatory policies in the crypto industry.

Tokenization Scale Soars to $4.3 Billion, But Why Did Securitize Incur a $5.5 Million Loss?

Securitize's first quarterly report post-IPO reveals a paradox: while its tokenized assets under management hit a record $4.3 billion (up 16% YoY) and platform trading volume surged 147% to $5.3 billion, total revenue fell 5% to $14.4 million. Tokenization revenue specifically dropped ~12% to $7.8 million, leading to an adjusted EBITDA loss of $5.5 million. CFO Francisco Flores explained that most trading volume is not yet monetized, with the majority of tokenization revenue still coming from one-time projects like new protocol integrations. In contrast, asset servicing revenue, a more recurring stream, grew slightly to $6.6 million. The company has lowered its full-year revenue guidance to $70-$80 million from an initial projection of $110 million. Industry experts note this highlights a structural challenge for the tokenization sector. Scaling assets on-chain doesn't automatically scale a profitable business model. Current implementations often rely on costly, customized projects for each new asset or jurisdiction. The future, they argue, lies in building standardized infrastructure that generates recurring "infrastructure revenue" from post-issuance activities like compliance, distributions, and secondary trading—similar to enterprise software. Analysts caution against misinterpreting high trading volumes as indicative of a mature fee-based model, as Securitize's broad volume metric includes many non-monetized actions. The key test for the industry is whether adding billions in new assets can generate sustainable revenue without constant new custom projects.

marsbit08/20 10:06

Tokenization Scale Soars to $4.3 Billion, But Why Did Securitize Incur a $5.5 Million Loss?

marsbit08/20 10:06

Some Thoughts on This Trade During the Meta $1.4 Trillion Ruling

During a trial where Meta faces a potential penalty range from $400 million to $1.4 trillion—a difference of five orders of magnitude—the company's stock has underperformed the S&P 500 by roughly 8 percentage points, shedding about $110 billion in market value. The final amount will be determined solely by Judge Yvonne Gonzalez Rogers, as this is a bench trial with an advisory jury. While some might consider short-term options to bet on the ruling date, such a strategy is mathematically challenged and costly due to timing uncertainty and elevated implied volatility. A more fundamental view suggests Meta's current valuation, trading at approximately 16.9 times forward earnings—below its historical average—is applied to artificially depressed profits due to heavy AI infrastructure investments. Even a worst-case regulatory outcome, such as restrictions on data collection from teens, might be less severe than perceived, as Meta's core asset is its advertising monetization engine, not merely owning a young user base. The article contrasts this event with the Google Chrome remedy ruling, highlighting differences in legal posture and settlement dynamics. The author describes their analytical approach, which includes monitoring court dockets via automated tools, prediction markets, insider filings, and options flow to estimate ruling probabilities and timing, rather than relying on news summaries. The piece concludes that owning Meta stock at its current multiple offers a "free option" on the trial outcome, with zero holding cost if the catalyst does not materialize.

marsbit08/20 08:46

Some Thoughts on This Trade During the Meta $1.4 Trillion Ruling

marsbit08/20 08:46

Semiconductor Mid-Game Check-in: How Much Left in the Tail-End Rally?

Semiconductor Mid-Game Review: How Much is Left in the Rally? This analysis compares the current semiconductor market trend to NVIDIA's trajectory in 2024, drawing lessons on identifying market tops and bottoms. In July-August 2024, NVIDIA's stock fell 33%, triggered by a combination of "fundamental rumors" (Blackwell delays, antitrust probes) and "macro-driven asset selling" (BOJ rate hike leading to carry-trade unwinding). The low was marked by extreme panic selling across global markets. Key characteristics of a TOP include: Technical patterns like double tops or failure to break highs; Overcrowded and leveraged positioning (e.g., excessive retail and ETF inflows into a single stock like NVDA); High fragility where even a minor fundamental disappointment (e.g., a slight margin dip in stellar earnings) triggers a sharp correction. The practical action is to reduce exposure upon seeing technical warning signs combined with crowded trades. Key characteristics of a BOTTOM include: Technical reversal signals like a high-volume bullish engulfing pattern after a steep drop; Panic indicators hitting extremes (e.g., record VIX, major index crashes) signaling selling exhaustion; The downturn being driven by macro or systemic shocks unrelated to the company's core business fundamentals, creating a mispricing that quality companies eventually recover from. The conclusion is that while the current semiconductor rally may be in its later stages ("fish tail"), understanding these patterns—where tops form from crowded optimism and bottoms from panic unrelated to fundamentals—can help navigate remaining volatility.

marsbit08/20 06:41

Semiconductor Mid-Game Check-in: How Much Left in the Tail-End Rally?

marsbit08/20 06:41

BIT Trading Moment: BTC Buying Pressure Rises but Bearish Sentiment Remains Strong, 50-Month EMA Difficult to Break, SK Hynix Attempts to Stabilize Memory

BIT Trading Hours: BTC Buying Rebounds but Bearish Sentiment Persists; 50-Month EMA Presents Resistance; SK Hynix Attempts to Stabilize the Memory Sector. Bitcoin briefly reclaimed $65,000, its first time since August 10th, showing a temporary decoupling from traditional risk assets pressured by soaring long-term U.S. Treasury yields. Key support is seen at $62k-$63k, with resistance near the 50-month Exponential Moving Average around $65.4k. While on-chain data indicates recovering spot demand, potentially signaling a local bottom, the options market remains skewed bearish. BIT analysis notes significant downside risk remains if historical bear market patterns repeat, with a potential drop to ~$45.5k. Global equity markets faced intense selling pressure, driven by a bond market storm. The U.S. 30-year yield hit a multi-year high above 5.33%, raising global funding costs. The AI sector was at the epicenter of the sell-off, with the Philadelphia Semiconductor Index plunging ~5% as investors questioned the sustainability of massive AI capital expenditures amid high debt costs. Storage stocks like Micron led declines. SK Hynix's announcement of a major share buyback provided some stability to the memory sector during after-hours trading. However, most tech stocks remained under pressure. In Asia, South Korean and Japanese indices fell sharply, heavily impacted by chip stock declines. Chinese robotics company Unitree Tech had a volatile market debut on Shanghai's STAR Market, soaring over 600% at one point before paring gains, making its founder a billionaire. Despite this individual success, the broader robotics sector in A-shares sold off heavily. Key upcoming events include the U.S. 20-year Treasury auction and the release of the Federal Reserve's July meeting minutes, which will be crucial tests for bond market stability and monetary policy expectations.

marsbit08/19 09:29

BIT Trading Moment: BTC Buying Pressure Rises but Bearish Sentiment Remains Strong, 50-Month EMA Difficult to Break, SK Hynix Attempts to Stabilize Memory

marsbit08/19 09:29

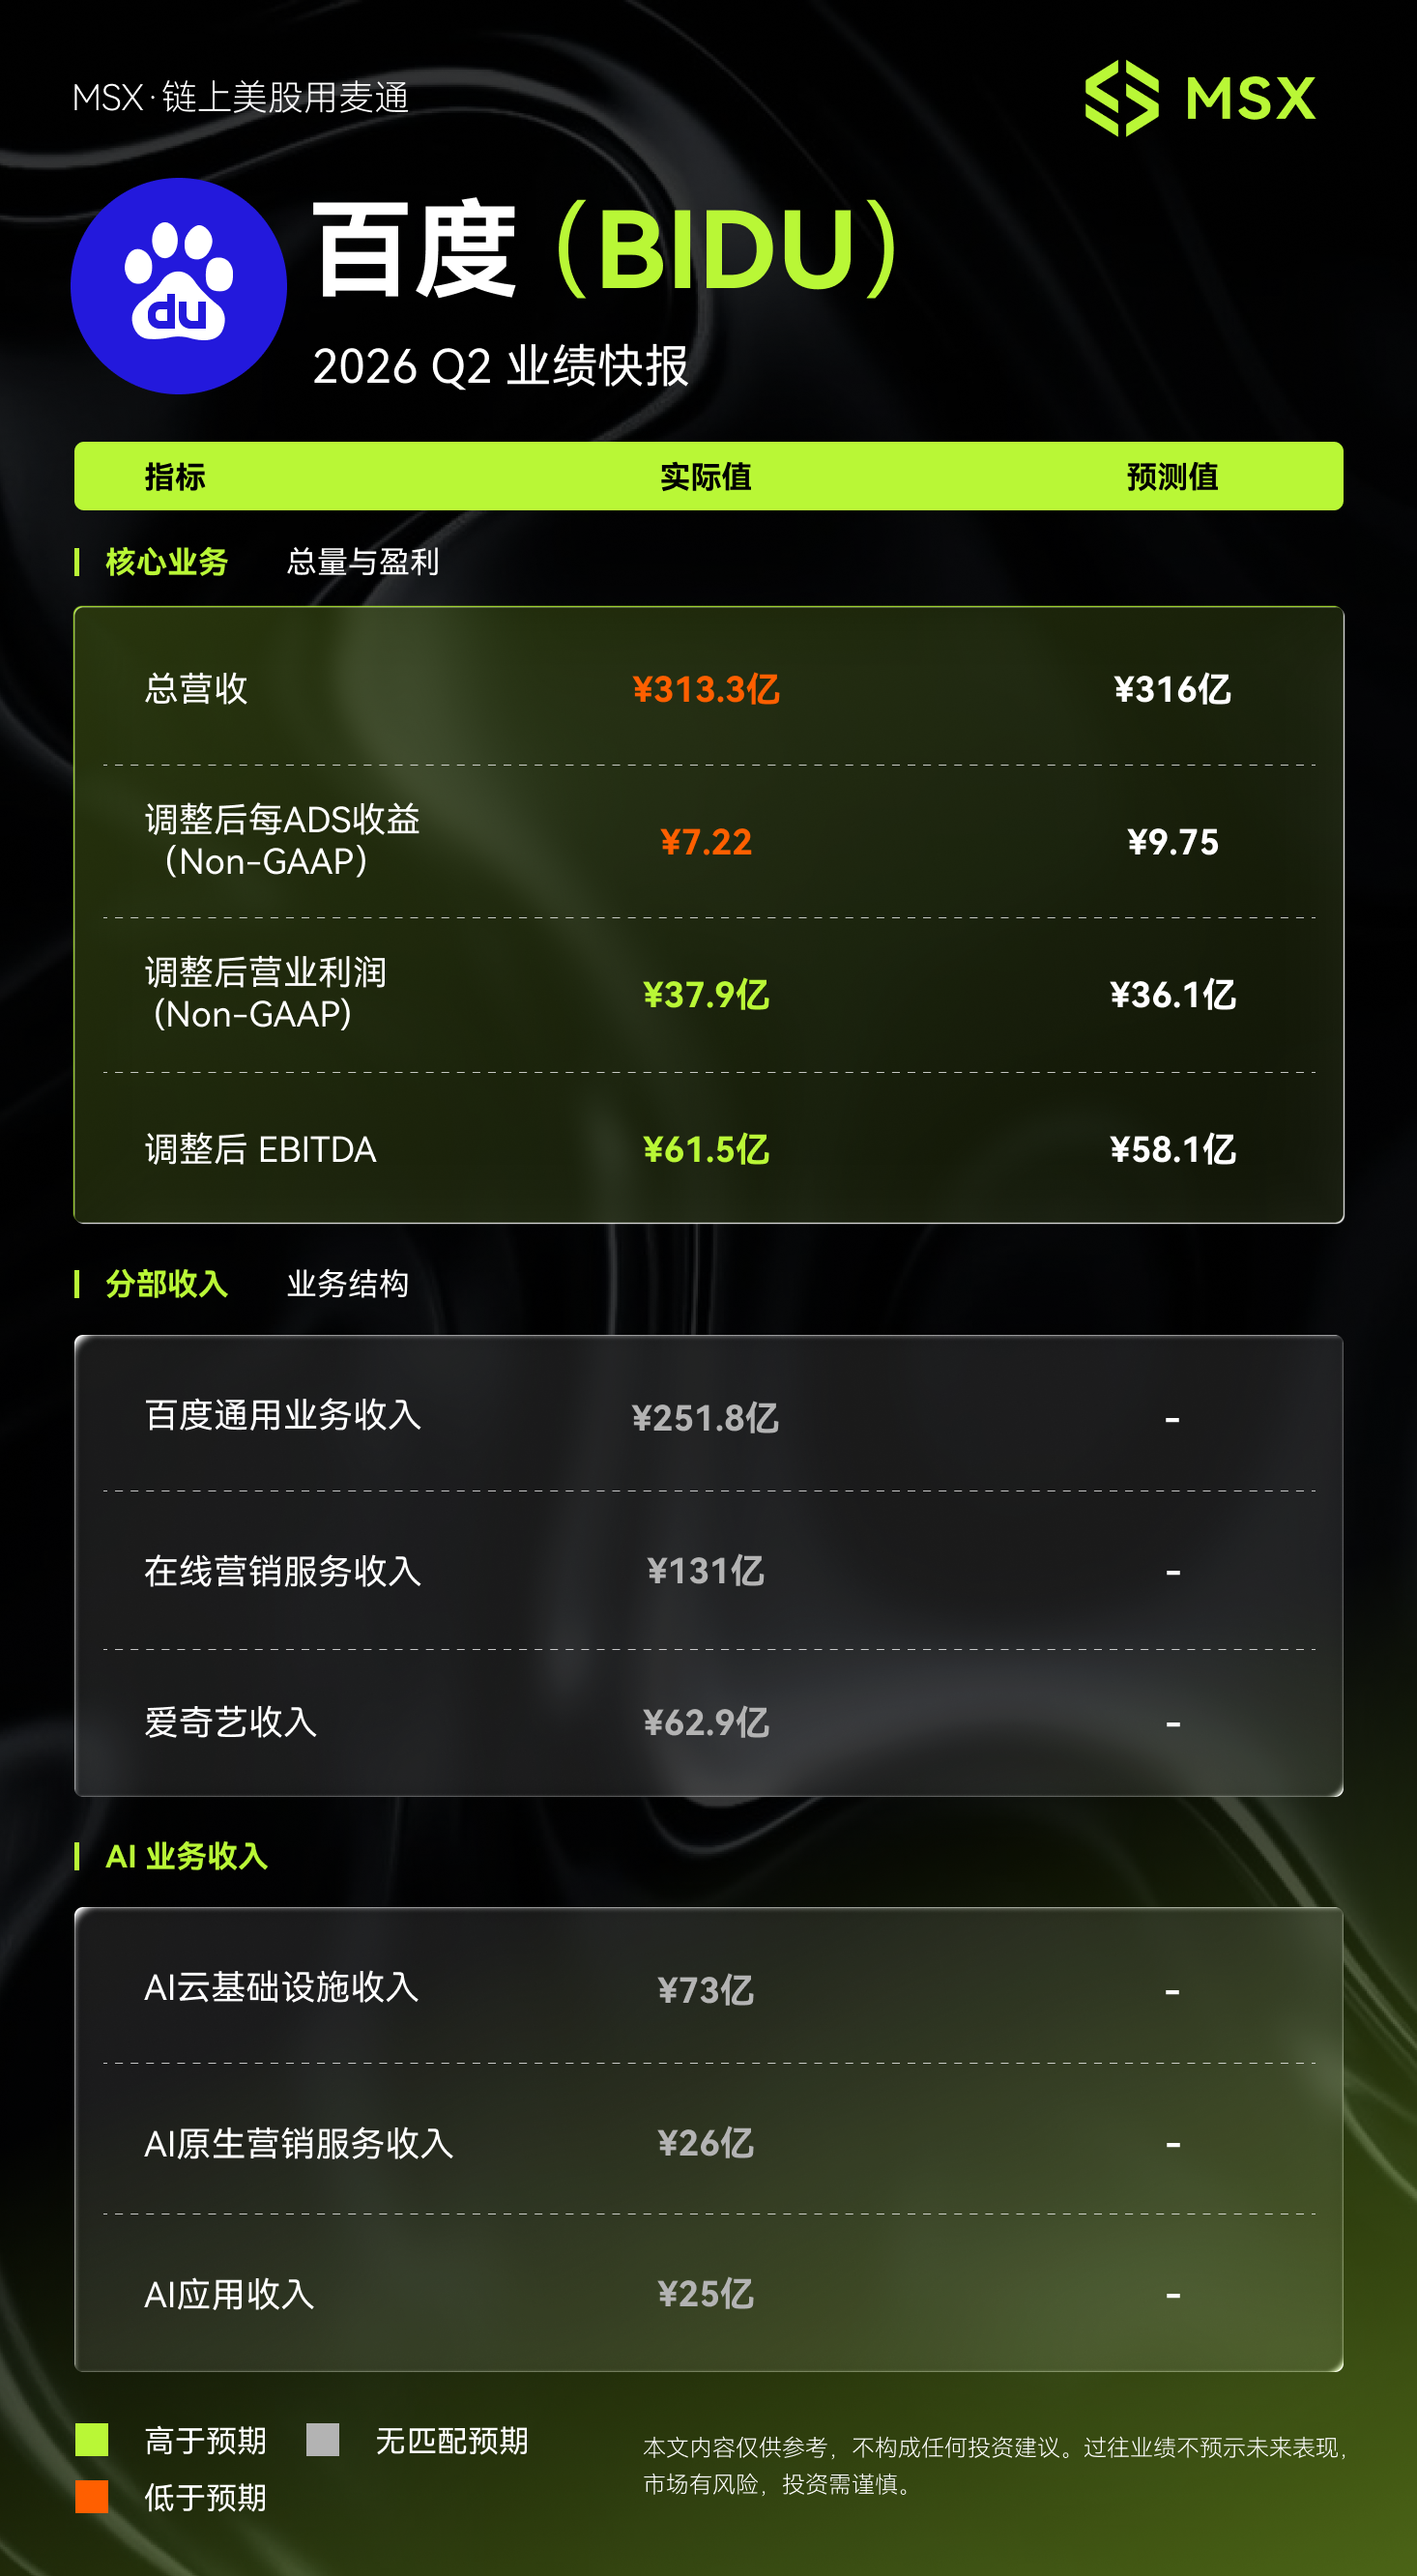
MSX US Stock Daily Observation: Baidu 2026 Q2 Earnings: AI Revenue Accounts for Half of Core Business for Two Consecutive Quarters, 283% GPU Cloud Growth Boosts Business Transformation

**MSX Daily US Stock Observation: Baidu 2026 Q2 Earnings Report** Baidu's Q2 2026 earnings present a clear picture of a company in transition. Total revenue declined slightly to RMB 313.25 billion, missing market expectations. This was driven by a continued double-digit contraction (-19%) in its core online marketing (advertising) business. The key highlight is the structural shift within the company's operations. AI-related revenue reached RMB 125 billion, accounting for approximately half of Baidu's core business income for the second consecutive quarter. Within AI, growth is heavily skewed towards infrastructure: AI cloud infrastructure revenue grew 50% year-over-year to RMB 73 billion, with GPU cloud revenue surging 283%. In contrast, AI application and AI-native marketing services revenue grew only 3% and remained flat, respectively, indicating slower commercialization on the application side. Profitability metrics were mixed. While adjusted operating profit and EBITDA exceeded expectations, demonstrating cost control, adjusted earnings per ADS of RMB 7.22 fell short by about 26%. This gap is largely attributed to depreciation and amortization costs linked to significant AI infrastructure investments, which continue to pressure bottom-line profit realization. The company holds a substantial cash position of RMB 2831 billion, providing runway for continued investment. The critical challenge ahead is translating the explosive growth in AI infrastructure (like GPU cloud) into stronger monetization from AI applications to bridge the gap between operational profit and per-share earnings.

Odaily星球日报08/19 08:10

MSX US Stock Daily Observation: Baidu 2026 Q2 Earnings: AI Revenue Accounts for Half of Core Business for Two Consecutive Quarters, 283% GPU Cloud Growth Boosts Business Transformation

Odaily星球日报08/19 08:10

活动图片