Solana’s mid-range trap – Here’s why SOL traders should stay cautious!

ambcryptoPublished on 2026-03-28Last updated on 2026-03-28

Abstract

Solana (SOL) faces a challenging market environment after failing to sustain a bullish breakout. Despite Bitcoin's rally to $76K in mid-March, SOL was unable to defend the $89.9 range high, signaling bearish shift. Currently trading near the mid-range level of $83.3, technical indicators show strong bearish momentum. The DMI confirms a downtrend, while the RSI nears oversold territory and OBV indicates increasing selling pressure. Although a bounce from mid-range support is possible, entering long positions is risky due to negative market sentiment. Key liquidation levels are noted at $79 (support) and $94–$98 (resistance). A short-term rally would require SOL to reclaim the $83–$85 zone. Traders should remain cautious, as a drop to $79 is possible in the next 24–48 hours.

Solana [SOL] bulls have faced a tough situation in recent weeks. Bitcoin’s [BTC] rally to $76K by 17 March saw Solana prices break out of a range that it had been within since the first week of February.

This range breakout naturally meant momentum and volume were on the bulls’ side, convincing traders that more gains were possible. In hindsight, the failure to defend the $89.9-range highs was the first sign of bearishness.

Source: SOL/USDT on TradingView

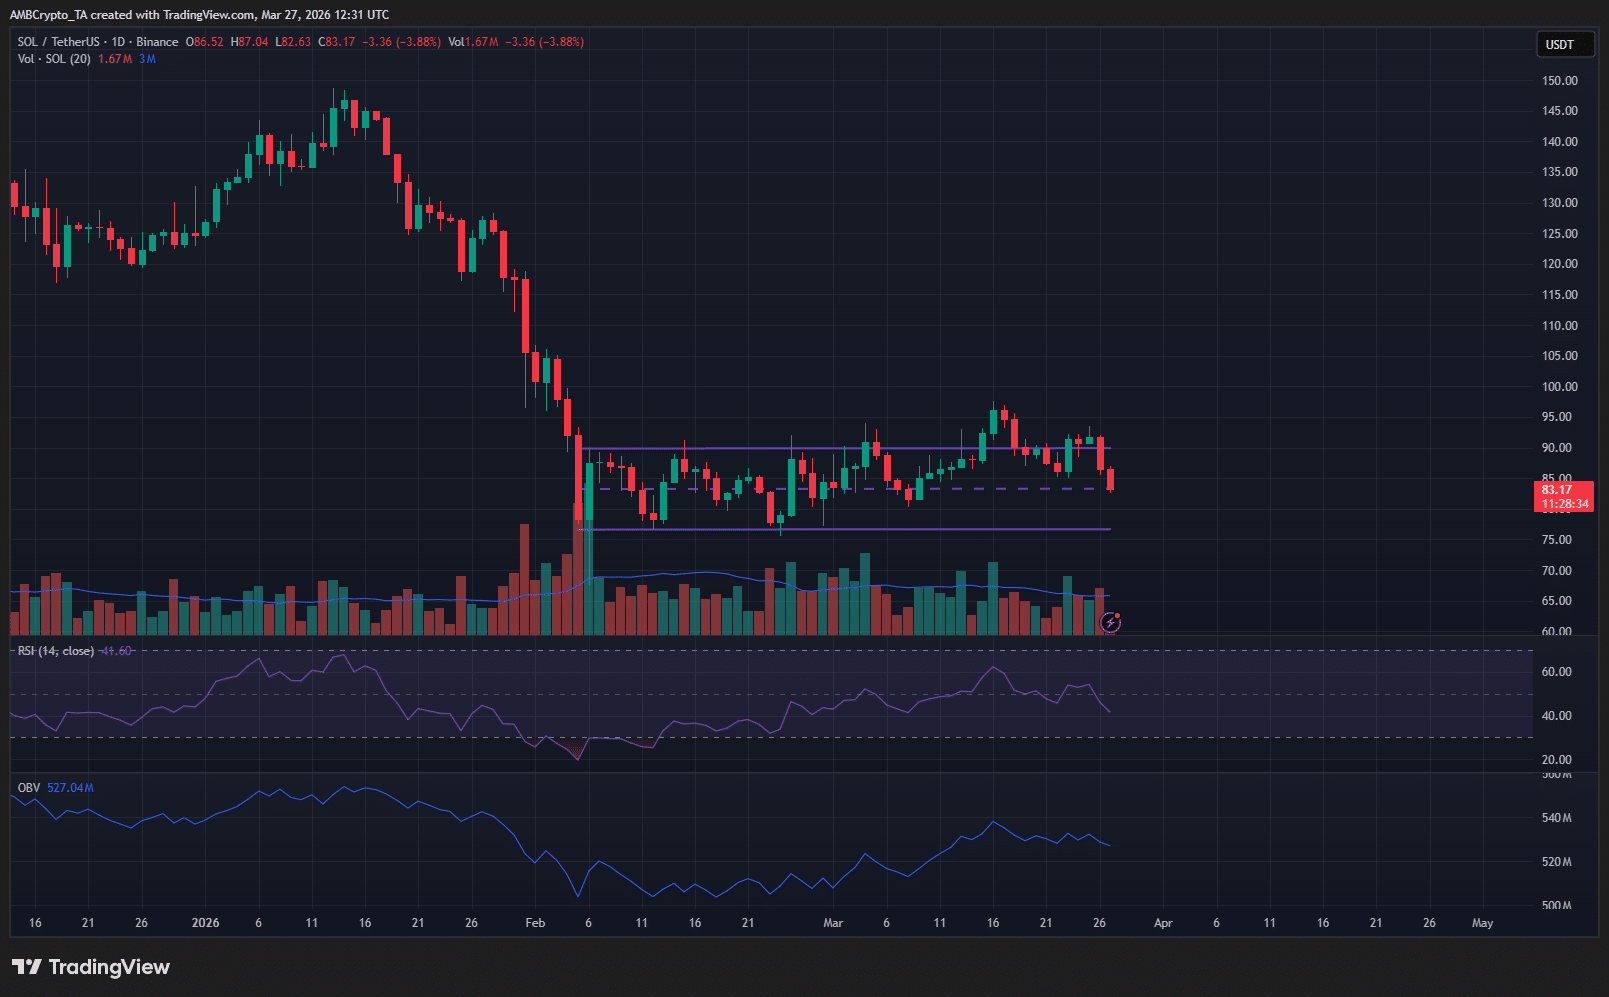
The 1-day chart showed that the range formation was only a consolidation after a sharp downtrend. During this consolidation, the OBV has trended higher to signal accumulation.

At the same time, the RSI remained above neutral-50 to sustain the idea that bullish momentum could last. In the broader picture, any rally would have struggled to overcome the $105-$120 supply zone.

The most recent one was unable even to break the $100-level. With the price back at the mid-range level, what should traders expect next?

Bounce or a further breakdown ahead for SOL?

Source: SOL/USDT on TradingView

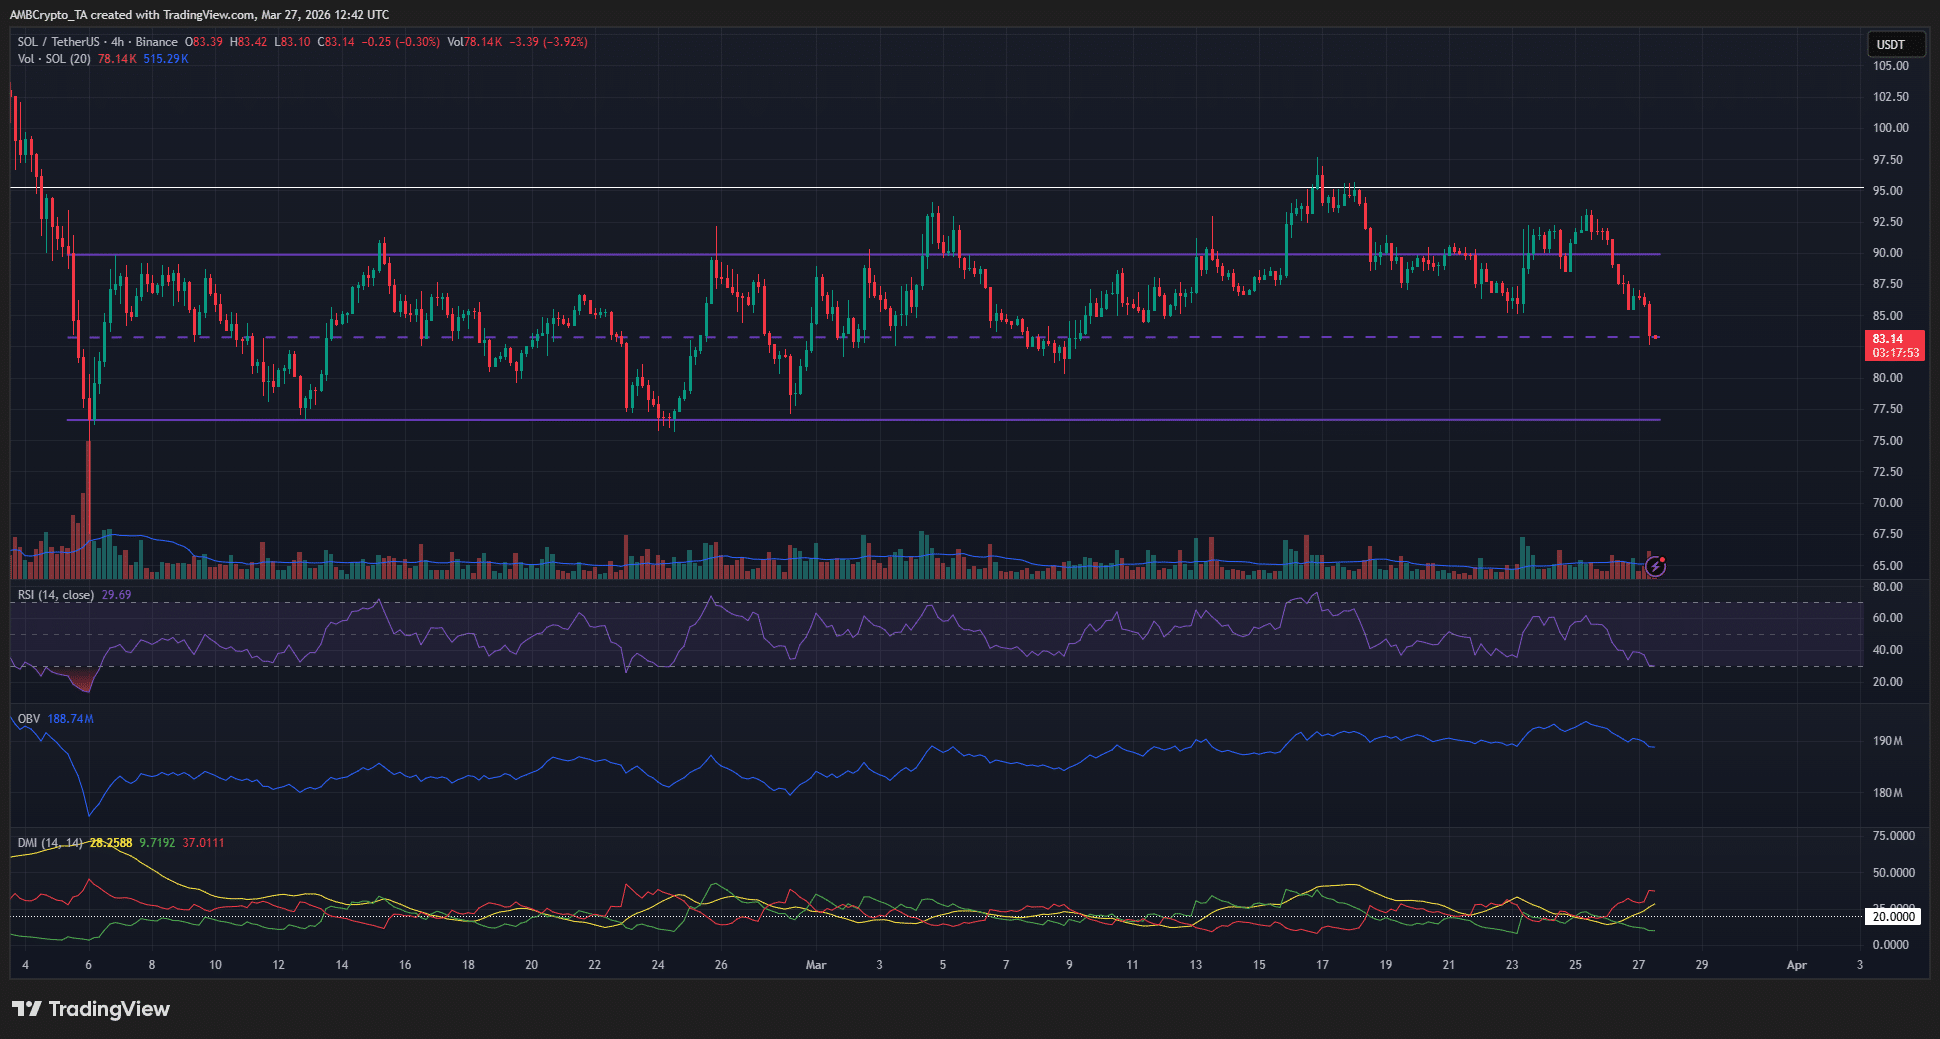
The range extended from $76.6 to $89.9, with the mid-point at $83.3. At the time of writing, Solana was trading slightly below the mid-range level. The technical indicators were also firmly bearish.

The DMI highlighted a strong downtrend in progress on the 4-hour timeframe, with the RSI falling towards the oversold zone. The OBV was also about to make new local lows to capture the selling volume over the past ten days.

It is possible that Solana would bounce from the mid-range support, but traders have to be careful. In a range, the range extremes are the most desirable zones for a trade entry targeting the opposing extreme.

At the mid-range, and given the recent market sentiment, it is difficult to justify entering long positions.

Source: CoinGlass

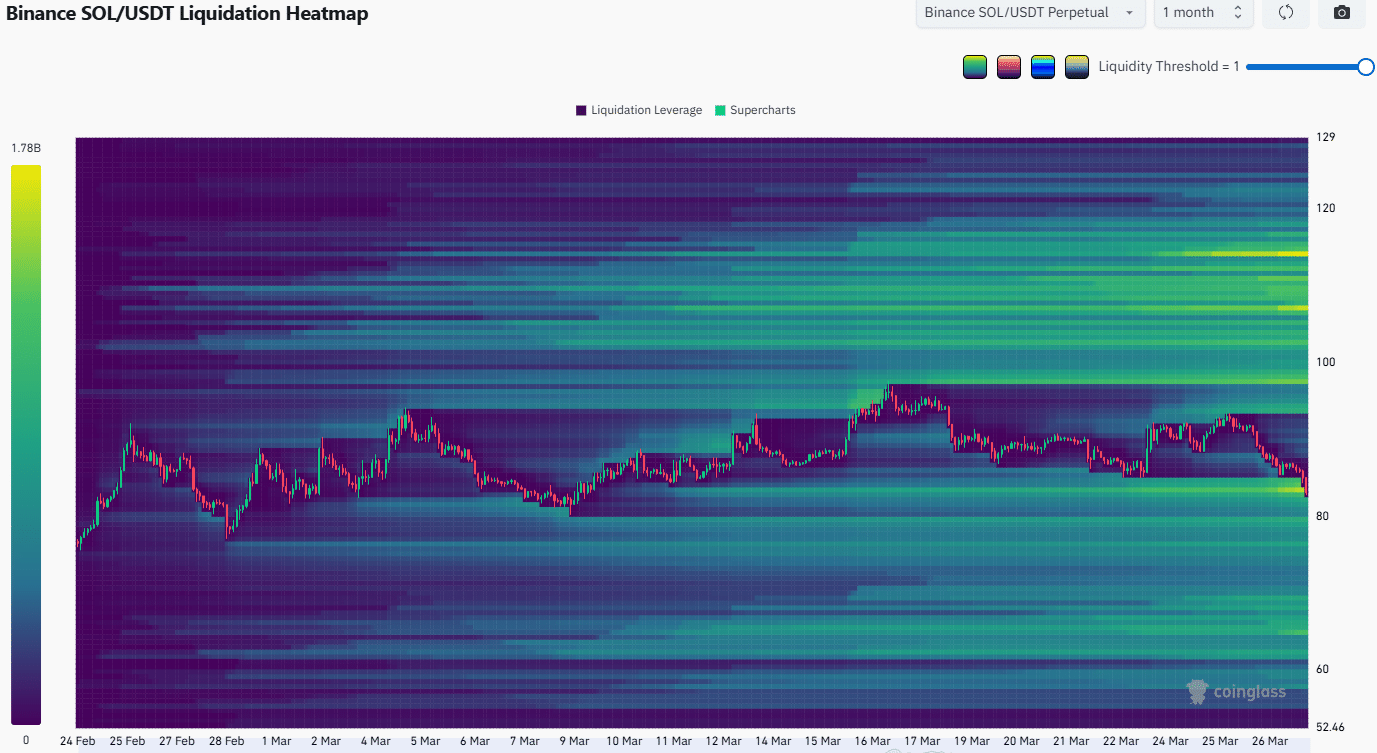
The Bitcoin long squeeze to the $66.5k-level, at the time of writing, had pulled SOL into the magnetic zone at $83. To the south, another pocket of long liquidations lay at $79, just below the $80.2 lows made on 08 March.

Traders will want to see the current liquidity hunt bounce back above $83-$85 before they can have some faith in a short-term rally. This move can go as high as $94-$98 in search of short liquidations.


Final Summary

  • Bitcoin’s sell-offs over the past two weeks affected SOL prices.
  • In the next 24-48 hours, a drop to $79 is possible, but a short-term bounce would become possible if SOL climbs back above $83-$85.

Related Questions

QWhat was the key resistance level that SOL failed to defend, signaling the first sign of bearishness?

AThe failure to defend the $89.9-range highs was the first sign of bearishness.

QAccording to the article, what is the main reason traders should be cautious about entering long positions at the mid-range level?

AGiven the recent market sentiment and the strong bearish technical indicators, it is difficult to justify entering long positions at the mid-range.

QWhat two conditions must be met for a short-term rally in SOL to become possible, according to the final summary?

ASOL must climb back above the $83-$85 level, and a short-term bounce would then become possible.

QWhich broader supply zone would any SOL rally have struggled to overcome, as mentioned in the analysis?

AAny rally would have struggled to overcome the $105-$120 supply zone.

QWhat does the article identify as the possible target for a move higher if SOL bounces back above $83-$85?

AThis move can go as high as $94-$98 in search of short liquidations.

Related Reads

Anthropic Cries Wolf: Is the AGI Threat Real, or Just an IPO Story?

Anthropic has published an article titled "When AI builds itself," discussing the emerging concept of "recursive self-improvement," where AI begins to actively participate in designing, training, testing, and optimizing its own subsequent versions. The company presents internal data showing that by May 2026, over 80% of code merged into its codebase was written by Claude, its AI model. Claude's capabilities have expanded to handling complex, open-ended engineering tasks, achieving a 76% success rate in such areas, and even contributing to research processes, such as optimizing code performance and conducting AI safety experiments. Anthropic outlines an evolution from human-driven development to AI-assisted workflows, culminating in the current stage where AI agents can autonomously write, run, and delegate code. The company cautions that the path toward a "closed loop," where AI continuously improves itself, is becoming visible. It calls for coordinated global mechanisms to potentially slow or pause frontier AI development to allow safety research and societal structures to catch up. However, the timing of this warning coincides with Anthropic's preparations for an IPO, framing the narrative not just as a safety concern but also as a demonstration of Claude's advanced capabilities and its integral role in accelerating Anthropic's own R&D—creating a potential "flywheel" effect for competitive advantage. This contrasts with OpenAI's recent, more policy-oriented discussion of the same risks, highlighting the competitive dynamics in the AI industry as companies position themselves in both the technological and regulatory landscape.

marsbit46m ago

Anthropic Cries Wolf: Is the AGI Threat Real, or Just an IPO Story?

marsbit46m ago

BIT Research: ETF Purchases Have Slowed, Strategy (MicroStrategy) Has Slowed, What Else Can Drive Bitcoin's Rise?

Market Refocus on Inflation and Rate Expectations Weighs on Bitcoin Currently, the market is in a phase of macro-repricing dominated by inflation and interest rate expectations. Bitcoin, which previously benefited from easy liquidity and low inflation, is seeing its core bullish drivers weaken. These drivers were market expectations for interest rate cuts and strong inflows from Bitcoin ETFs and institutions like MicroStrategy (referred to as "Strategy" in the text). The logic has shifted. Recent high inflation data (e.g., CPI hitting 3.8% in a May 2026 report) has caused the market to sharply reduce its rate cut expectations for 2025 and even price in potential hikes. This is a key constraint for Bitcoin, as it lacks cash flows and is highly sensitive to rate expectations. Concurrently, institutional capital flows have slowed significantly. Following the hot CPI data, Bitcoin ETFs saw accelerated outflows, with around $4.3 billion leaving over a period. MicroStrategy's ability to keep adding substantial Bitcoin to its balance sheet is also diminishing. Together, ETF and MicroStrategy holdings total roughly $110 billion, but their momentum as growth engines is cooling. In summary, Bitcoin's current pressure stems not from its own fundamentals but from a changing macro environment. As long as inflation stays elevated, Bitcoin is likely to remain in a consolidating phase. However, historically, inflation eventually peaks. Once it recedes and rate cut expectations rebuild, institutional capital could return, potentially fueling a new and more robust recovery phase for Bitcoin.

marsbit53m ago

BIT Research: ETF Purchases Have Slowed, Strategy (MicroStrategy) Has Slowed, What Else Can Drive Bitcoin's Rise?

marsbit53m ago

Earning 1000 Trillion in Half a Year, 'Pocketing' 20 Million per Capita: This Round of Wealth Creation in the Korean Stock Market is Unprecedented in Scale

The South Korean stock market is experiencing an unprecedented wealth surge in 2026, with household equity and fund asset values soaring by over 1,000 trillion KRW (~$730bn) year-to-date. This translates to an average per capita wealth increase of roughly 20 million KRW, fueled by a historic 109% rally in the KOSPI index. The boom is driven by three converging forces: an AI-driven semiconductor supercycle boosting giants like Samsung and SK Hynix; the government's "Value-Up" market reforms addressing long-standing corporate governance issues; and aggressive real estate regulations that have locked capital within financial markets, preventing profits from flowing back into property. This has triggered a wealth effect, boosting high-end consumption significantly. However, the gains are highly concentrated. The two semiconductor behemoths account for over half the index's value, but retail investors own relatively low stakes in them, systematically missing the biggest rallies. Wealth and consumption benefits are skewed towards luxury goods and imported cars, bypassing mainstream retail. Further risks stem from excessive leverage, with high trading volume in leveraged ETFs, and a market sentiment heavily reliant on the AI sector's fortunes and speculative rumors. While this cycle marks a potential shift from real estate to equities as a primary wealth generator for Koreans, its sustainability, amid structural imbalances and leverage, remains a critical test.

marsbit59m ago

Earning 1000 Trillion in Half a Year, 'Pocketing' 20 Million per Capita: This Round of Wealth Creation in the Korean Stock Market is Unprecedented in Scale

marsbit59m ago

Trading

Spot
Futures

Hot Articles

Discussions

Welcome to the HTX Community. Here, you can stay informed about the latest platform developments and gain access to professional market insights. Users' opinions on the price of S (S) are presented below.

活动图片