Solana TVL hits $8.6B six-month lows: Is $80 SOL price next?

cointelegraphPublished on 2025-12-17Last updated on 2025-12-17

Abstract

Solana's native token SOL has declined 52% from mid-September to late November, breaking key long-term support levels and signaling a potential drop below $100. The Total Value Locked (TVL) on Solana fell to a six-month low of $8.67 billion, down 34% from its September peak. Major DeFi protocols like Jito, Jupiter, and Raydium saw significant decreases in activity. On-chain metrics further indicate weakening demand, with network fees down 23% monthly and active addresses declining. Memecoin trading volume on Solana network collapsed by 95% from its peak, reflecting reduced ecosystem engagement. Technically, SOL is trading within a bear pennant pattern, with a breakdown projecting a potential 32% decline toward $86. While the 200-week EMA at $118 may provide temporary support, analysts suggest SOL could soon test the $90-$100 range.

Solana’s native token SOL (SOL) fell 52% between Sept. 18 and Nov. 21, following the broader altcoin market crash that saw Bitcoin hit a seven-month low of $80,000. As a result, SOL price has lost key long-term support levels, with onchain and technical data suggesting a deeper correction below $100.

Key takeaways:

  • Solana's total value dropped to a six-month low of $8.67 billion.

  • Solana’s memecoin weekly trading volume has collapsed by 95% in 2025.

  • A bear pennant projects SOL price to drop toward $86.

Solana’s TVL drops to June levels

The total value locked (TVL) on the Solana blockchain has dropped by over 34% to a six-month low $8.67 billion on Wednesday from its peak of $13.22 billion reached on Sept. 14. Solana’s TVL has remained below $10 billion over the last 30 days.

Solana TVL. Source: DefiLlama

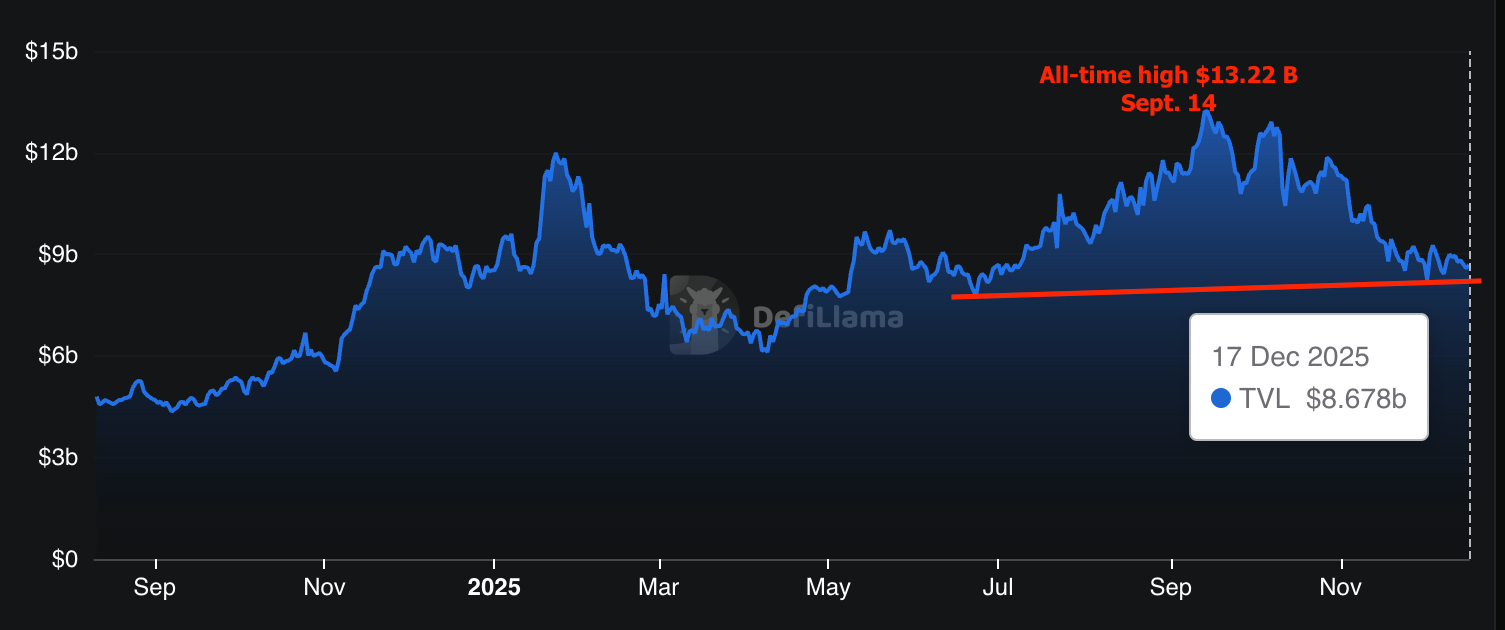
Data from DefiLlama shows that the subsequent drop in TVL was led by Jito liquid staking, with a 53% decrease since mid-September. Other major decentralized applications, such as Jupiter DEX, Raydium and Sanctum protocol, registered 30%, 46% and 46% declines, respectively.

Related: Solana ETFs record 7-day inflow streak despite price slump

SOL’s potential to drop below $100 is supported by the decline in Solana’s network fees, active addresses and transaction count over the last seven days.

Blockchains ranked by 30-day fees, USD. Source: Nansen

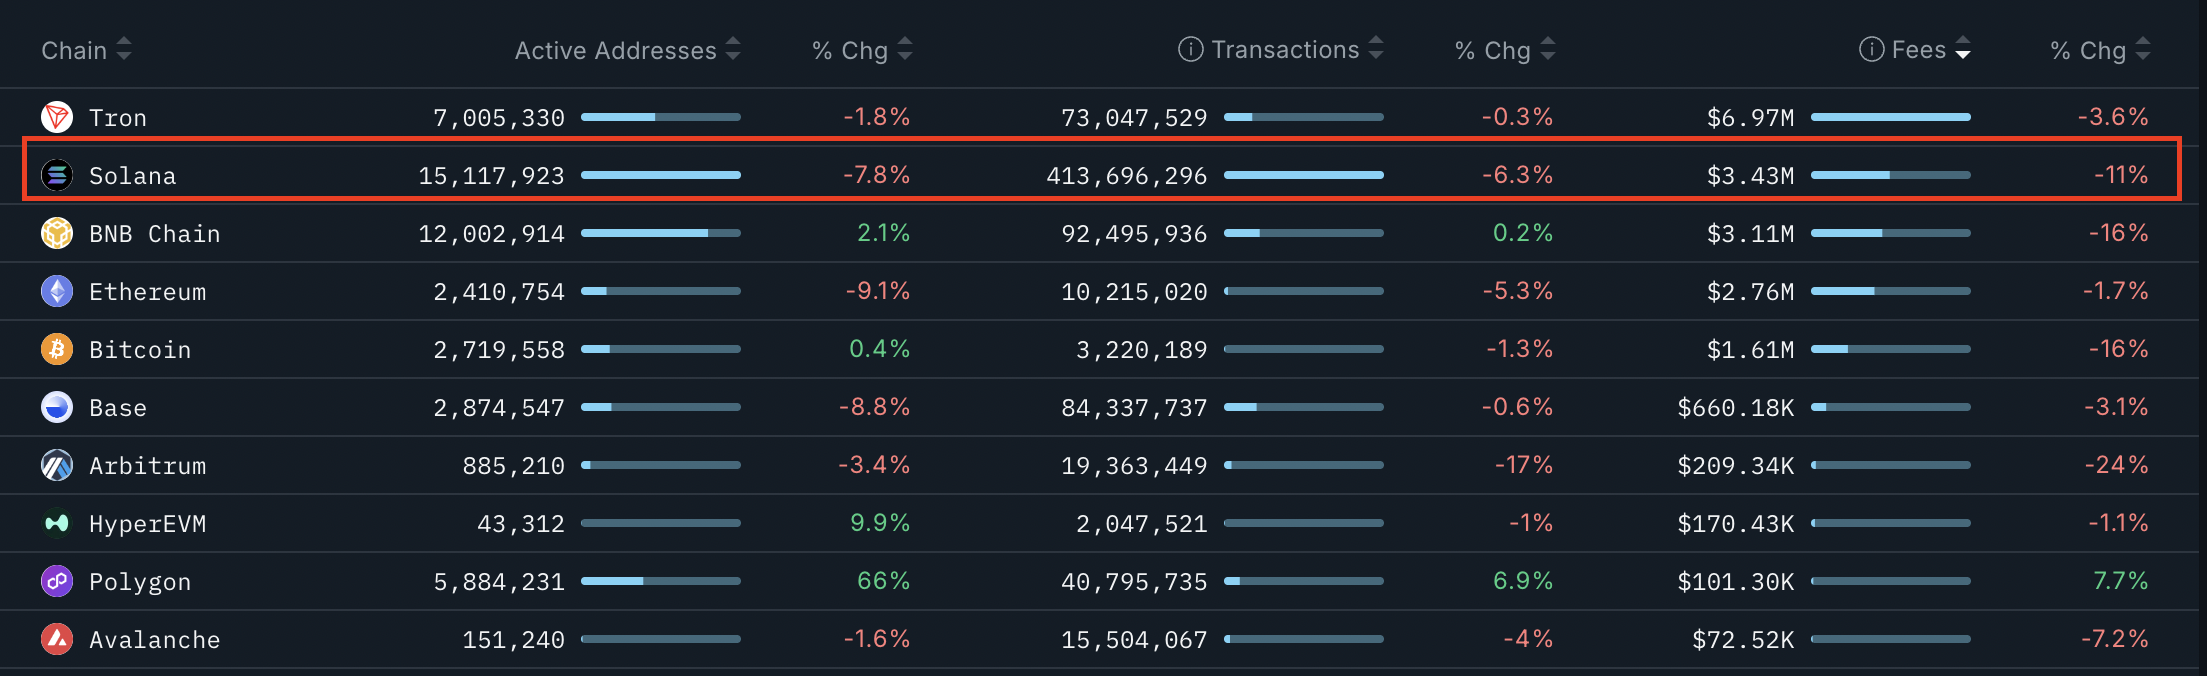
Solana’s chain fees totaled $3.43 million over the past week, representing an 11% decrease from the previous week and a 23% drop from last month.

Similarly, the number of active addresses (AAs) on Solana’s base layer decreased by 7.8% over the same period, while the number of transactions decreased by 6.3% over seven days.

The drops in AAs, transaction count and network fees suggest reduced onchain demand for SOL, adding to the overhead pressure.

Solana memecoin volume collapses

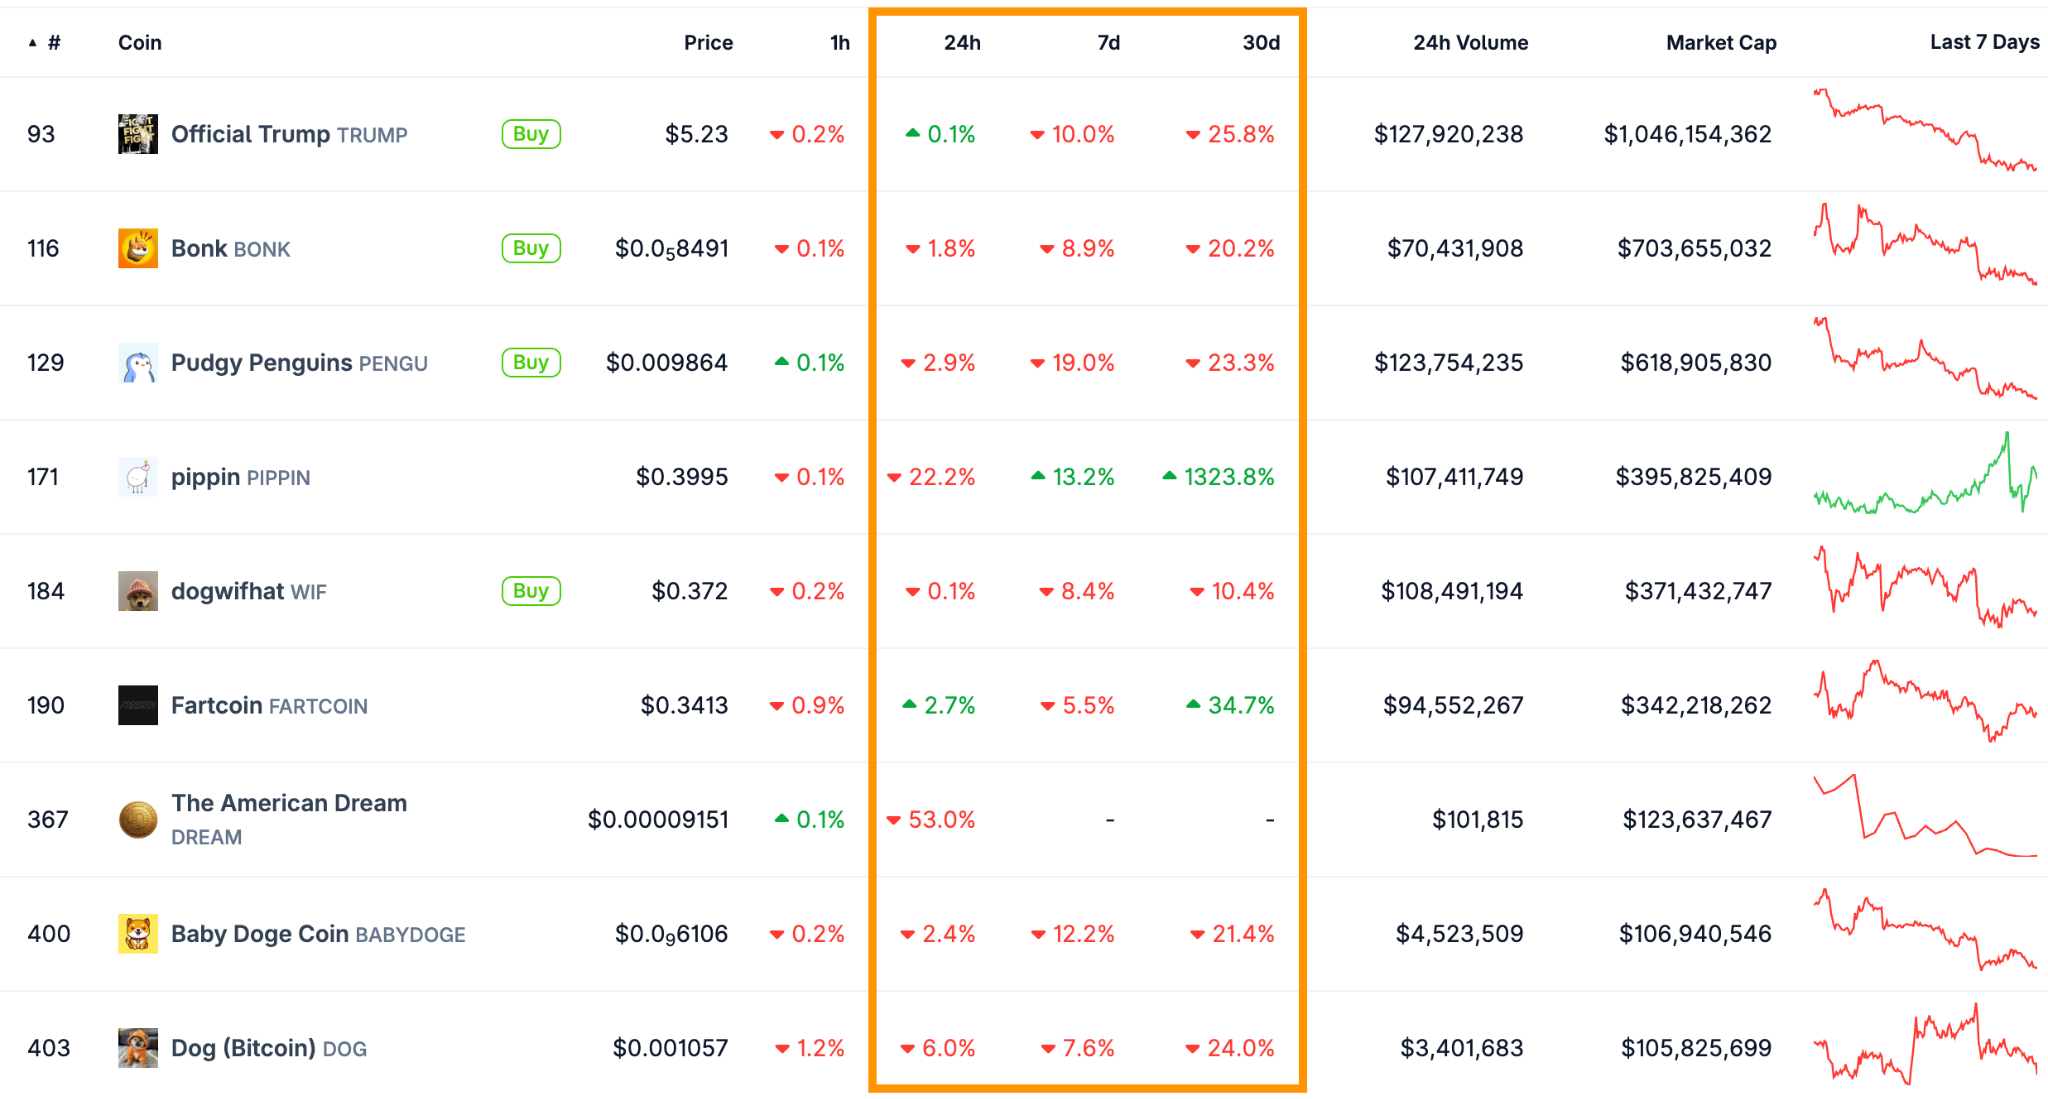
The fall in Solana’s TVL mirrors the bearishness in Solana-based memecoins as these flashed red across the board.

Solana-based memecoins have posted double-digit losses on the weekly and monthly time frames, as shown in the figure below. A majority of these tokens are down 10% to 25% from local highs.

Solana-based memecoins performance. Source: CoinGecko

This drop in the prices of Solana-based memecoins was accompanied by a decrease in DEX activity on the layer-1 blockchain. The weekly DEX volume on Solana attributed to memecoins remains muted, having dropped 95% to $2.7 billion from its peak of $56 billion recorded in January, according to data from Blockworks Research.

Memecoin trading volume on Solana. Source: Blockworks Research

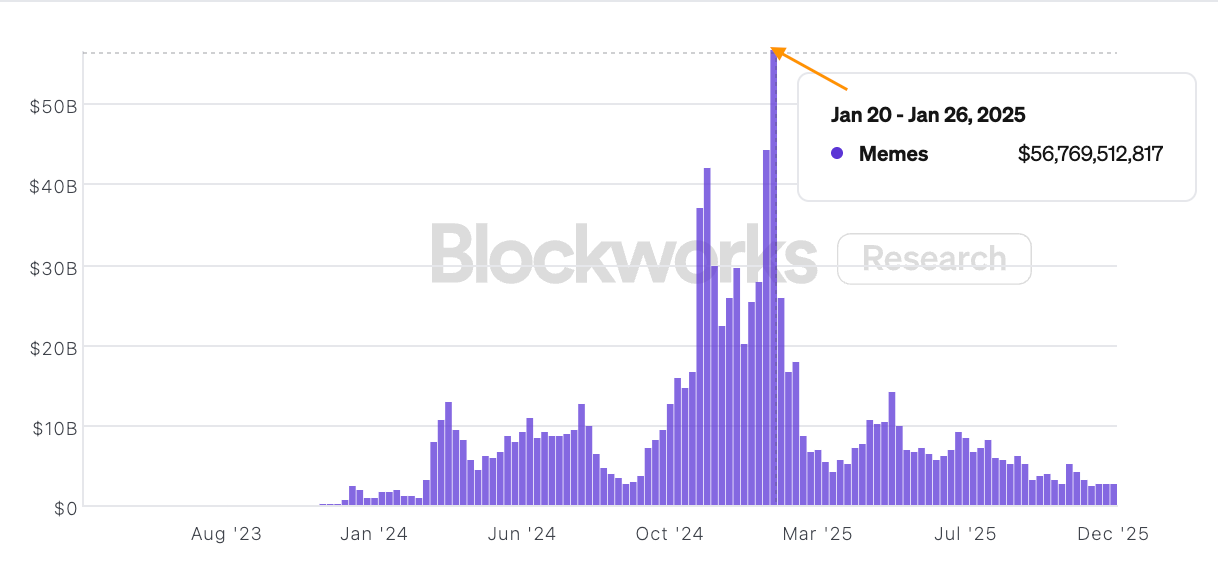
The decline in memecoin activity on Solana indicates low network activity and waning usage, which negatively impacts demand and the SOL price.

SOL’s “bear pennant” targets $90,000

Data from Cointelegraph Markets Pro and TradingView indicate that SOL is trading below a bearish pennant, suggesting a risk of further downside.

A bear pennant is a downward continuation pattern that occurs after a significant drop, followed by a consolidation period at the lower end of the price range.

A break below the pennant’s support line at $135 last week cleared the path for the next leg down for the altcoin. The measured target of the bear pennant is at $86, or a 32% decline from its current price level.

SOL/USD two-day chart. Source: Cointelegraph/TradingView

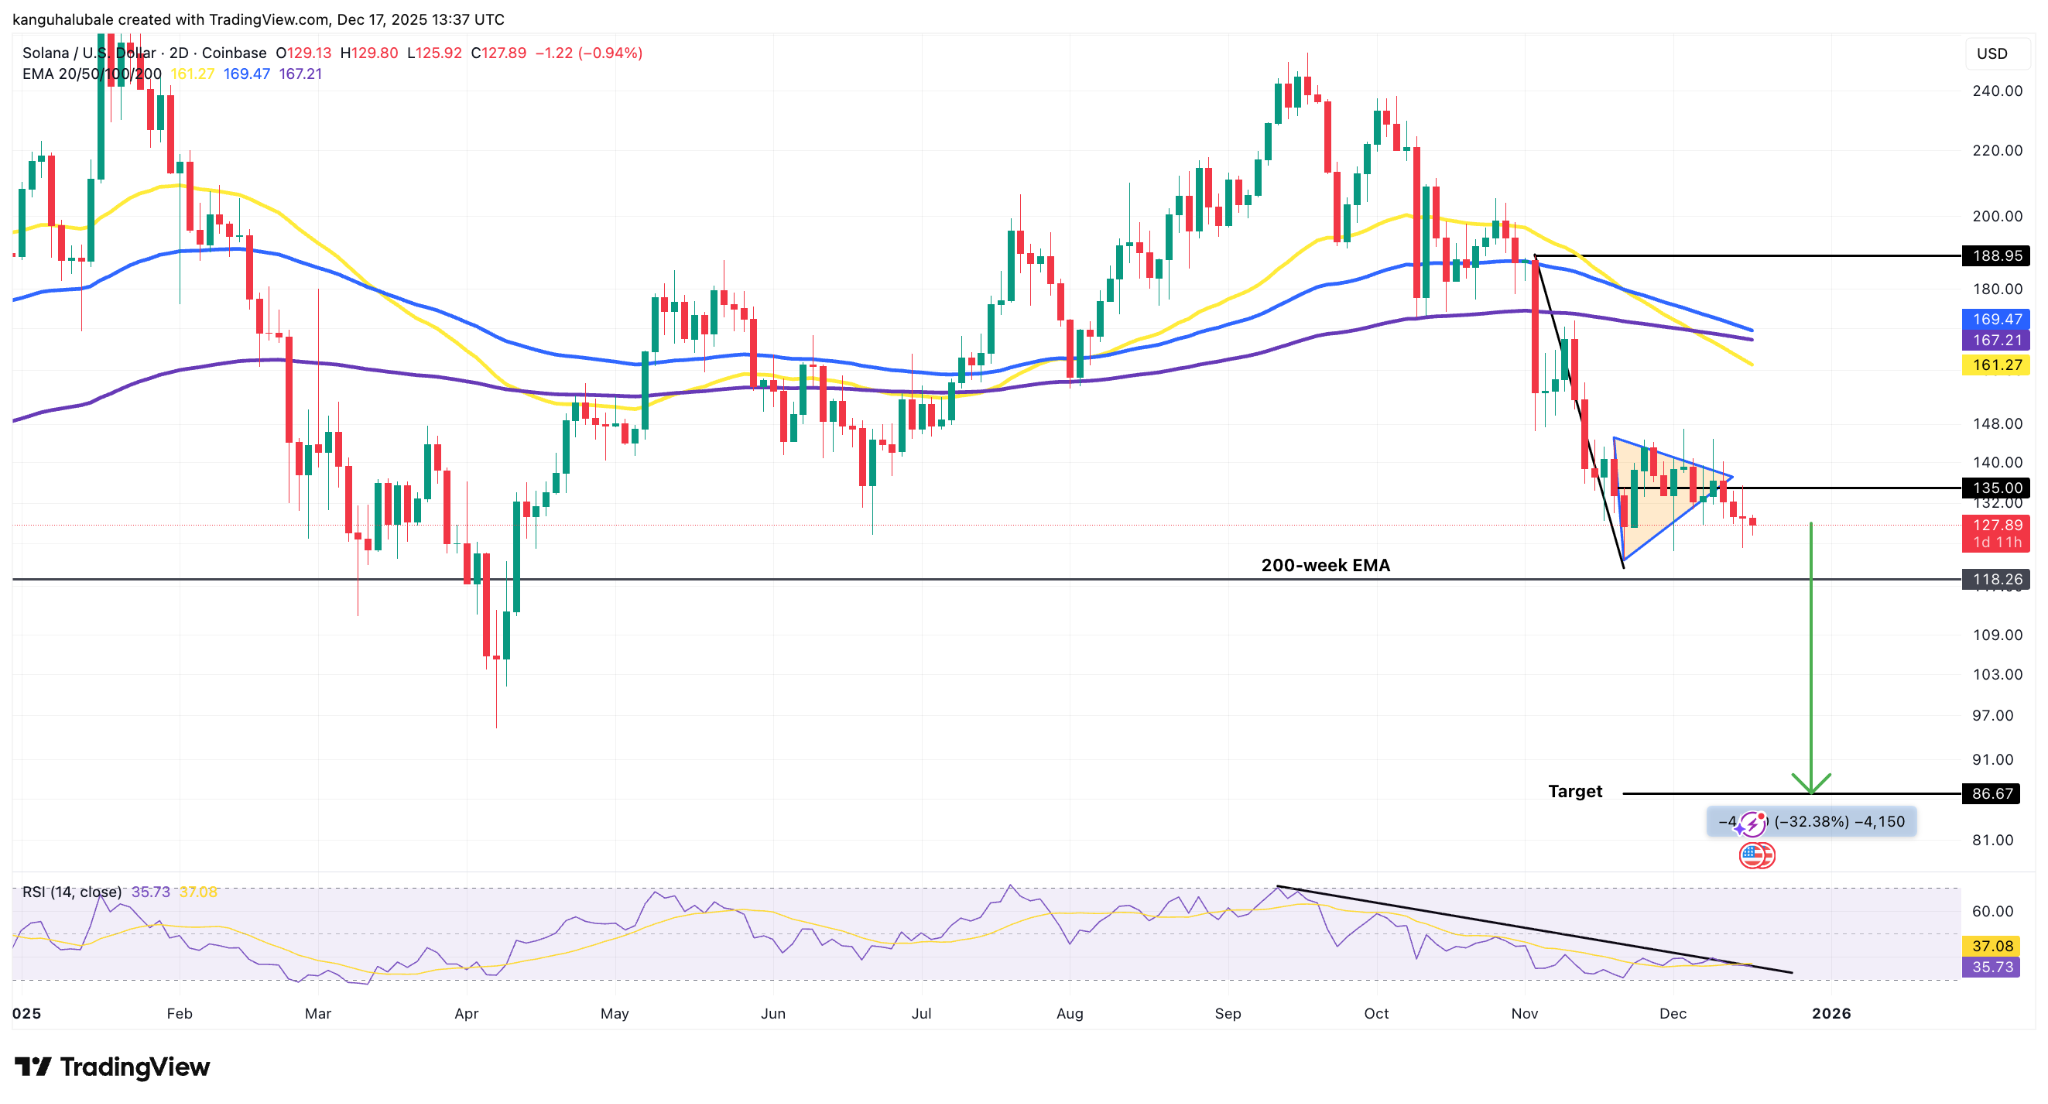
Before reaching this level, SOL could find support from the 200-week EMA at $118, where bulls are expected to mount aggressive defense.

“A bear pennant is forming on Solana’s four-hour chart,” said pseudonymous leverage trader Grim in an X post on Wednesday, adding:

“I would not be surprised to see Solana between $90 and $100 soon.”

As Cointelegraph reported, SOL price breaking below the support line of the symmetrical triangle at $126 would signal that the bears are in control, leading to a deeper correction toward $95.

This article does not contain investment advice or recommendations. Every investment and trading move involves risk, and readers should conduct their own research when making a decision. While we strive to provide accurate and timely information, Cointelegraph does not guarantee the accuracy, completeness, or reliability of any information in this article. This article may contain forward-looking statements that are subject to risks and uncertainties. Cointelegraph will not be liable for any loss or damage arising from your reliance on this information.

Related Reads

Super-Rich Hoarded Record Cash in February, Stock Market Hit New Highs Four Months Later: Who's Getting Fooled?

In February, the total assets in US money market funds reached a record high of approximately $8.25 trillion, a trend highlighted by high-net-worth individuals increasing their cash holdings. Notably, Warren Buffett's Berkshire Hathaway amassed a $381.7 billion cash pile ahead of his 2025 retirement, while other prominent figures like Peter Thiel sold tech stocks, fueling narratives of wealthy investors seeking safety. However, by June, the trend reversed. Money market fund assets fell to around $7.87 trillion, indicating a flow of capital back into equities. Concurrently, the S&P 500 and Nasdaq reached all-time highs, with the S&P 500 surpassing 7600 points. This market surge occurred despite the earlier defensive moves, highlighting a potential opportunity cost for those who retreated to cash. Analysis shows that since early 2022, the S&P 500's total return significantly outpaced that of prime money market funds. The capital shifted from equities appears to have been partly reallocated into alternative investments like real estate, art, and private credit, especially among ultra-high-net-worth individuals. Meanwhile, major investment banks like Goldman Sachs and Morgan Stanley have raised their year-end targets for the S&P 500, citing AI-driven earnings growth, while also cautioning about risks including market concentration and economic fragility beneath the surface rally.

marsbit19m ago

Super-Rich Hoarded Record Cash in February, Stock Market Hit New Highs Four Months Later: Who's Getting Fooled?

marsbit19m ago

Robot Vacuums Have Been Competing for 20 Years, So Why Are 90% of Chinese Households Still Hesitant?

The article explores why over 90% of Chinese households are still hesitant to adopt robotic vacuum cleaners despite two decades of industry development, identifying a core "trust gap" as the primary barrier. The central issue is not a lack of need, but user concerns about reliability in dynamic, real-world home environments. Common anxieties include the robot dragging pet waste, colliding with transparent objects, tangling in cords, scattering cat litter, getting stuck on thresholds, missing corners under furniture, and requiring high-maintenance bases that develop odors. The industry's past focus on competing on technical specs (suction power, mopping functions) has not adequately addressed these practical usability and trust problems. The piece then examines DJI's entry into the market with its ROMO 2 model as a potential new approach. Leveraging its expertise in spatial perception and obstacle avoidance from drones, DJI's solution emphasizes "less intervention" through three key principles: less manual re-cleaning, less user rescue missions, and less maintenance. Specific ROMO 2 features highlighted include advanced obstacle recognition (handling transparent objects and small items), adaptive leg mechanisms for climbing thresholds (up to 8.5cm), an extendable arm for reaching under furniture, AI for identifying and appropriately handling different mess types (e.g., avoiding scattering dry debris), and a self-cleaning base designed to minimize user upkeep. The article argues the next phase of competition should shift from a "parameter race" to a "trust race." It draws a parallel to the iPhone's simplification of the smartphone, suggesting that focusing on a reliable, low-hassle user experience—where people feel confident leaving their floors to the machine—is what's needed to finally convince the vast majority of观望ing families. The ultimate test for products like the ROMO 2 will be long-term user adoption, retention, and口碑, not just technical specifications.

marsbit19m ago

Robot Vacuums Have Been Competing for 20 Years, So Why Are 90% of Chinese Households Still Hesitant?

marsbit19m ago

The Unclear American Economy: Resilient or Cooling Down?

**U.S. Economic Outlook: Resilient or Cooling Down?** This analysis examines whether the U.S. economy is heading towards a recession. While still growing, the economy shows significant signs of strain. Key data points include Q1 2026 GDP growth of 1.6% and Q1 PCE inflation at 4.5% (annualized), more than double the Fed's target. The labor market remains resilient but is softening, with unemployment at 4.3%. Critical recession indicators present a mixed picture: the yield curve has normalized after a prolonged inversion (historically a late-cycle signal), and the Conference Board's Leading Economic Index has been declining. Current recession probability for 2026 is estimated at 19%, but rises to 41% for 2027, indicating heightened delayed risks. Major pressures are building: a wall of corporate debt refinancing at higher rates, depleted consumer savings, a contracting housing sector, and an energy price shock. The economy exhibits stagflationary characteristics—high inflation alongside slowing growth—which constrains the Federal Reserve's policy options. Historical patterns show recessions are often preceded by Fed tightening and yield curve inversions. If a recession occurs, it is expected to be mild, similar to 2001 rather than 2008. For investors, a defensive portfolio shift toward staples, healthcare, and short-term high-quality bonds may be prudent, while maintaining a long-term, diversified perspective. Key developments to monitor include upcoming GDP, employment, and inflation data, as well as policy signals from the new Fed Chair.

marsbit26m ago

The Unclear American Economy: Resilient or Cooling Down?

marsbit26m ago

Trading

Spot
Futures

Hot Articles

Discussions

Welcome to the HTX Community. Here, you can stay informed about the latest platform developments and gain access to professional market insights. Users' opinions on the price of SOL (SOL) are presented below.

活动图片