Solana Has Dropped To Historically Oversold Levels – It’s Worse Than FTX Levels

bitcoinistPublished on 2026-06-09Last updated on 2026-06-09

Abstract

Solana (SOL) has entered deeply oversold territory, with its monthly Relative Strength Index (RSI) dropping to 38.84—a level analysts note is more extreme than during the FTX collapse in 2022. Despite trading significantly higher than its 2022 low of $8, the current RSI suggests an unusually severe decline in momentum. The cryptocurrency is now at a three-year low near $60, down over 80% from its 2025 high, and has posted eight consecutive red monthly candles. Analyst Ash Crypto highlights that prolonged oversold conditions can signal seller exhaustion and a potential price floor, which historically sets the stage for recovery. However, with no definitive technical confirmation of a bottom, SOL could remain oversold or face further downside. The analysis concludes that while a confirmed bottom doesn't guarantee massive gains, assets at such oversold RSI levels have historically produced significant rallies.

Solana (SOL) has officially entered deep oversold territory, a level analysts say is worse than the one the cryptocurrency reached during the FTX collapse. A decline in this area highlights just how bearish the market has become after months of volatility and steep price declines. Throughout last year, Solana experienced a massive rally that pushed its price firmly above $200. However, now the cryptocurrency has spent most of 2026 trading between lower levels around $60 and $95. Given the poor performance, a crypto analyst is questioning whether SOL may have finally hit a bottom.

Solana RSI Hits Oversold Levels Beyond FTX Crash

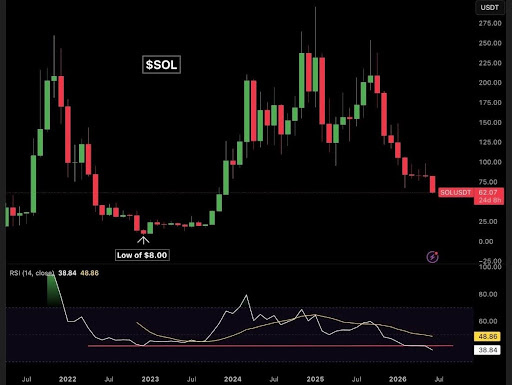
According to a detailed price chart shared by market expert Ash Crypto, Solana’s monthly Relative Strength Index (RSI) has dropped to 38.84, below the signal line sitting near 48.86. The analyst noted that this reading shows the altcoin has reached oversold levels even more extreme than those recorded when FTX collapsed into bankruptcy in 2022, and SOL fell to a low near $8.

The fact that the RSI is now lower despite the price being significantly higher than the 2022 $8 bottom suggests that the momentum decline in this cycle has been unusually severe. From a technical standpoint, prolonged oversold readings on the monthly RSI can signal a potential price reversal, reflecting seller exhaustion. However, oversold conditions can persist for a long time, as a low RSI alone does not confirm that a cryptocurrency has reached its bottom.

Source: X

Given the uncertainty around Solana’s future price direction, Ash Crypto is questioning whether the struggling altcoin has finally found a price floor. If a bottom has been reached, it would imply that most traders who wanted out have likely exited the market, leaving only holders who are committed to Solana long-term. This kind of capitulation often sets the stage for a recovery, as there is very little selling pressure left to disrupt the market.

Notably, after Solana dropped to the $8 bottom in 2022, the cryptocurrency eventually rallied to over $270 in 2025, representing a massive 3,000% recovery. While a confirmed bottom in this cycle does not guarantee the same scale of gains, historically, assets that hit a price floor with RSI readings tend to produce significant rallies.

What It Means If SOL Has Yet To Reach A Bottom

On the flip side, Ash Crypto stated in his analysis that Solana’s price has fallen to a three-year low of $60 after plunging more than 80% from its 2025 all-time high. The analyst noted that cryptocurrency has posted eight consecutive red monthly candles for the first time in its history, highlighting the depth of its bearish trend.

At the moment, there is no signal on SOL’s chart that definitively confirms a bottom or an imminent price reversal. This is because Solana remains firmly in bearish territory, which means its RSI can stay oversold longer than expected. If a price floor has not been reached, it suggests that SOL still has room for further downside, potentially pushing the cryptocurrency below its current level near $60.

SOL price fails to maintain uptrend | Source: SOLUSDT on Tradingview.com

Related Questions

QWhat oversold level has Solana's monthly RSI reached according to analyst Ash Crypto, and how does it compare to the FTX crash period?

AAccording to analyst Ash Crypto, Solana's monthly Relative Strength Index (RSI) has dropped to 38.84, which is below the signal line near 48.86. This reading indicates that Solana has reached oversold levels even more extreme than those recorded during the FTX collapse in 2022.

QWhat was Solana's price performance after its $8 bottom in 2022, and what does it suggest about potential recoveries?

AAfter dropping to a low near $8 in 2022, Solana eventually rallied to over $270 in 2025, representing a massive 3,000% recovery. While not a guarantee for the current cycle, historically, assets hitting a price floor with low RSI readings have tended to produce significant rallies.

QWhat is the significance of Solana posting eight consecutive red monthly candles according to the analysis?

AAsh Crypto notes that Solana has posted eight consecutive red monthly candles for the first time in its history. This highlights the depth and persistence of the current bearish trend for the cryptocurrency.

QIf Solana has indeed hit a price bottom, what market dynamic does the article suggest this creates?

AIf Solana has hit a price bottom, it would imply that most traders who wanted to sell have likely exited the market, leaving primarily long-term holders. This capitulation often sets the stage for a recovery, as there is very little selling pressure left to disrupt the market.

QAccording to the article, what does the lack of a definitive signal on SOL's chart mean for its current price status?

AThe article states that there is currently no signal on SOL's chart that definitively confirms a bottom or an imminent price reversal. This is because Solana remains firmly in bearish territory, which means its RSI can stay oversold longer than expected, and the price could potentially fall further below its current level near $60.

Related Reads

Dialogue with a Macro Analyst: AI Drains All Liquidity from U.S. Stocks, $40K Bitcoin is the True Bottom

In a recent discussion, macro strategist Luke Groman, founder of FFT LC, presented a sobering analysis of current markets. He argues that while the S&P 500 hits new highs, this is largely driven by just seven AI stocks, which are "sucking all the oxygen and liquidity out of the room." Bitcoin, which he calls the "last working smoke alarm for liquidity," is signaling trouble, having entered a difficult period. Groman explains that the AI boom is fueled by accounting practices that front-load revenue, creating an illusion of high profits while cash is being depleted. He warns this cycle could reverse sharply when construction slows. His base case is that stocks will rise in dollar terms but fall significantly when measured in gold or Bitcoin, highlighting that long-term US Treasury futures have already lost 90% of their value against gold over the past decade. He points to major structural risks, including China's dominance in rare earths—a small commodity market underpinning trillions in tech stock value—and the prolonged closure of the Strait of Hormuz, which he calls a "Suez Moment" for the US. This, combined with a shift towards a "no ticky, no washy" proof-of-work system for settling trade (using gold, not trust), signals deeper systemic distrust. Regarding US debt, Groman notes that historically, all 58 countries that reached a 130% debt-to-GDP ratio defaulted, primarily through inflation. The US crossed this threshold in 2020. He also highlights a contradiction in the AI narrative: if it's as transformative as claimed, it must destroy white-collar jobs, threatening half of US tax revenue—a reality at odds with the "no job loss" messaging from tech leaders. On Bitcoin, Groman sold most of his position near the top and hasn't fully re-entered. Citing technical analysis from Northstar Bad Charts, he suggests a potential bottom around $40,000 could materialize in Q3 or Q4. He concludes that while he may be labeled a doomsayer, his view is simply realistic, grounded in historical precedents and current macro pressures.

marsbit8h ago

Dialogue with a Macro Analyst: AI Drains All Liquidity from U.S. Stocks, $40K Bitcoin is the True Bottom

marsbit8h ago

Trading

Spot
Futures

Hot Articles

Discussions

Welcome to the HTX Community. Here, you can stay informed about the latest platform developments and gain access to professional market insights. Users' opinions on the price of SOL (SOL) are presented below.

活动图片