SOL price action lags the wider altcoin market: Is Solana’s heyday over?

cointelegraphPublished on 2025-12-18Last updated on 2025-12-18

Abstract

SOL has underperformed the broader altcoin market, declining 32% since November compared to a 21% drop in the altcoin market. Despite significant ETF inflows totaling $636 million and corporate adoption adding over 20 million SOL to balance sheets, the token's price has struggled. A key factor is declining onchain activity: Solana’s weekly network fees fell to $4.5 million from $7 million, and DApp revenues dropped 30% to $26 million weekly. Meanwhile, competing blockchains like Base, Arbitrum, and Polygon saw substantial growth in transactions and activity. With 68% of SOL staked, reducing sell pressure, the primary concern remains weak network demand. Without a reversal in onchain activity, SOL’s underperformance is likely to persist.

Key takeaways:

  • SOL lagged the altcoin market as falling fees and DApp revenues signaled weaker Solana network demand.

  • Growth shifted to Base, Arbitrum, Polygon and BNB Chain, reducing the odds of a near-term SOL rebound.

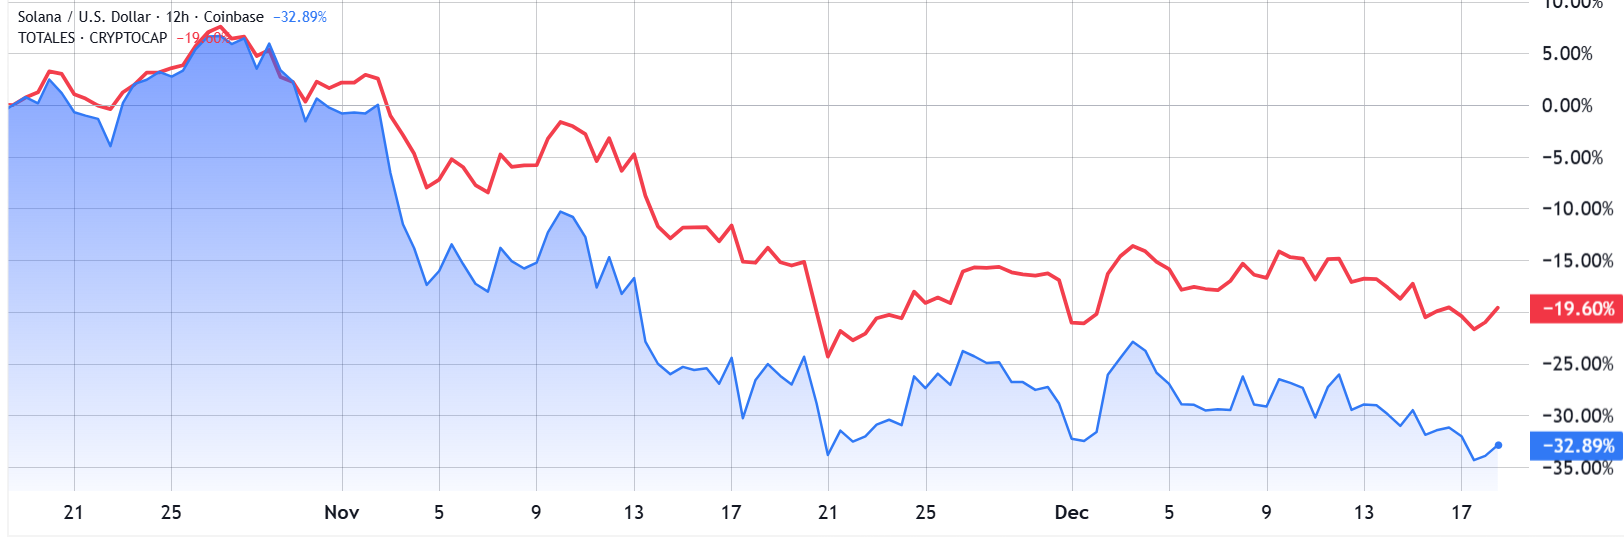
Solana’s native token, SOL (SOL), has fallen 32% since November, underperforming the broader altcoin market, which declined 21%. This gap has become a concern for bulls, especially given inflows into SOL exchange-traded funds and a growing number of companies adding the asset to their balance sheets as a reserve strategy.

Traders are now questioning what would need to change for SOL price to reestablish a sustained bullish trend.

SOL/USD (blue) vs. Total crypto capitalization (red). Source: TradingView

The Solana ETF industry in the US has accumulated $636 million in assets since the launch of the REX-Osprey SOL+Staking ETF in July. At the same time, companies such as Forward Industries (FORD US), Solana Company (HSDT US) and Sharps Technology (STSS US) have collectively added 20.35 million SOL to their balance sheets, valued at more than $2.5 billion.

Native staking on Solana has also helped limit the amount of SOL immediately available for sale. Nearly 68% of the circulating supply is currently delegated to the network’s proof-of-stake system, a share that has increased steadily over the past few months. Staking yields on Solana can exceed 6%, as SOL remains inflationary to offset the costs of operating validators.

Native staked SOL on Solana network. Source: StakingRewards

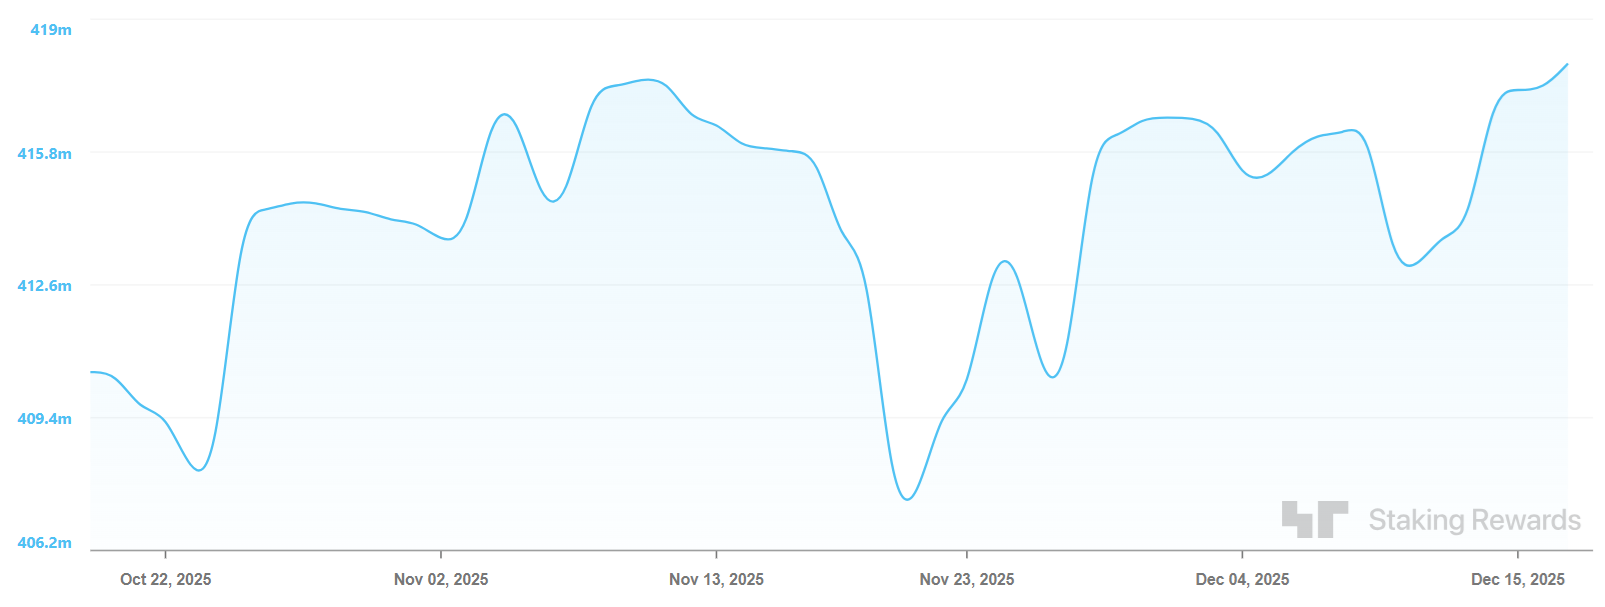
Total staked SOL rose to 418 million from 410 million two months earlier, extending a trend that has been in place since March. As a result, SOL’s drop back toward the $120 level appears more closely tied to softer expectations for Solana network demand. Broader crypto adoption trends may have shifted toward competing platforms or alternative solutions that do not require direct blockchain settlement.

Solana network weekly chain fees vs. DApps revenue, USD. Source: DefiLlama

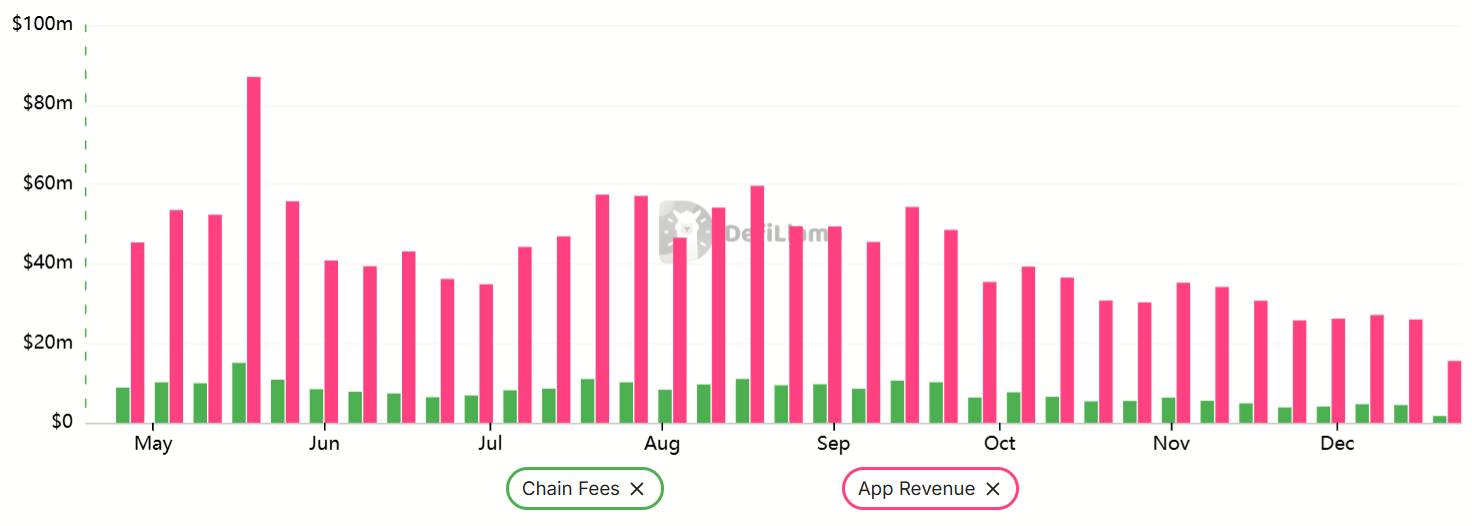
Solana onchain activity has been in steady decline since August, with weekly network fees falling to $4.5 million from $7 million just two months earlier. Decentralized applications (DApps) on Solana also experienced a 30% decline in revenue over the same period, dropping to $26 million per week. While Solana’s utility weakened, activity on other networks accelerated.

Solana onchain activity outpaced by Ethereum’s L2 ecosystem

Top blockchains ranked by 30-day fees. Source: Nansen

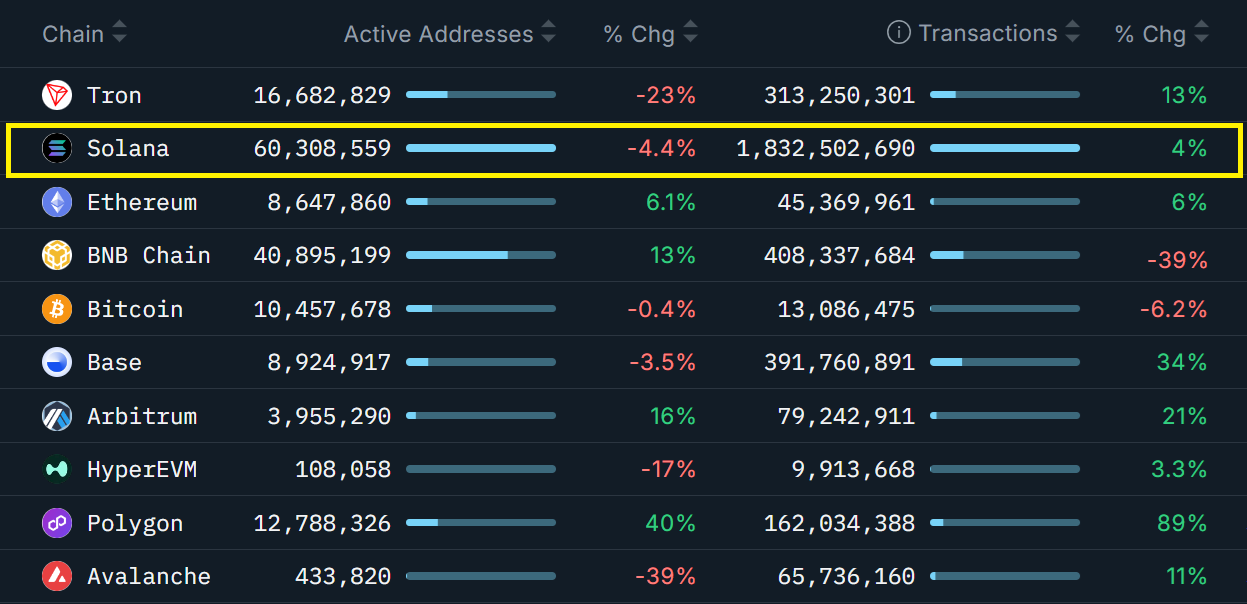
Monthly transaction counts increased by just 4% on Solana and 6% on Ethereum. In contrast, activity surged 34% on Base, 21% on Arbitrum and 89% on Polygon. Even Tron, a direct competitor of Solana, recorded a 13% rise in 30-day transactions. The Ethereum layer-2 ecosystem continued to expand, offering low fees and collectively exceeding Solana’s $8.5 billion in total value locked (TVL).

Related: DAT longevity hinges on avoiding ‘mNAV roller coaster’-Solmate CEO

SOL investors also grew more cautious following the relative success of BNB Chain DApps such as Aster decentralized exchange and Four-meme, a memecoin launch platform. Support from the world’s largest cryptocurrency exchange gives these projects easier access to developers, marketing channels and a large user base. Binance’s recent move into prediction markets may further weaken the bullish case for SOL.

SOL is unlikely to close its performance gap versus the broader altcoin market without a clear reversal in Solana onchain activity. Whether competition comes from other blockchain networks or from traditional fintech players, such as Nasdaq’s plans for 23-hour trading, the prospects for sustained bullish momentum in SOL remain limited.

This article is for general information purposes and is not intended to be and should not be taken as, legal, tax, investment, financial, or other advice. The views, thoughts, and opinions expressed here are the author’s alone and do not necessarily reflect or represent the views and opinions of Cointelegraph. While we strive to provide accurate and timely information, Cointelegraph does not guarantee the accuracy, completeness, or reliability of any information in this article. This article may contain forward-looking statements that are subject to risks and uncertainties. Cointelegraph will not be liable for any loss or damage arising from your reliance on this information.


Related Questions

QWhat is the main reason for SOL's underperformance compared to the broader altcoin market?

ASOL's underperformance is attributed to falling network fees and declining DApp revenues, signaling weaker demand on the Solana network, while growth shifted to competing platforms like Base, Arbitrum, Polygon, and BNB Chain.

QHow much has the Solana ETF industry accumulated in assets since its launch?

AThe Solana ETF industry in the US has accumulated $636 million in assets since the launch of the REX-Osprey SOL+Staking ETF in July.

QWhat percentage of SOL's circulating supply is currently staked, and how does this impact selling pressure?

ANearly 68% of SOL's circulating supply is currently staked, which helps limit the amount of SOL immediately available for sale and reduces selling pressure.

QHow did Solana's on-chain activity change between August and the time of writing?

ASolana's weekly network fees fell to $4.5 million from $7 million, and DApp revenues declined by 30% to $26 million per week, indicating a steady decline in on-chain activity.

QWhich blockchain networks showed significant growth in transaction counts, contrasting with Solana's modest performance?

ABase surged 34%, Arbitrum grew 21%, and Polygon increased 89% in transaction counts, while Solana only saw a 4% increase, highlighting stronger growth on competing networks.

Related Reads

SemiAnalysis Dissects Huawei's Kirin 9030: Process Technology Halted, So They Folded the Chip

SemiAnalysis has published a detailed teardown report on the HiSilicon Kirin 9030 Pro chipset found in Huawei's Mate 80 Pro. Fabricated using SMIC's most advanced N+3 node without EUV lithography, the analysis reveals significant technical achievements and strategic shifts. The report indicates SMIC's N+3 has achieved transistor density comparable to TSMC's N6 (113.4 vs 107.7 MTr/mm²), primarily through aggressive use of Self-Aligned Quadruple Patterning (SAQP) for its metal layers. This results in a notably small 32.5nm M0 metal pitch. However, SemiAnalysis notes this achievement comes with significantly higher process complexity, cost, and potential yield challenges compared to competitors using more advanced tools. The Kirin 9030 design maximizes this constrained density. While its GPU performance has improved ~70% and matches Qualcomm's 2022 flagship level, the CPU core's IPC lags behind current top-tier designs from Apple and Qualcomm, a gap attributed to the underlying manufacturing technology rather than design capability. Facing long-term restrictions on advanced tools, Huawei is charting a new path. The report highlights the company's "LogicFolding" roadmap, a 3D stacking technique aimed at shortening signal paths to boost performance and efficiency. The goal is to reach 5GHz frequency and a projected density of 295 MTr/mm² by 2031. SemiAnalysis concludes that export controls have not halted China's chip progress but have fundamentally altered its trajectory, making it more expensive and complex. This has spurred innovation in alternative areas like 3D stacking and domestic EDA tool development, with Huawei's supply chain also beginning to integrate Chinese memory from CXMT.

marsbit36m ago

SemiAnalysis Dissects Huawei's Kirin 9030: Process Technology Halted, So They Folded the Chip

marsbit36m ago

How Will the Price Move Before SpaceX's Next Share Unlock?

TL;DR Investors buying SPCX after SpaceX's IPO are not simply investing in a typical tech stock. It’s a high-valuation asset driven by Musk's narrative, Starlink, and space transport potential, but with a key twist: a very small initial float of ~4% has led to significant post-listing price appreciation. The current price action reflects a timing gap. Before the first lock-up expiration (estimated around August, subject to official confirmation), scarcity and high demand could continue to push prices up. Short-term bulls focus on low float, FOMO, and potential index inclusion. However, bears point to the supply dynamics that will change post-lockup. Existing shareholders still hold over 95% of shares, which will be released in stages starting from the first unlock window. This introduces future selling pressure from low-cost holders. The upcoming Q2 earnings report is a critical catalyst before the unlock. It will test whether the company's fundamentals can justify the current ~$2.1T valuation. Strong results could support the pre-unlock momentum, while weak figures could amplify concerns about future supply. The trading thesis is shifting from immediate scarcity ("can't buy enough") to evaluating future absorption capacity ("who will buy when more supply hits"). The path ahead hinges on the specifics of the unlock schedule, Q2 earnings performance, and whether anticipated passive index buying materializes.

marsbit57m ago

How Will the Price Move Before SpaceX's Next Share Unlock?

marsbit57m ago

Bitcoin Short-Term Bullish Structure Validated, HYPE Low-Entry Window Opens | Guest Analysis

**Market Analysis Summary (Week of June 2026)** **Overall Market Context:** The market environment is exceptionally complex, with the unexpected US-Iran agreement and the reopening of the Strait of Hormuz triggering a global asset repricing and significant volatility. This heightened noise underscores the importance of a structured analytical framework. **Bitcoin (BTC) Analysis & Strategy:** * **Current Status:** The price has climbed above $65,000, currently in a rebound phase (segment 38-39) following a complex 12-segment correction from the May high of $82,850. * **Key Levels:** * **Primary Resistance:** $69,500–$70,500. A successful breakout above $65,000 targets this zone. * **Primary Support:** $65,000 (immediate), followed by $59,000–$60,000 and $55,000. * **Weekly Outlook & Strategy:** The focus is on the confirmation of the $65,000 level. * **Bullish Scenario (Hold $65K):** A move toward the $69.5K–$70.5K resistance zone is anticipated, which is a potential area for initiating medium-term short positions. * **Bearish Scenario (Break below $65K):** A retest of the $60,000–$62,000 support range is likely. * **Medium-Term Strategy:** Currently neutral. Plan to establish short positions (up to 60% allocation) either in the $69.5K–$70.5K resistance zone upon signs of rejection, or on a confirmed breakdown below $65,000 and further below $59K–$60K. * **Short-Term Strategy:** Utilize 30% capital for scalping opportunities based on support/resistance levels, using 30/60-minute charts. **HYPE Analysis & Strategy:** * **Current Status:** The price has stabilized around $52 after a four-segment decline from the June high of $75.87 and is now in a rebound (segment 50-51). * **Key Levels:** * **Primary Resistance:** $62.50–$64.57. Watch for potential rejection here to form a lower high. * **Primary Support:** $52–$55.50, followed by $47–$49. * **Weekly Outlook & Strategy:** Adopt a "buy on dips, avoid chasing rallies" approach. * **Core View:** Monitor the price action and potential formation of a lower high ("endpoint 51") in the $62.50–$64.57 resistance zone. * **Short-Term Strategy:** Consider light long positions (max 30% allocation) if the price finds support and shows reversal signals in the $52–$54.50 or deeper $47–$49 support zones, confirmed by proprietary quantitative bottom signals. **Trade Review:** Last week's HYPE short-term long trade, executed based on proprietary "Price Difference" and "Momentum" model signals, yielded a profit of approximately 11.88%. The entry was near $54.39 and exit near $60.85. **Risk Management Reminder:** Always set an initial stop-loss upon entry. Move stop-loss to breakeven at +1% profit, then trail it upwards to lock in gains as the trade progresses. *Disclaimer: All analysis, models, and strategies are based on personal technical analysis for educational purposes only, not investment advice. The market carries inherent risk.*

Odaily星球日报1h ago

Bitcoin Short-Term Bullish Structure Validated, HYPE Low-Entry Window Opens | Guest Analysis

Odaily星球日报1h ago

Bitcoin Short-Term Bullish Structure Validated, HYPE Accumulation Window Opens | Guest Analysis

**Bitcoin and HYPE Market Analysis: Short-Term Outlook and Trading Strategies** This market analysis examines Bitcoin (BTC) and HYPE amid volatile conditions, providing short-term outlooks and specific trading strategies. **Key Outlooks:** * **Bitcoin (BTC):** Focus is on whether BTC's recent move above $65,000 holds. A successful breakout could lead to a test of the $69,500-$70,500 resistance zone, where medium-term short positions are considered. A failure, breaking below $65,000, may trigger a decline towards the $59,000-$60,000 support area. * **HYPE:** The token completed a four-wave correction and is now rebounding. The key resistance zone is $62.5-$64.57. The trading strategy is "buy on dips," looking for entry opportunities near the $52-$54.5 or deeper $47-$49 support zones, pending confirmation from proprietary models. **BTC Trading Strategy:** * **Medium-term:** Primarily looking to establish short positions (up to 60% allocated capital) if price rallies to the $69,500-$70,500 resistance area and shows signs of reversal. Alternative plans involve initiating shorts on a breakdown below $65,000. * **Short-term:** Allocate up to 30% capital for intraday "spread" trades based on support/resistance levels on 30/60-minute charts. **HYPE Trading Strategy:** * **Short-term:** Adopt a dip-buying approach. Consider light long positions (under 30% capital) when price tests key support levels ($52-$54.5 or $47-$49) and shows stabilization, confirmed by proprietary "Price Spread" and "Momentum Quant" models. **Trade Recap:** The analysis reviews a successful HYPE long trade from the previous week, executed at ~$54.39 and closed at ~$60.85 for an ~11.88% gain, based on signals from the aforementioned models. **Risk Management Emphasis:** The article stresses strict capital allocation (under 30-60%), immediate initial stop-loss placement, and a trailing stop-loss protocol to lock in profits as trades move favorably. ***Disclaimer:** All analysis, models, and strategies are for educational purposes based on technical analysis, not investment advice. Markets are volatile; trade with caution.*

marsbit1h ago

Bitcoin Short-Term Bullish Structure Validated, HYPE Accumulation Window Opens | Guest Analysis

marsbit1h ago

Trading

Spot
Futures

Hot Articles

Discussions

Welcome to the HTX Community. Here, you can stay informed about the latest platform developments and gain access to professional market insights. Users' opinions on the price of S (S) are presented below.

活动图片