Is Bitcoin’s price at risk of $58K after U.S 10-year yields near 5%, oil-driven inflation

ambcryptoPublished on 2026-03-29Last updated on 2026-03-29

Abstract

Bitcoin's recent rally to $76,000 has reversed amid shifting macroeconomic conditions. The U.S. 10-year Treasury yield is consolidating near a bullish flag pattern, with a potential breakout toward 5%—a level last seen in 2023. Higher yields could trigger capital outflows from risk assets like Bitcoin, potentially driving its price down to the $58,632–$55,302 demand zone. U.S. spot Bitcoin ETFs recorded outflows of $296 million over the past week, reversing previous inflows, indicating a risk-off sentiment among institutional investors. Surging oil prices, with Brent crude near $106, are stoking inflation concerns and reducing the likelihood of near-term monetary easing. These factors suggest Bitcoin remains sensitive to broader macro liquidity conditions rather than acting as a reliable inflation hedge in the short term.

Bitcoin entered March on the back of strong momentum, rallying to a high of $76,000 and positioning for its first bullish monthly close in half a year. However, that narrative has since unraveled.

Early optimism, fueled by geopolitical developments involving the U.S, Iran, and Gulf states, has given way to macro-driven caution. At the time of writing, Bitcoin [BTC] was trading near $66,126, holding key levels but showing signs of vulnerability as sentiment shifts.

Bond yields climb, tightening the screws

The U.S 10-year Treasury yield has emerged as a central driver of market direction. In fact, the press time price action seemed to suggest that the yield may be consolidating within a bullish flag pattern, typically a precursor to further upside.

A confirmed breakout could push yields towards the 5.0% level or higher, revisiting highs last seen in 2023. Such a move would likely accelerate capital rotation out of risk assets.

Higher yields tend to strengthen the appeal of fixed-income instruments, drawing liquidity away from speculative markets. For Bitcoin, this dynamic has historically translated into downside pressure.

Source: TradingView

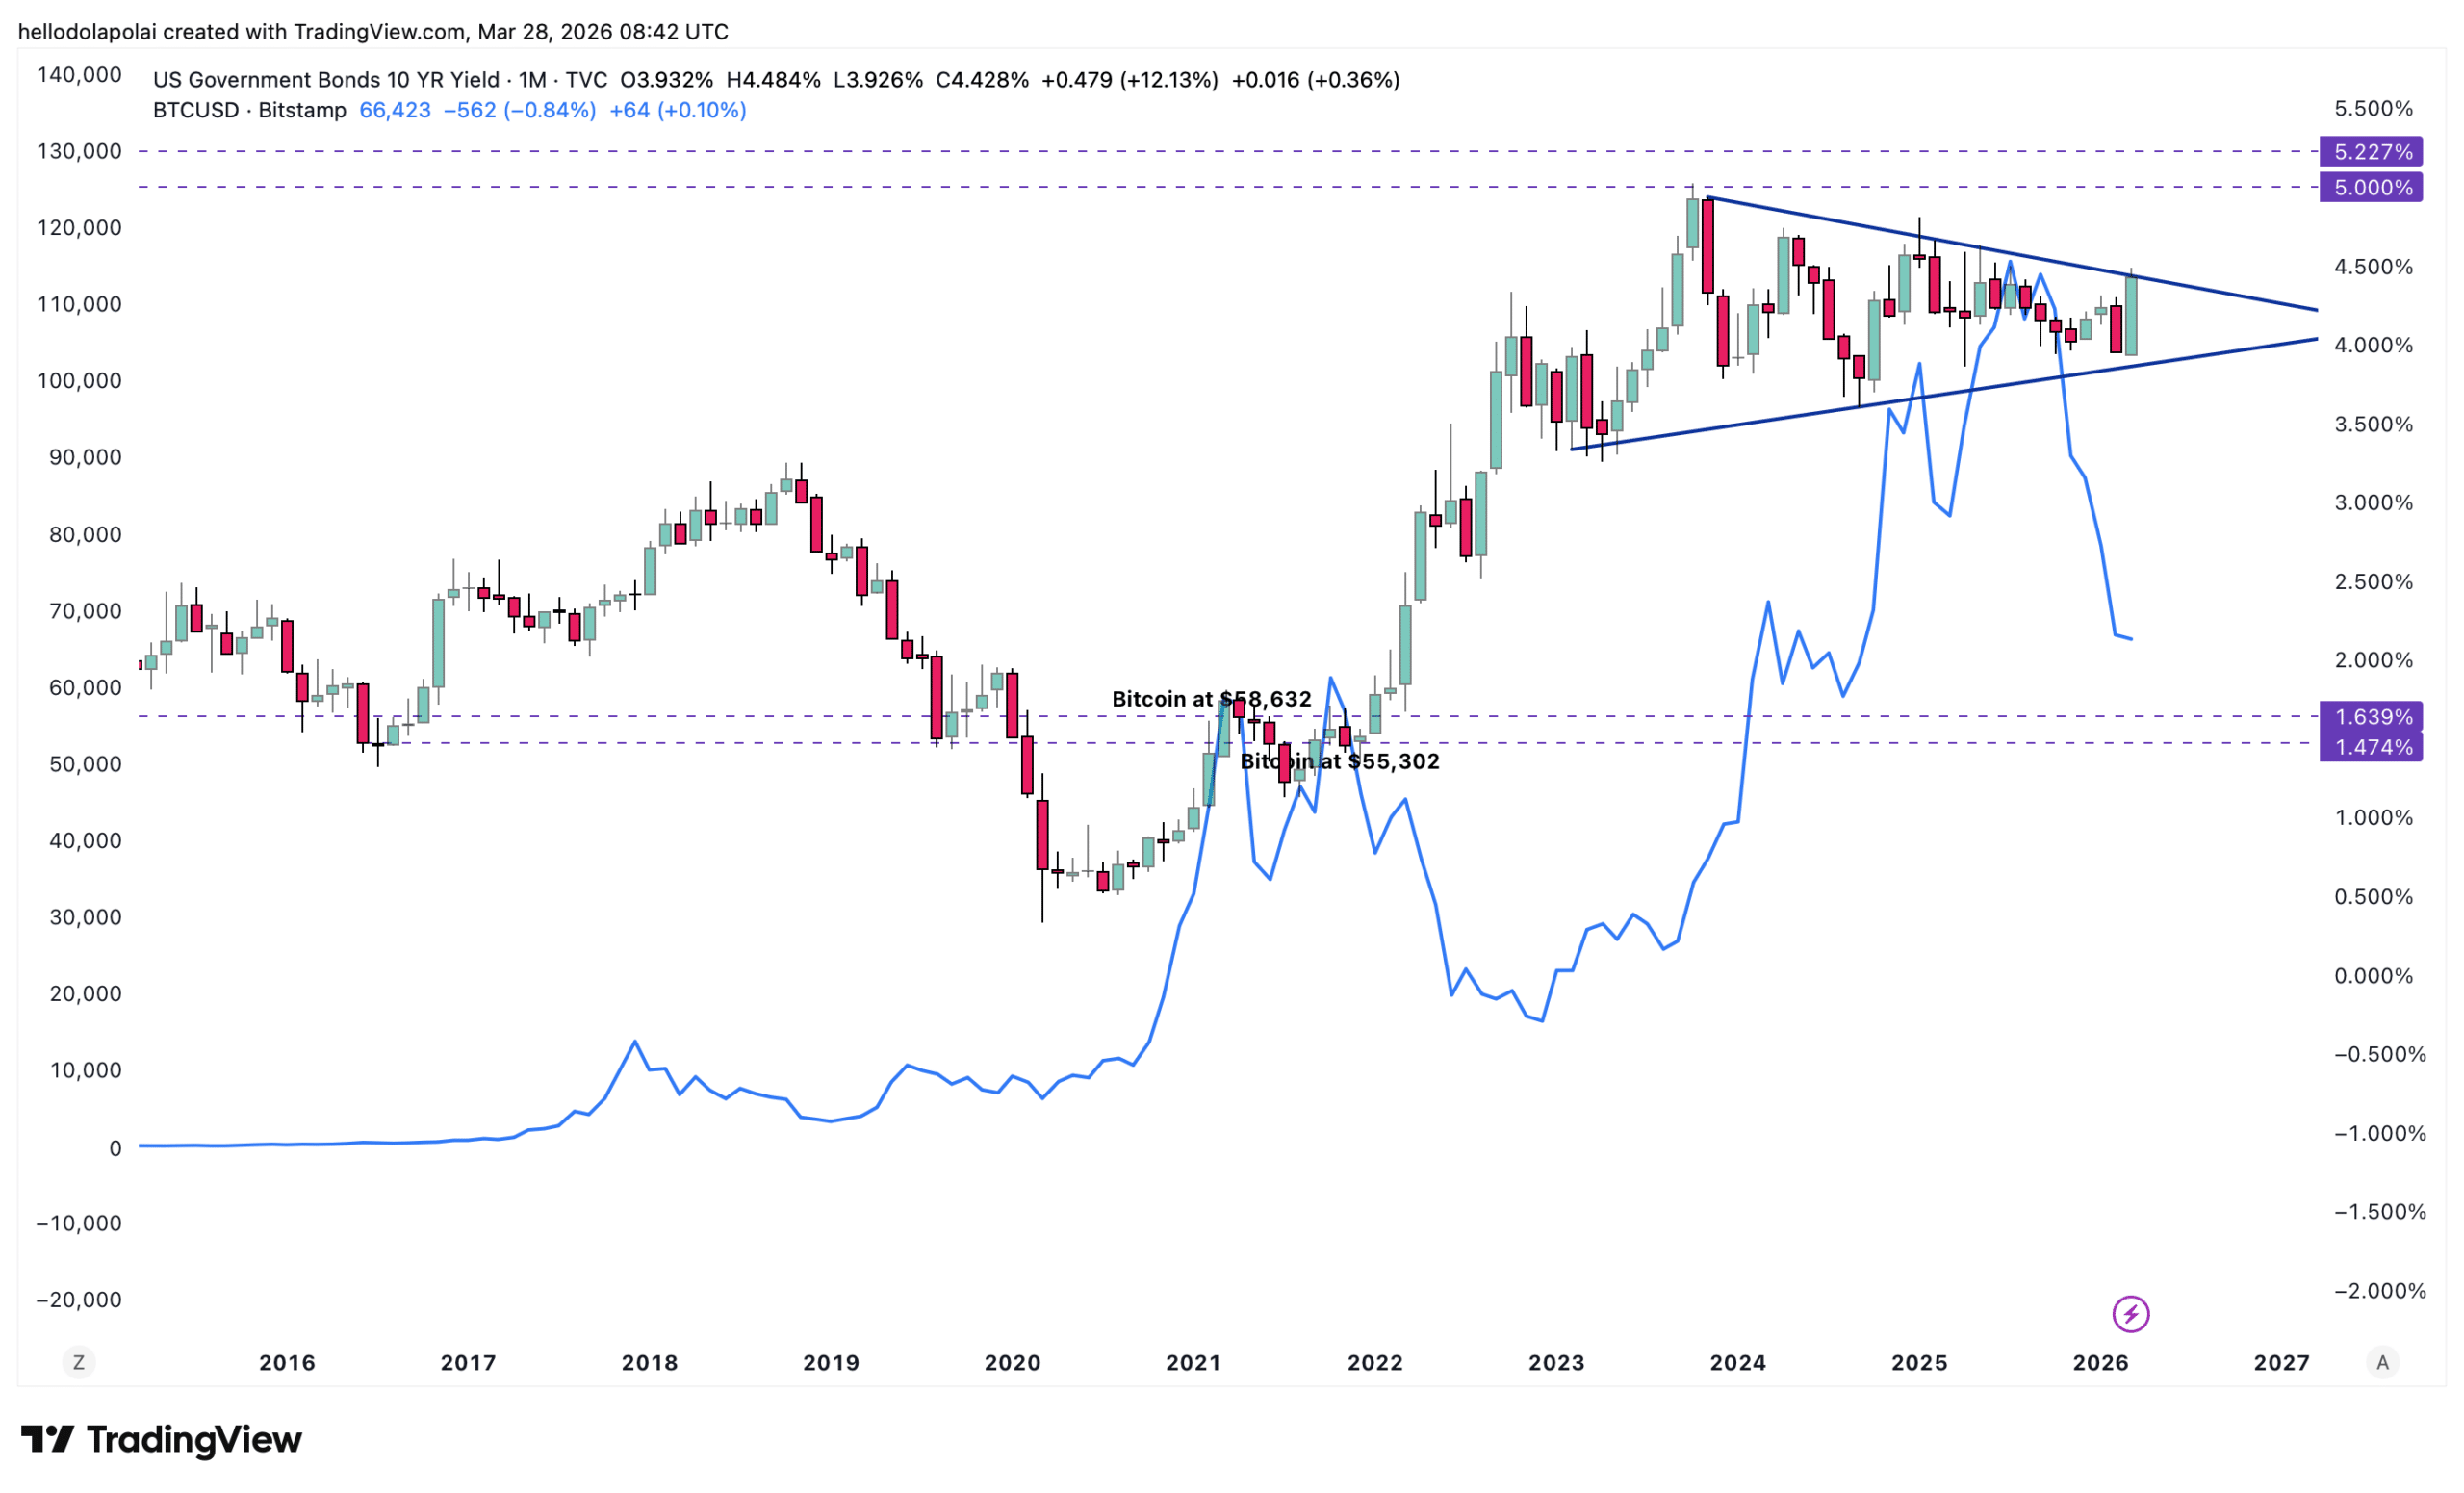
Between October 2021 and December 2022, for instance, yields rose from 1.45% to 3.90%. All while Bitcoin fell from $67,000 to $16,256 over the same period.

If yields extend towards 5%, Bitcoin could retrace towards its next demand zone between $58,632 and $55,302.

ETF flows flip as U.S investors de-risk

Institutional sentiment in the U.S is beginning to turn too. In fact, Spot Bitcoin exchange-traded funds have recorded their first meaningful outflows in five weeks – Signaling a shift towards a risk-off posture.

Roughly $296 million exited these funds over the past week, reversing part of the $2.12 billion accumulated over the previous four weeks. The shift suggested that recent buyers may be beginning to unwind positions as macro risks intensify.

Source: Sosovalue

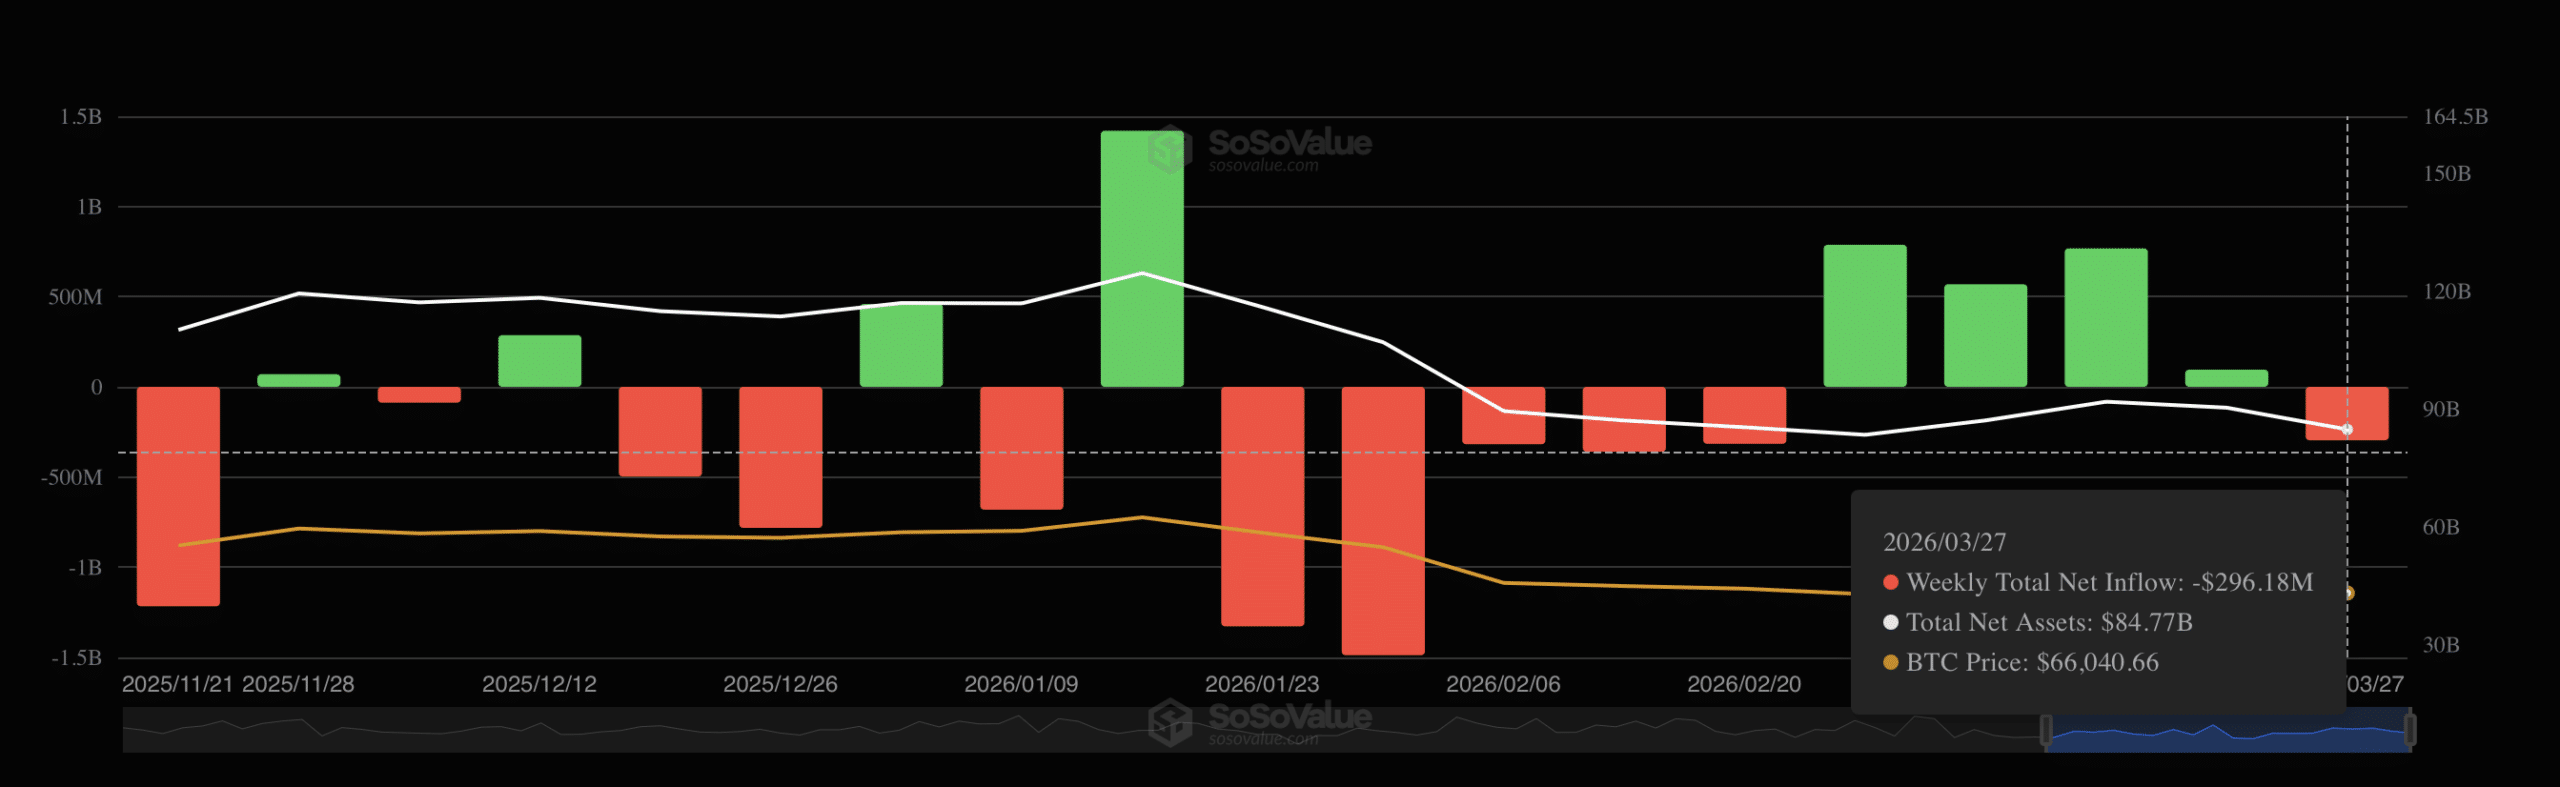
Late-February data reflected this trend best. Between 26-27 February alone, outflows reached approximately $396.7 million, highlighting how quickly sentiment can reverse.

With only a few trading sessions left in March, sustained selling could now cement the bearish monthly close.

Oil surge fuels inflation concerns

Here, the inflation backdrop remains a key variable. Crude oil prices have surged sharply, adding pressure to an already fragile macro environment.

Brent crude has already climbed from around $75 at the start of the month to approximately $106, while WTI crude was trading near $101 at press time. The move alluded to supply disruptions and geopolitical tensions, both of which risk sustaining inflation at elevated levels.

Persistently high energy prices limit the likelihood of near-term monetary easing, keeping yields elevated and financial conditions tight.

In fact, recent analysis pointed to oil-driven inflation as a direct headwind for Bitcoin, particularly amid disruptions tied to the Strait of Hormuz. While market analysts argue that Bitcoin could act as a hedge, current price action suggests it remains closely tied to broader liquidity conditions.


Final Summary

  • The U.S 10-year Treasury yield is approaching a breakout, raising the risk of a broader market repricing.
  • U.S investors have begun offloading Bitcoin, as oil-driven inflation continues to complicate the macro outlook.

Related Questions

QWhat is the potential downside target for Bitcoin's price if U.S. 10-year Treasury yields break out towards 5%?

AIf yields extend towards 5%, Bitcoin could retrace towards its next demand zone between $58,632 and $55,302.

QWhat recent shift in institutional sentiment is indicated by Spot Bitcoin ETF flows?

ASpot Bitcoin exchange-traded funds have recorded their first meaningful outflows in five weeks, with roughly $296 million exiting these funds over the past week, signaling a shift towards a risk-off posture.

QHow did the relationship between rising bond yields and Bitcoin's price play out between October 2021 and December 2022?

ABetween October 2021 and December 2022, U.S. 10-year yields rose from 1.45% to 3.90%, while Bitcoin's price fell from $67,000 to $16,256 over the same period.

QWhat two key factors are driving the recent surge in crude oil prices, according to the article?

AThe surge in crude oil prices is alluded to supply disruptions and geopolitical tensions, both of which risk sustaining inflation at elevated levels.

QWhy do persistently high energy prices pose a challenge for Bitcoin's price performance?

APersistently high energy prices limit the likelihood of near-term monetary easing from the Federal Reserve, which keeps bond yields elevated and financial conditions tight, historically creating downside pressure for Bitcoin.

Related Reads

Will the Next Crypto Bull Run Start with On-Chain Trading of SpaceX?

This article presents a scenario-based forecast for the crypto industry from 2026 to 2029, arguing that the next major cycle will be driven not by technological narratives but by legal access to real-world assets. The author predicts that by mid-2026, pre-IPO perpetual contracts for top private companies like SpaceX, OpenAI, and Anthropic on platforms like Hyperliquid will become the primary gateway for accessing quality assets, as most crypto-native tokens fail to capture real value. The much-hyped AI x Crypto intersection largely fails except for prediction markets, which thrive on betting on AI model supremacy. By 2027, public blockchain foundations are forced to choose between catering to retail speculation or building compliant infrastructure for institutions, with many opting for the latter. Growth in stablecoins and tokenized private credit/equity hits a "triple ceiling" due to regulatory and political uncertainty rather than market demand. The pivotal shift is forecast for 2028. A major liquidation event in pre-IPO perpetuals exposes the structural flaw of synthetic markets lacking a real underlying asset anchor. In response, regulatory changes finally allow the public solicitation of private securities resales to verified accredited investors. This creates a legitimate secondary market for real company equity, which then becomes the core asset class of the new bull market, relegating synthetic perps to a niche role. By 2029, the industry becomes "boring" but foundational. Tokens without claims on real cash flows or assets cease trading. Stablecoin growth is steady but politically capped. Crypto infrastructure fades from view as it gets absorbed into traditional finance backends. The article's central thesis is that the key bottleneck for crypto's next phase is legal and regulatory channels for real asset ownership, not technology.

marsbit1h ago

Will the Next Crypto Bull Run Start with On-Chain Trading of SpaceX?

marsbit1h ago

The Value Distribution of Stablecoins

**Summary: The Value Distribution of Stablecoins** The article argues that stablecoins are evolving from mere trading tools into broader channels for dollar access. It divides the stablecoin ecosystem into four layers to analyze how value is distributed: 1. **Issuance Layer:** Mints stablecoins, holds reserve assets, and captures the spread between reserve yield and user costs (e.g., Tether, Circle). This layer currently earns the largest profit margin. 2. **Infrastructure Layer:** Connects stablecoins to the traditional financial system, handling fiat on/off-ramps, banking integration, compliance (KYC/AML), and asset management (e.g., Bridge, BVNK). This is the "unglamorous" but critical work, building the essential bridges between crypto and real-world finance. 3. **Acquiring/Distribution Layer:** Integrates stablecoins into merchant systems, manages payment flows, and provides enterprise financial software (e.g., Stripe, Coinbase). They act as the access point for businesses. 4. **Application Layer:** The end-users and businesses that ultimately use stablecoins for payments, settlements, or as a store of value. They benefit from convenience but have little pricing power. The core thesis is that while the issuance layer currently dominates profits, the often-overlooked **infrastructure layer holds significant long-term potential**. The real challenge and barrier to mass adoption is not the on-chain transfer of stablecoins (which is simple), but the complex "last mile" integration into existing business workflows, banking systems, and regulatory frameworks across different countries. Companies in this layer are currently in a "land grab" phase, investing heavily to build networks, secure bank partnerships, and establish compliance pathways. While their position is currently pressured by the profitable issuers above and distribution platforms below, the article suggests that if stablecoins become a default financial rail for businesses, the infrastructure providers who have done the hard work of integration will ultimately gain strong pricing power and become entrenched, essential players.

marsbit8h ago

The Value Distribution of Stablecoins

marsbit8h ago

The Value Distribution of Stablecoins

The Value Distribution of Stablecoins The article argues that stablecoins are evolving from a mere trading tool into a broad "dollar channel." It analyzes the industry's value chain through four layers: 1. **Issuance Layer (e.g., Tether, Circle):** The top layer that mints stablecoins, holds reserve assets, and captures the thickest interest rate spread. 2. **Infrastructure Layer (e.g., Bridge, BVNK):** Connects stablecoins to the traditional financial system, handling critical but complex "dirty work" like fiat on/off-ramps, banking integration, compliance (KYC/AML), and cross-border settlement. 3. **Acquiring/Distribution Layer (e.g., Stripe, Coinbase):** Embeds stablecoins into merchant systems, manages payment flows, and integrates with enterprise software. 4. **Application Layer:** End-users and businesses that ultimately use stablecoins for payments, settlement, or storing value. The author posits that while the issuance layer currently captures the most profit, the most overlooked and potentially critical layer is infrastructure. The core challenge for stablecoin adoption isn't the on-chain transfer (which is simple), but bridging the gap between blockchain and the real-world financial system. This involves solving practical problems for businesses: fiat conversion, reconciliation, tax handling, and user onboarding. Infrastructure companies are currently in a difficult "land-grab" phase—building networks, securing banking relationships, and achieving compliance country-by-country. They face pressure from both the profitable issuance layer above and distribution platforms below. However, the author suggests this layer is building a crucial moat. Once stablecoins become a default business rail, the infrastructure players who have done the hard work of integration may gain significant, durable value and pricing power.

链捕手8h ago

The Value Distribution of Stablecoins

链捕手8h ago

Trading

Spot
Futures

Hot Articles

Discussions

Welcome to the HTX Community. Here, you can stay informed about the latest platform developments and gain access to professional market insights. Users' opinions on the price of S (S) are presented below.

活动图片