Is AAOI's P/S Ratio of 18.5 Expensive? Model Says 'Undervalued by 13%', Short Sellers Say '67% Bubble' — Who's Lying?

Published on 2026-08-17Last updated on 2026-08-17

Abstract

The crucial question facing investors is whether the demand for its high-speed optical products and its planned capacity expansion can support the current revenue expectations. If this assumption proves untenable, the current valuation might resemble a value trap rather than a sound investment opportunity.

Applied Optoelectronics' stock has delivered many years of very strong upward momentum, but its low overall Value Score suggests the current share price may already reflect much of the market's optimism.

Over the past 5 years, Applied Optoelectronics' returns have been approximately 19 times the initial investment, which further focuses attention on how much upside the company may have left.

Recently, surging demand for the company's high-speed optical products (used to support AI and cloud data centers) may have raised investor expectations. However, any slowdown in demand or hiccups in planned capacity expansion could quickly affect what investors are willing to pay.

Applied Optoelectronics passes only 1 out of 6 valuation checks, so even considering its growth prospects, the company appears overvalued rather than undervalued on the whole.

The question now is whether Applied Optoelectronics' current valuation offers enough runway for reasonable returns after such a strong run-up.

Applied Optoelectronics returned 519.1% last year. Here's a look at how it stacks up across the Communications industry.

Is Applied Optoelectronics a Bargain Now?

For Applied Optoelectronics, the Price-to-Sales (P/S) ratio is a useful metric because the company is focused on revenue growth rather than established profitability.

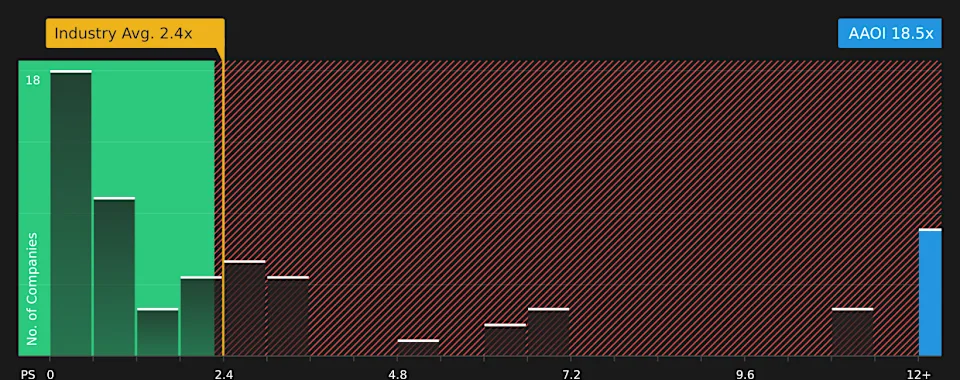
Applied Optoelectronics' P/S ratio is around 18.5x, significantly higher than the Communications industry average (~2.4x) and higher than the peer average (~7.0x). On a simple comparison, investors are paying much more per $1 of sales for this company than for many other communications stocks.

However, a more justified P/S ratio, considering the company's growth prospects, margins, size, and risk, is around 29.3x, which is still far above the current P/S. Despite the strong recent rally driven by AI-related policy news and revenue updates, the model indicates the current price does not fully reflect market expectations for Applied Optoelectronics based on revenue.

On a P/S basis, Applied Optoelectronics stock appears undervalued relative to where it should typically trade given its growth and risk profile.
The Applied Optoelectronics Narrative: What Must Hold True to Justify Today's Price?

The Simply Wall St Narratives series picks up Applied Optoelectronics' valuation puzzle, outlining what assumptions in growth, margins, and earnings must hold for the stock to be worth significantly more or less than its current price. Each article treats Applied Optoelectronics' implied fair value as a theory about the company's business that can be reassessed over time, not a one-time snapshot.

Currently, there is a stark divergence in views on Applied Optoelectronics, with a vast chasm between bullish and bearish theses on the stock.

Bull Thesis: Undervalued by 13%

"Growing demand from AI/machine learning workloads, video streaming, the Internet of Things, and the ongoing transition from copper to fiber in network infrastructure creates persistent tailwinds for the industry..."

Bear Thesis: Overvalued by 67%

"The case for going short is equally clear: the stock already reflects most of its upside potential..."

Summary

Applied Optoelectronics appears undervalued based on a customized Price-to-Sales (P/S) metric, but its low overall Value Score suggests most other metrics are not giving a clear endorsement. Recent high volatility in the share price implies market expectations are already elevated, warranting extra caution on relying on the P/S metric alone. The key question for investors is whether demand for its high-speed optical products and planned capacity expansion can support the current revenue expectations. If this assumption fails to hold, the current valuation might look more like a value trap than an investment opportunity.

Related Reads

Wall Street Morning Report: S&P Earnings Growth Hits 30-Year High, Nvidia Becomes SpaceX's 6th Largest Shareholder

Wall Street Morning Report: S&P 500 earnings growth hits a 30-year high; Nvidia becomes SpaceX's 6th largest shareholder. Market Summary: U.S. stocks ended slightly lower on Friday after record highs, with the S&P 500 posting a weekly gain. Weaker-than-expected July retail sales data significantly reduced market expectations for a September Fed rate hike. Key Themes: * **Macro & Rates:** The probability of the Fed holding rates steady in September rose to ~70%. Geopolitical tensions in the Middle East supported oil prices near $90. Focus this week is on a $16B 20-year Treasury auction testing investor demand amid high yields. * **Corporate Earnings:** S&P 500 Q2 earnings grew 31%, the fastest pace since 1992 excluding recession recoveries, driving a valuation reset. * **AI & Tech Sector Rotation:** The AI investment narrative faces scrutiny over financing and return timelines. Semiconductor stocks saw divergence: memory (SanDisk, Micron) and optical communication (Applied Optoelectronics) surged, while Broadcom fell sharply on credit rating downgrade concerns over AI leasing exposure. * **Notable Moves:** Nvidia disclosed a ~$21B stake in SpaceX. AMD rose 6.5% after a record debt issuance. Reddit rallied ahead of its S&P 500 inclusion. This Week's Highlights: * **Fed Minutes (Thu):** Key for gauging policy divergence and September rate outlook. * **Key Earnings:** Alibaba, Walmart, Nvidia, AMD. * **Events:** Seoul AI Summit, World Robot Conference, potential恒生指数 rebalancing. * **Data:** U.S. jobless claims, Japan core CPI, Korea early export data (a leading indicator for semiconductors).

marsbit23m ago

Wall Street Morning Report: S&P Earnings Growth Hits 30-Year High, Nvidia Becomes SpaceX's 6th Largest Shareholder

marsbit23m ago

BTC in Range-Bound Consolidation, HYPE Daily Rebound Confirmed | Invited Analysis

**Market Analysis: BTC Consolidates in Range, HYPE Shows Daily Rebound Confirmation (Weekly Outlook)** **BTC Analysis:** The market is at a key juncture. Bitcoin is undergoing a daily correction, with a critical focus on whether it can find support and stabilize above the $60,950 level. The adjustment that began from the May 6th high has formed a complex seven-segment structure on the daily chart. Three potential paths are identified: 1. **Continuation of the c-wave rally** (primary scenario), targeting $67,300 initially, then $69,500-$71,000. 2. **Range-bound consolidation** between $60,950 and $65,500, forming an "ascending中枢" before an upward breakout. 3. **Breakdown and secondary探底** if support at $60,950-$61,500 fails. Analysis favors the first two scenarios. The 4-hour chart suggests the current adjustment phase is nearing completion near the strong $60,950-$61,500 support zone. **BTC Strategy:** * **Key Levels:** Support at $62,268, $60,950-$61,500, $57,820. Resistance at $65,500, $67,300, $69,500-$71,000. * **Mid-term:** Current model indicates a bearish structure with ~20% short exposure. Consider adding to shorts (up to 50%) only if price rallies to $69,500-$71,000, shows clear stagnation, and model confirms. * **Short-term (30% capital):** Two tactical plans: * **A) Test shorts** near strong resistance ($69,500-$71,000) upon signs of weakness. * **B) Test longs** near strong support ($60,950-$61,500) upon stabilization signals. **HYPE Analysis:** HYPE has established a daily rebound from the August 2nd low. The 4-hour chart shows a five-segment上升 structure with a formed "ascending中枢". The current (76-77) segment is crucial. Two outcomes are possible: 1. **Breakout (Central离开段):** If price breaks and holds above the $58-$58.5 resistance zone, the uptrend continues. Monitor for momentum背驰 between the initial and breakout segments. 2. **Consolidation (Central Extension):** Failure to hold above $58-$58.5 leads to a return to中枢 consolidation, requiring new signals for direction. **HYPE Strategy:** * **Key Levels:** Support at $50-$52, $45. Resistance at $58.5-$60, descending channel upper rail, $72.97. * **Watch:** Whether price can break/hold above $58-$58.5 to confirm the breakout. * **Action:** * **Existing longs (from $50-$52):** Move stop-loss above entry cost. * **New entrants:** Consider light longs only on a confirmed breakout above $58.5-$60 with a tight stop-loss. Exit quickly if momentum背驰 appears. **General Risk Management:** * Set initial stop-loss immediately upon entry. * Move stop-loss to breakeven at +1% profit. * Trail stop-loss upwards by 1% for every subsequent 1% gain to lock in profits. **Disclaimer:** Market conditions change rapidly. This analysis is for informational purposes only and not investment advice. Trading carries significant risk.

marsbit26m ago

BTC in Range-Bound Consolidation, HYPE Daily Rebound Confirmed | Invited Analysis

marsbit26m ago

Not Chasing AI or Buying Back Shares, Can 'Stingy' Jingdong Still Succeed?

On August 13th, JD.com (JD.US) released its Q2 2026 earnings, delivering a mixed and generally "flat" performance that met low expectations but offered few positives. Overall revenue declined by approximately 3% year-over-year (YoY) to ~¥346.4 billion, aligning with weakened domestic consumption trends. While group operating profit saw a YoY improvement, this was primarily due to reduced losses in the food delivery segment compared to the high-cost "delivery war" period of the previous year. Key details reveal deeper concerns: revenue from JD's core domestic retail segment fell 4.7% YoY. While electronics sales declined less than feared (~12% YoY), growth in daily necessities and advertising services plummeted by about 10 percentage points each, raising doubts about the segment's mid-term growth momentum post-subsidy adjustments. Logistics revenue growth also slowed to 5.9% as the delivery boom faded. Profitability presented a nuanced picture. The retail segment's operating margin edged up slightly YoY but failed to deliver the significant beats seen in past quarters, suggesting efficiency gains may be nearing limits. Losses from the New Businesses segment (including food delivery and overseas ventures) remained elevated at ~¥9.9 billion, as increased overseas investment partially offset reductions in delivery subsidies. Notably, JD's shareholder returns weakened significantly, with share buybacks in H1 2026 annualizing to only about 5% of market cap. The company opted to park cash in short-term investments rather than boost returns, drawing criticism. Looking ahead, JD's performance hinges on a potential recovery in China's e-commerce sentiment in H2 2026 and the scale of ongoing losses in new ventures. While not burdened by massive AI capex like some peers, and offering relative defensive stability, the lack of positive earnings surprises and diminished shareholder returns provide little compelling reason for investors to favor the stock in the near term.

marsbit36m ago

Not Chasing AI or Buying Back Shares, Can 'Stingy' Jingdong Still Succeed?

marsbit36m ago

Trading

Spot
活动图片