If Dogecoin Breaks Through This Sell Wall, Expect A Pump

bitcoinistPublished on 2026-04-04Last updated on 2026-04-04

Abstract

Dogecoin (DOGE) has been in a prolonged downtrend, but analysts suggest a potential major price surge if it breaks through a key sell wall around $0.09. Crypto analyst CW notes that if DOGE strongly surpasses this level, it could trigger a bullish reversal with a potential rally toward $1.12—a gain of over 1,144%. The coin has been trading in a descending channel since September 2025, and a breakout could mark the end of its bearish trend. Another expert, Osemka, also suggests an upward move is more likely than a breakdown. As of now, DOGE remains around $0.091, still below key resistance levels.

The Dogecoin (DOGE) price has been in a prolonged downtrend for months, basically mirroring Bitcoin’s decline and showing no signs of a sustained recovery or uptrend. However, a crypto analyst has suggested that this might change soon. The analyst has identified a critical sell wall on the Dogecoin chart that, if broken, could trigger a major trend shift and provide enough momentum for the meme coin to pump higher.

Dogecoin Could Rally If Sell Wall Breaks

Crypto market analyst CW has highlighted a major sell wall around the $0.09 that could determine Dogecoin’s next bullish move. In an X post on Wednesday, the analyst noted that Dogecoin is already preparing to break through this key area, as its price tests $0.09 and holds this support level firmly.

According to the analyst, if DOGE can push past this current support zone with strength, there may be no other resistance level strong enough to hold the meme coin until around $1.12. This means that CW expects the DOGE price to rise quickly toward this new high, representing a staggering increase of more than 1,144% from $0.09.
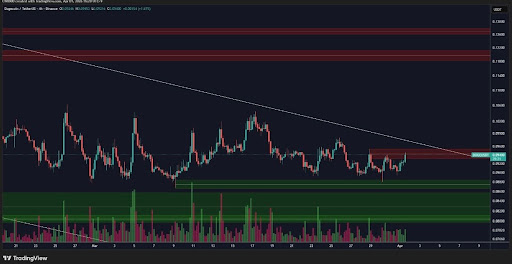
Source: Chart from CW on X

The market expert noted that this price surge could come with a bullish trend reversal, likely confirming the end of Dogecoin’s prolonged downtrend. Notably, the analyst’s chart shows that the meme coin has been trading sideways within a descending channel since its price surge in September 2025.

After rallying above the $0.25 area, Dogecoin has moved downward, previously crashing to this same critical support zone around $0.09 during the devastating October 2025 liquidation event. Although the meme coin rose back to normal levels, it remained range-bound inside this descending channel. With price showing strong breakout signals, CW has stated that once Dogecoin rises above this channel, its next major uptrend could begin in days.

DOGE Breakdown Remains The Less Likely Scenario

In a separate X post, market analyst Osemka shared a price chart showing Dogecoin hovering around $0.09. He noted that the meme coin is currently trading in a tight range, with the price stuck between support and resistance. According to him, this behavior cannot last forever, suggesting that the DOGE price could soon make a strong move either upward or downward to break the critical area.

Based on his chart analysis, Osemka appears cautiously bullish on Dogecoin. He said it would be a “little miracle” for Dogecoin to break downward, suggesting the more likely scenario is a strong rise above $0.09 soon. If this happens, it could completely invalidate DOGE’s bearish outlook and possibly trigger its next trend shift to the upside.

As of now, the market is cautiously watching as DOGE trades around $0.091 at the time of writing, still trapped below both the Exponential Moving Average (EMA) and the descending channel.

DOGE trading at $0.09 on the 1D chart | Source: DOGEUSDT on Tradingview.com

Trending Cryptos

Related Questions

QWhat is the critical price level that Dogecoin needs to break through for a potential pump, according to analyst CW?

AThe critical price level that Dogecoin needs to break through is the sell wall around $0.09.

QWhat is the potential price target for Dogecoin if it successfully breaks the $0.09 resistance with strength?

AIf Dogecoin breaks through the $0.09 resistance with strength, the next major resistance isn't expected until around $1.12, representing a potential increase of over 1,144%.

QWhat chart pattern has Dogecoin been trading within since its price surge in September 2025?

ADogecoin has been trading sideways within a descending channel since its price surge in September 2025.

QAccording to analyst Osemka, what would be a 'little miracle' for Dogecoin's price to do?

AAccording to Osemka, it would be a 'little miracle' for Dogecoin's price to break downward from its current range.

QWhat event in October 2025 previously caused Dogecoin to crash to the $0.09 support level?

ADogecoin previously crashed to the $0.09 support level during the devastating October 2025 liquidation event.

Related Reads

CryptoQuant Analyst Claims 'Frightening Scenario and Simultaneously Promising Signal for Bitcoin' Reveals Ultimate Bottom Point! Here Are the Details

Bitcoin, the leading cryptocurrency, entered a bear market after hitting a historic high of $126,000 in October 2025 and has since fallen over 50%. As BTC recently dropped to around $57,000, opinions diverge on whether the bottom has been reached, with some expecting a drop closer to $50,000. According to a pseudonymous CryptoQuant analyst, the Bitcoin bear market may be nearing its end. The analyst notes that as selling pressure following the all-time high weakens, price corrections are becoming shorter and recovery periods more substantial. The July decline was only slightly below lows seen in early February, and BTC has remained relatively stable around $60,000 since, indicating diminished seller influence. Positive technical signals are also cited, with MACD and RSI showing bullish signals, positive divergences, and oversold conditions, collectively suggesting a potential bottom formation for BTC. However, the analyst does not rule out a final sell-off in the short term. They suggest the ultimate market bottom could be around $51,336, corresponding to the 61.8% Fibonacci retracement level. The $50,000 area is highlighted as a crucial historical support zone, aligning with the average investor cost basis and the 200-week moving average—conditions similar to bottoms in previous bear markets. *This is not investment advice.

cryptonews.ru3m ago

CryptoQuant Analyst Claims 'Frightening Scenario and Simultaneously Promising Signal for Bitcoin' Reveals Ultimate Bottom Point! Here Are the Details

cryptonews.ru3m ago

Trading

Spot

Hot Articles

Discussions

Welcome to the HTX Community. Here, you can stay informed about the latest platform developments and gain access to professional market insights. Users' opinions on the price of PUMP (PUMP) are presented below.

活动图片