In the first quarter of 2026, the crypto market experienced a historic deleveraging storm. Bitcoin retreated more than 40% from its high, Ethereum fell even deeper, and altcoins were generally halved. This round of sharp decline was not solely due to cooling market sentiment or regulatory rumors; behind it was the resonance of three liquidity tightening factors: the large-scale unwinding of the Yen carry trade, the withdrawal of market funds due to the rebuilding of the U.S. Treasury's TGA account, and the systemic increase in margin requirements in the derivatives market. These factors, combined with the crypto market's own high-leverage structure and valuation bubbles, collectively triggered a stampede-like sell-off. Looking ahead, the crypto market has bid farewell to the extensive growth stage driven by "excess liquidity" and entered a new normal dominated by macro factors. Against the backdrop of an unclear Federal Reserve policy path and the contraction of global central bank balance sheets, crypto assets will face sustained repricing pressure.
I. The Historical High Valuation of U.S. Stocks: The "Ceiling Effect" on Risk Asset Pricing
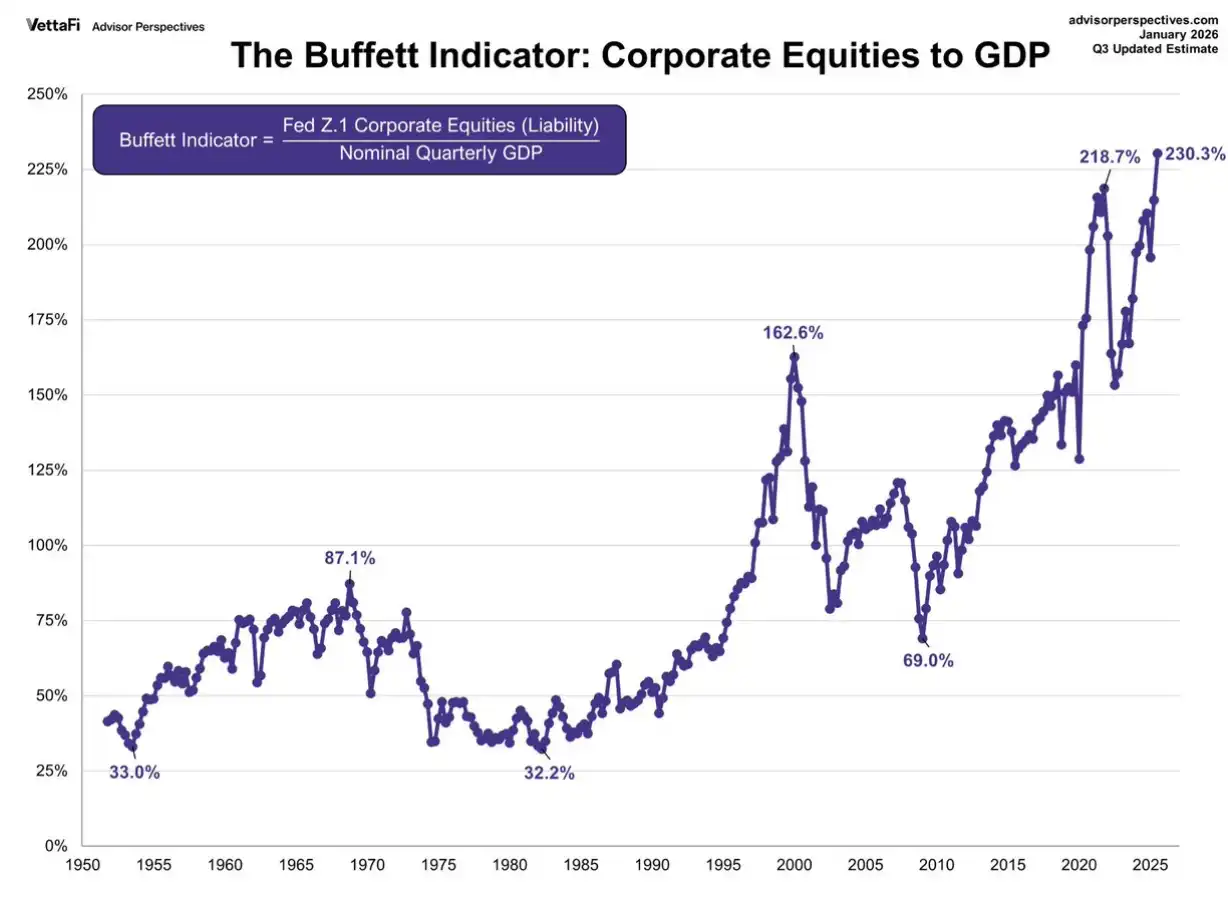
When analyzing the trends of the crypto market, an unignorable macro background is that U.S. stock valuations are in a historically high range. As the "pricing anchor" for global risk assets, the valuation level of U.S. stocks not only reflects market expectations for U.S. corporate profits but also profoundly influences the valuation ceiling of the crypto market through channels such as asset comparison effects, investor risk appetite, and global capital flows. Multiple indicators confirm the current high valuation of U.S. stocks. The Buffett Indicator shows that the ratio of total market capitalization to GDP has climbed to an extreme historical high of 230%, far exceeding the levels before the 2000 dot-com bubble and the 2007 financial crisis. The 12-month forward P/E ratio of the S&P 500 is 22.0 times, significantly higher than the 30-year historical average of 17.1 times and close to the 25.2 times during the dot-com bubble. The Shiller Cyclically Adjusted P/E ratio is about 38 times, second only to the 44 times in 2000. The price-to-sales ratio has exceeded 3.0 times, hitting a record high. These indicators collectively point to one conclusion: U.S. stocks are in a significantly overvalued range.
The high valuation of U.S. stocks transmits to the crypto market through several mechanisms. From the perspective of asset comparison effects, when U.S. stock valuations are at historical highs, it implies lower future expected returns, prompting rational investors to reassess the allocation proportion of all risk assets. Crypto assets, as higher-volatility "peripheral risk assets," are often the first to be reduced. From the perspective of Federal Reserve policy constraints, the high valuation of U.S. stocks puts the Fed in a dilemma, limiting its room for easing and potentially keeping it hawkish for longer than the market expects, which suppresses all risk assets. From the perspective of profit-taking, after years of gains, institutional investors are generally overweight on U.S. stocks. When valuations reach extreme levels, they systematically reduce risk exposure, a process often manifested by selling the best-performing and most liquid assets—including Bitcoin. From the perspective of risk sentiment, U.S. stocks, as the bellwether for global risk assets, trigger investor caution toward all overvalued, hard-to-quantify assets when at high valuations, with crypto assets being the easiest to abandon.
Looking back at history, every time valuations reached current levels, they eventually ended with painful mean reversion. The lessons of 1929, 2000, and 2007 are still vivid. The特殊性 of the current U.S. stock valuation lies in the fact that it is the direct product of the longest-lasting and largest-scale experiment with宽松 monetary policy over the past 15 years. When these policies begin to exit and valuations are at historical highs, the regression process may be more violent than before. For the crypto market, this means that even if the industry's own fundamentals continue to improve, macro-level valuation suppression will remain a significant headwind for the next 1-2 years. Only when U.S. stock valuations return to a reasonable range through time digestion or spatial adjustment can the crypto market truly embark on a new healthy upward cycle.
II. Unwinding of the Yen Carry Trade: The "Invisible Drain" of Global Liquidity
The reversal of the Yen carry trade was the trigger for this round of crypto market暴跌 and the most critical macro driver. For a long time, the Bank of Japan's maintained zero-interest-rate policy made the yen the currency with the lowest financing cost globally. International investors borrowed yen on a large scale, converted it into U.S. dollars or other high-interest currencies, and invested in global high-yield assets—including highly volatile cryptocurrencies.
In early 2026, the underlying logic of this arbitrage model began to动摇. As domestic inflationary pressures emerged in Japan, market expectations for the Bank of Japan to exit its negative interest rate policy surged sharply. Japanese government bond yields jumped multiple times, with the 10-year JGB yield breaking through 1.2%, hitting a multi-year high. This change directly compressed the interest rate differential between the yen and the U.S. dollar: when the cost of borrowing yen rises, and the expected return on dollar assets remains unchanged or even decreases, the attractiveness of the carry trade plummets.
More致命的是, when the yen begins to appreciate (the USD/JPY exchange rate fell from above 150 to the 140 range), carry traders not only face narrowing interest rate differentials but also bear exchange losses. In this situation, the most rational choice is to unwind: sell previously held overseas assets (including Bitcoin, Ethereum, and other crypto assets), convert back to yen, and repay loans. The特殊性 of the crypto market lies in its 7×24-hour trading and high liquidity, making it the first "ATM" for carry traders to sell. Data clearly shows that during the several trading days of rapid yen appreciation in mid-February, Bitcoin and the yen exchange rate showed a highly negative correlation, a typical characteristic of carry trade unwinding.
It is worth noting that the scale of the yen carry trade is estimated to be trillions of dollars, and its unwinding process is often sustained. As long as the Japan-U.S. interest rate differential does not widen again and the yen's appreciation trend does not reverse, this "drain" will continue to withdraw funds from the global risk asset market. For the crypto market, which relies on incremental funds to drive growth, this is undoubtedly cutting off the lifeblood.
III. TGA Account Rebuilding and Treasury Issuance: The Liquidity Siphon of Fiscal Policy
If the yen carry trade represents liquidity tightening at the international level, then changes in the balance of the U.S. Treasury General Account (TGA) represent direct drainage within the dollar system. The TGA account is essentially the Treasury's "wallet": when the Treasury increases the TGA balance by issuing treasury bonds or collecting taxes, it means funds flow from the commercial banking system into the Treasury account, leading to a decrease in bank reserves and tighter market liquidity; conversely, when the Treasury spends (e.g., paying government contracts, social security, etc.), funds flow back to the market, increasing liquidity.
From February to March 2026, the market faced a period of rapid TGA balance rebuilding. According to the financing plan announced by the U.S. Treasury, the TGA balance target was maintained at $850 billion at the end of March and would reach a peak of about $1.025 trillion during the April tax season. This means that within just two months, the Treasury would withdraw nearly $200 billion from the financial system. At the same time, to replenish the TGA and finance the budget deficit, the Treasury announced a large-scale quarterly refunding plan in early February, with treasury issuance exceeding market expectations.
This combination of "issuing debt + thickening the TGA balance" directly led to a continuous decline in bank reserves. For the crypto market, the transmission mechanism is more indirect but equally致命: reduced reserves → financial institutions contract credit → reduced financing capacity of hedge funds and market makers → forced compression of risk exposure → crypto assets遭遇减持. The reserve assets of stablecoin issuers are mainly U.S. Treasuries; TGA rebuilding加剧 the volatility of U.S. Treasury yields, which also indirectly affected the redemption pressure and liquidity support capacity of stablecoins.
Historical experience shows that drastic changes in the TGA balance are often highly correlated with the price trends of risk assets. When the TGA balance fell rapidly (fiscal spending) in early 2021, Bitcoin welcomed the climax of the bull market; the TGA rebuilding process in early 2026 corresponded to the continuous阴跌 and eventual collapse of the crypto market. This is not a coincidence but an inevitable reflection of the liquidity cycle.
IV. Margin Increases and Derivatives Deleveraging: Forced Liquidations at the Exchange Level
In addition to liquidity tightening at the macro level, the fragility of the crypto market's own derivatives structure was also an important amplifier of the暴跌. In early February, as extreme volatility emerged in the gold, silver, and other precious metals markets, the Chicago Mercantile Exchange (CME) repeatedly increased margin requirements for gold and silver futures. Although this move was targeted at the precious metals market, its ripple effects quickly transmitted to the crypto market.
First, as the world's most important derivatives exchange, CME's margin adjustments have a示范效应. Risk control departments of major crypto exchanges, after observing rising market volatility, followed suit by increasing margin ratios for perpetual contracts and futures and lowering leverage limits. For the crypto market, which highly relies on leveraged trading, this was equivalent to forced deleveraging. A large number of highly leveraged positions were forced to liquidate, triggering further price declines, which in turn triggered more liquidations, forming a negative spiral.
Second, the crypto market and the precious metals market share a common long群体—macro hedge funds and trend traders. When these institutions suffer losses in the precious metals market due to margin increases, they often need to sell other assets (including crypto assets) to supplement margins or cover losses. This cross-asset risk unwinding further exacerbated the selling pressure in the crypto market.
More值得注意的是, during this round of暴跌, the futures premium for Bitcoin and Ethereum quickly turned negative (backwardation), and the funding rate for perpetual contracts remained negative for a sustained period, indicating that the market had shifted from being dominated by longs to being dominated by shorts. When the funding rate is negative for a long time, it means that longs not only suffer from price declines but also have to pay funding fees to shorts, which further weakens the willingness of longs to hold positions and prolongs the market's bottom-finding time. Historical data shows that only when the funding rate returns to neutral or even turns positive and the futures premium recovers can the market truly stabilize.
V. The Crypto Market's Own Structure: Dual Fragility of High Valuation and Liquidity Dependence
Against the backdrop of macro liquidity tightening, the crypto market's own characteristics of high valuation and high leverage amplified the intensity of the decline. Although crypto assets do not have traditional P/E valuations, we can assess their valuation levels through multiple dimensions:
First, Bitcoin's market dominance. Before this round of暴跌, Bitcoin's market dominance once fell below 40%, with a large amount of funds flowing into various altcoins and DeFi tokens. This is a typical late-bull-market特征—funds chase high-risk, high-return tail assets rather than leading assets. When liquidity reverses, these high-beta assets are often the first to be hit, falling far more than Bitcoin.
Second, changes in the total market capitalization of stablecoins. Stablecoins are the "standby cash" of the crypto market, and changes in their total market capitalization reflect the willingness of off-market funds to enter. Data shows that since January 2026, the total market capitalization of USDT and USDC has stagnated or even slightly declined, indicating that the speed of new fund entry can no longer keep up with market expansion demand. When the market relies on存量 funds and leverage to maintain highs, any liquidity shock can lead to a collapse.
Third, the divergence between on-chain activity and price. In the months before the暴跌, although Bitcoin prices remained high, indicators such as the number of active addresses and transaction volume on the chain did not hit new highs同步, and even declined. This indicates that the price increase was mainly driven by leveraged trading within exchanges, rather than real fundamental improvement or adoption rate increase. Leverage-driven rallies often come and go quickly; once funding tightens, prices will quickly回归.
The特殊性 of the crypto market lies in the fact that its participants are far more sensitive to macro liquidity than other asset classes. This is because the crypto market does not have traditional "endogenous cash flow"; its price is entirely determined by the entry willingness of marginal buyers. When macro liquidity is abundant, these marginal buyers (mainly risk-prone retail investors and hedge funds) have ample funds, driving prices up; when macro liquidity tightens, they are also the first to withdraw. This round of暴跌 is the most vivid portrayal of this mechanism.
VI. Future Outlook: Repricing of Crypto Assets Under the Liquidity Indicator Framework
Looking ahead, the trend of the crypto market will no longer be determined by a single factor but will enter a new phase dominated by macro factors. Investors need to establish an analytical framework with liquidity indicators at its core, focusing on the following variables:
First, the Federal Reserve's monetary policy path. Although the market is concerned about the hawkish stance of the new Fed Chair Warsh, it is more important to observe actual economic data. If the job market shows significant cooling and inflation continues to fall, the Fed's tightening pace may be slower than expected. The CME FedWatch tool shows that the market's expectation for rate cuts in 2026 has been大幅下调, but this has been partially digested. The key lies in when the Fed releases a clear policy shift signal.
Second, changes in the TGA balance and net liquidity. Investors should closely monitor the TGA balance data published weekly by the U.S. Treasury, as well as changes in the Fed's balance sheet and the ON RRP balance. Net liquidity (Total Fed Assets - TGA - ON RRP) is the most intuitive indicator to measure the available cash in the market. If net liquidity continues to decline, the crypto market will continue to be under pressure; conversely, if net liquidity bottoms out and rebounds, a阶段性反弹 may occur.
Third, the evolution of the yen carry trade. The USD/JPY exchange rate and the 2-year U.S.-Japan government bond yield spread are two key observation points. If the yen's appreciation trend stops and the U.S.-Japan interest rate differential stabilizes or even widens, the pressure from carry trade unwinding will ease, which is a positive signal for global risk assets including the crypto market. Conversely, if the yen continues to appreciate, further deleveraging needs to be警惕.
Finally, the structural indicators of the crypto market itself. Whether the total market capitalization of stablecoins resumes growth, whether Bitcoin's market dominance stabilizes, and whether the funding rate for perpetual contracts turns positive are all important references for judging whether the market has bottomed out. Historical experience shows that only when the funding rate is consistently positive, the futures premium recovers, and stablecoins flow back into exchanges does it mean that market confidence has truly repaired.
On a specific time dimension, the second quarter is usually a period of relatively tight liquidity during the year (the TGA balance peaks during the tax season), coupled with the ongoing Fed balance sheet reduction, the crypto market may continue its震荡寻底 trend. The real turning point may have to wait until the second half of the year—after the TGA balance begins to decline and the market forms a clearer expectation of the Fed's policy path.
VII. Conclusion: Farewell to Extensive Growth, Welcome the Macro New Normal
The crypto market暴跌 in the first quarter of 2026 was a systemic deleveraging event driven by macro liquidity and amplified by the crypto market's own structure. It marks the end of the extensive growth stage driven by宽松 liquidity since 2023, and the crypto market has officially entered a macro new normal.
In this new normal, crypto assets, like other risk assets, will be profoundly affected by macro variables such as global central bank balance sheets, fiscal policies, and exchange rate movements. The narratives of "the crypto market being desensitized to macro factors" and "digital gold's safe-haven属性" were disproven in this round of暴跌—when a real liquidity crisis came, Bitcoin's decline was no less than that of tech stocks, and its correlation with the Nasdaq指数 rose to a historical high.
For investors, this means the need to establish a more macro analytical perspective, rather than仅仅 focusing on project fundamentals or technological progress. Liquidity indicators should become one of the core bases for investment decisions:关注 changes in net liquidity,关注 whether the SOFR rate is abnormally rising,关注 whether the美债 volatility index MOVE is rising,关注 whether high-yield credit spreads are widening. These macro variables will determine the beta direction of the crypto market, while project fundamentals only provide alpha opportunities after beta is determined.
Of course,暴跌 often孕育 new opportunities. After leverage is cleared out, speculators leave, and valuations return to rationality, truly valuable long-term projects will迎来建仓时机. But before the macro liquidity environment shows a clear turning point, caution is advised. For the crypto market, cash is the final scarce commodity, and liquidity is the only truth.


