Hedera reclaims key resistance, eyes trend reversal: Can HBAR hold above $0.10?

ambcryptoPublished on 2026-02-15Last updated on 2026-02-15

Abstract

HBAR has broken above the key $0.10 resistance level, signaling a potential trend reversal after a prolonged downtrend. The price formed higher lows between $0.073–$0.090, indicating weakening bearish control, and a decisive weekly close above $0.10 confirmed the structural breakout. Follow-up buying pushed the price toward $0.134, establishing the first higher high. Despite rejection wicks near the $0.104–$0.107 supply zone, pullbacks held above $0.097–$0.10, suggesting strong support reclamation. The bullish momentum was amplified by a 43% surge in spot trading volume, exceeding $200 million, following FedEx's announcement to join the Hedera Council. Additionally, an inverse head-and-shoulders pattern formation and rising futures open interest (up 9% to $29 million) with positive funding rates indicated strong leveraged long positioning. However, this also introduces crowding risk, making the rally vulnerable if spot demand fades. At the time of writing, HBAR faces a critical inflection point. Sustained closes above $0.10 could lead to a push toward $0.11–$0.134, validating the reversal. Failure to hold above $0.10 may result in a retracement toward $0.090 or even $0.078. The overall structure suggests an early bullish transition, but continuation depends on confirmed breakout strength above the $0.10–$0.104 resistance band.

HBAR’s structure began shifting as price compressed beneath the descending long-term trendline and the $0.10 horizontal resistance, where sell pressure had repeatedly capped upside.

Buyers gradually absorbed supply within the $0.073–$0.090 range, forming higher lows that hinted at weakening bearish control.

Momentum then expanded, and a decisive weekly close above $0.10 confirmed the structural breakout and trendline breach.

Source: TradingView

Follow-through buying pushed the price toward $0.134, establishing the first higher high after the downtrend.

Although rejection wicks emerged at this supply zone, pullbacks held above $0.097–$0.10, signaling support reclamation rather than breakdown.

Moreover, holding above former resistance confirmed acceptance, while the higher-low defense validated early higher-timeframe trend reversal.

Together, the breakout, the support flip, and the higher highs-higher lows formation signaled a transition from distribution into early bullish trend development.

Factors amplifying HBAR’s bullish momentum

As the bullish structure matured, volume and leverage flows began accelerating.

Hedera [HBAR] recorded clear volume expansion during the rebound phase amid global logistics powerhouse FedEx joining Hedera’s council. Spot trading volume surged over 43%, exceeding $200 million.

Price simultaneously advanced 7%, reclaiming key moving averages. This rise confirmed strong buyer conviction behind the move.

Demand originated from the $0.09 support base, signaling organic accumulation rather than speculative rotation.

Moreover, the rally aligned with an inverse head-and-shoulders formation. Rising volume into the neckline break strengthened pattern validity and sustainability.

Source: CoinGlass

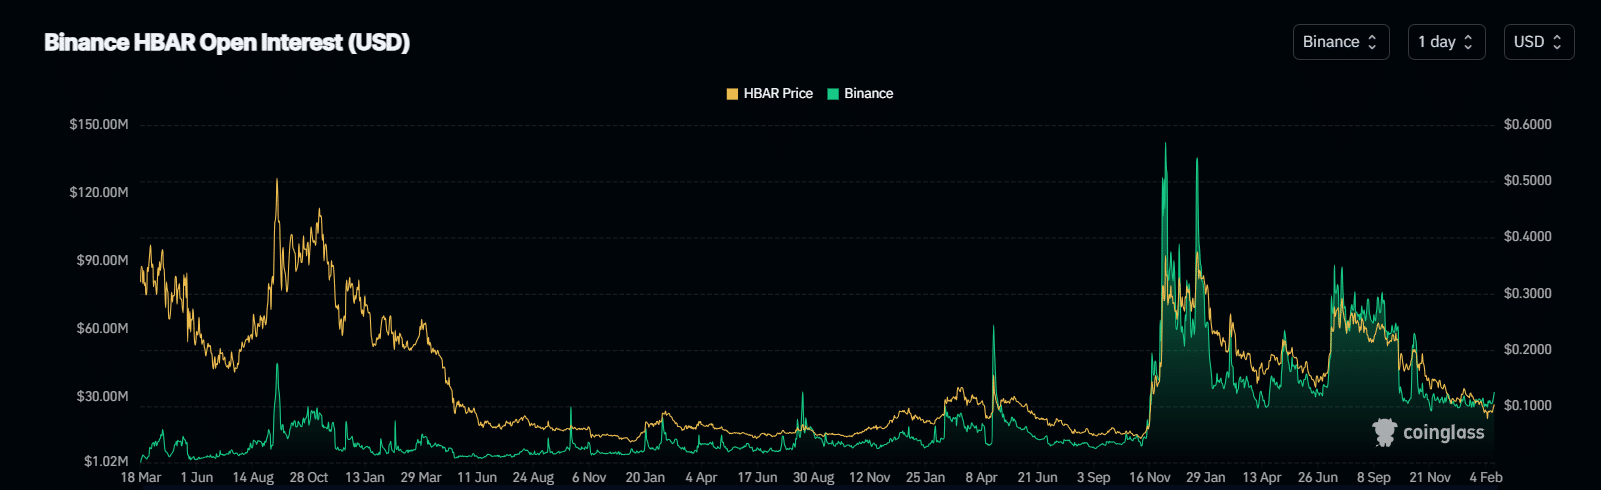
Derivatives positioning then added further context. Futures Open Interest climbed 9% to nearly $29 million between the 11th and the 12th of February.

At the same time, Funding Rates flipped positive near +0.05%. This shift indicated leveraged longs entering aggressively.

While leverage amplified upside momentum, it also introduced crowding risk. Elevated positioning increases squeeze potential if the price holds. However, it also raises vulnerability to pullbacks if spot demand fades.

HBAR: Reversal momentum builds

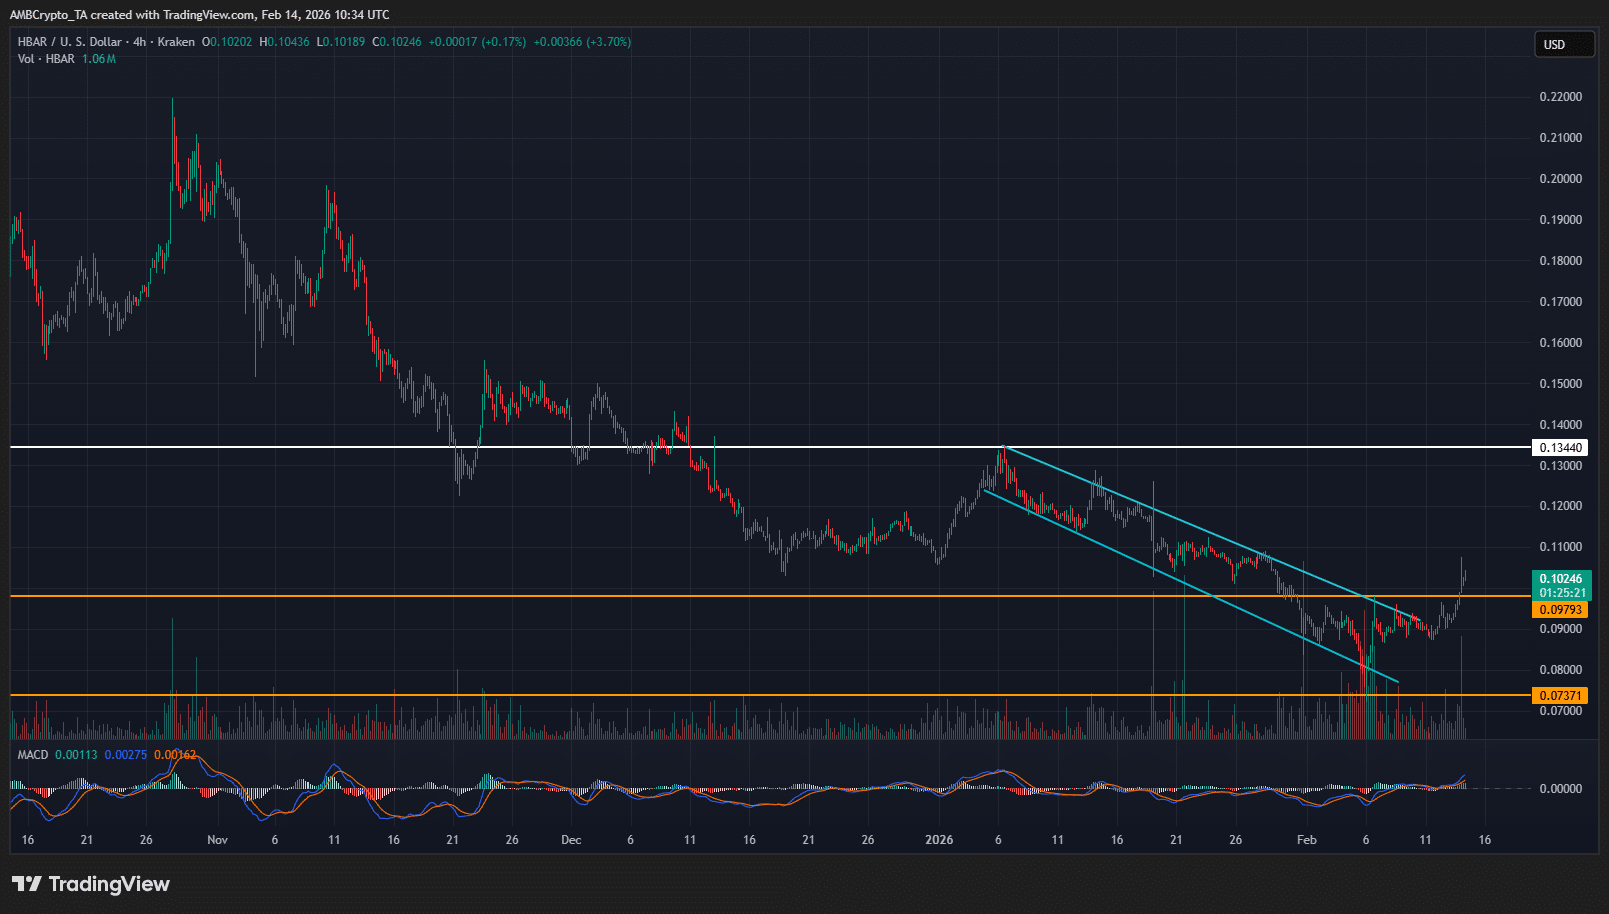
At the time of writing, HBAR continued confronting macro downside pressure as the price traded below the descending trendline from the $0.21 November 2025 peak.

Sellers still defended the lower-high structure, yet demand is beginning to rebuild near the $0.078 base.

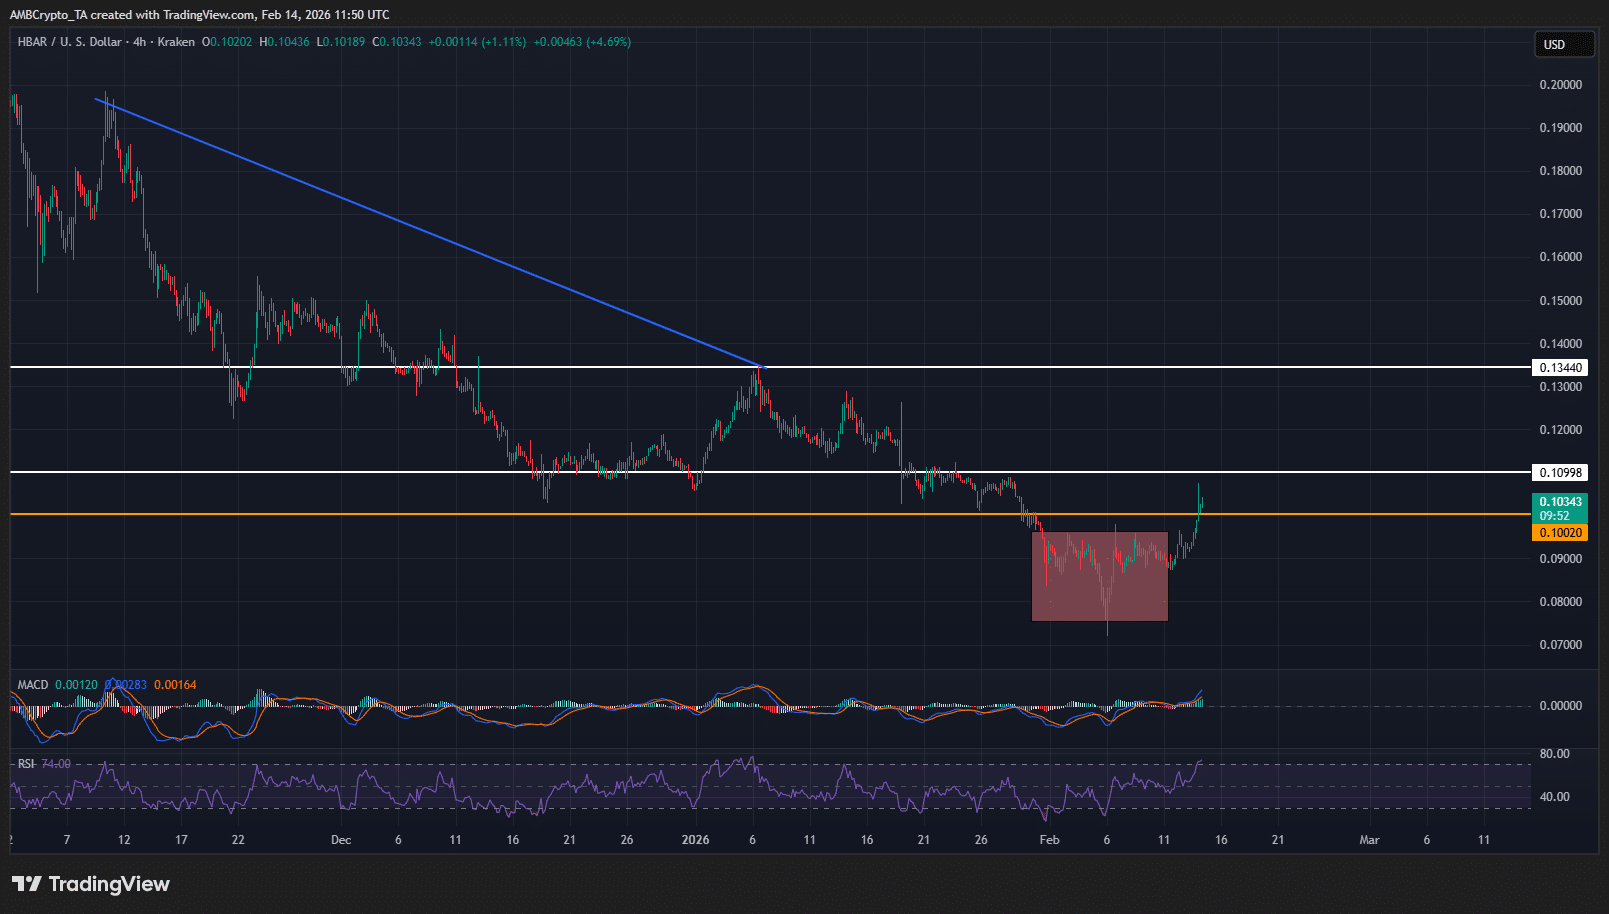
However, buyers are now pressing into the $0.10–$0.104 supply band after breaking the short-term market structure breakout between $0.090 and $0.102.

Source: TradingView

If price secures sustained closes above $0.10, buyers will likely target the $0.11–$0.134 resistance corridor. Follow-through strength would confirm a breakout above and extend the emerging higher-low sequence.

However, repeated rejection wicks near $0.104–$0.107 signal active supply. If sellers force the price back below $0.098–$0.10, the breakout risks invalidation.

In that case, price may retrace toward $0.090 or retest the $0.078 demand floor.

Thus, the structure now sits at an inflection point where structural validation above supply will determine whether reversal momentum expands or fades.


Final Summary

  • HBAR’s break above $0.10, backed by higher lows and volume expansion, signals an early bullish trend transition from prior distribution.
  • Yet leveraged long crowding and supply near $0.104–$0.107 leaves continuation dependent on sustained breakout confirmation above $0.10.
Next: Solana’s divergence explained – Is SOL undervalued or not?
Share
  • Share
  • Tweet

Related Questions

QWhat key resistance level did HBAR break above to signal a potential trend reversal?

AHBAR broke above the key resistance level of $0.10, which was a significant horizontal resistance and the descending long-term trendline.

QWhat fundamental news event contributed to the surge in HBAR's trading volume and price?

AGlobal logistics powerhouse FedEx announced it was joining the Hedera Council, which contributed to a 43% surge in spot volume and a 7% price increase.

QWhat technical pattern, mentioned in the article, strengthened the validity of the bullish move?

AAn inverse head-and-shoulders formation was mentioned, with rising volume into the neckline break strengthening the pattern's validity and sustainability.

QWhat are the two possible price targets for HBAR if it secures a sustained close above $0.10?

AIf HBAR secures a sustained close above $0.10, the likely resistance corridors to target are $0.11 and $0.134.

QWhat risk did the article associate with the increase in Futures Open Interest and positive Funding Rates?

AThe increase in leveraged long positions introduced a crowding risk, making the price more vulnerable to a squeeze if spot demand fades or to sharp pullbacks, increasing volatility.

Related Reads

RWA First Stock's Major Acquisition: Why Buy a 'Traditional' Mortgage Company?

On June 10th, Figure Technology Solutions (Nasdaq: FIGR), a blockchain-native capital markets firm, announced a $717 million acquisition of Kiavi, a leading non-bank lender for residential real estate investors. The deal involves Figure acquiring Kiavi's technology and operations for approximately $538 million, while forming a joint venture with alternative asset manager Sixth Street to purchase Kiavi's existing loan portfolio. Sixth Street also provided a $3 billion forward purchase commitment. This acquisition marks a strategic shift for Figure, known as the "RWA (Real World Asset) first stock," allowing it to expand significantly into the larger market of first-lien mortgages. Kiavi specializes in non-qualified mortgage (Non-QM) loans, such as short-term fix-and-flip (RTL) and rental property (DSCR) loans—a segment traditionally underserved by major banks. The move is expected to increase Figure's first-lien loan origination to over $7 billion annually, aiming for these to constitute about 40% of its business by 2027. Both companies leverage AI for underwriting: Kiavi uses proprietary models to value renovated properties and automate document processing, dominating the fix-and-flip lending space. Figure plans to integrate these assets onto its blockchain platform, Provenance, using its new 'Adaptor' product to standardize and tokenize the loans for institutional investors on its Democratized Prime marketplace. While the integration poses challenges—including merging different asset types, interest rate sensitivity of Kiavi's loans, and post-IPO execution risks—Figure projects the deal to be accretive to earnings with a cash payback period under four years. The transaction is seen as a major step in scaling blockchain-based capital markets, moving RWA tokenization from concept validation toward large-scale operation.

Foresight News22m ago

RWA First Stock's Major Acquisition: Why Buy a 'Traditional' Mortgage Company?

Foresight News22m ago

Trend in US Stocks: A Post Triggers a 930-Point Rebound, Tonight Belongs to SpaceX

On Thursday (June 11, U.S. Eastern Time), Wall Street staged a textbook V-shaped reversal. The Dow Jones surged 929.97 points (+1.86%) to close above 50,000, while the Nasdaq and S&P 500 rose 2.54% and 1.75%, respectively. The rally occurred despite the hottest PPI report in years, with May data showing a 6.5% year-on-year surge, the highest since 2022. The market ignored the inflation data, focusing instead on reports that former President Trump called off a planned strike on Iran, hinting at a potential multi-party peace agreement draft. This sparked a sharp drop in oil prices, fueling hopes that inflation may have peaked. Sector rotations were stark: previously battered AI hardware and cyclical stocks led the gains, while defensive sectors that hit record highs the prior day were sold off. Chip stocks like Micron and Intel saw sharp rebounds. In contrast, software giant Oracle plunged nearly 10% despite beating earnings, with concerns over cloud revenue and cash flow. Adobe also fell after hours despite raising guidance, as its CFO announced departure. The rally's sustainability is questioned, driven largely by social media posts about unconfirmed geopolitical developments. Inflation risks remain, with pipeline pressures still high. Meanwhile, the market's risk appetite faces a major test with SpaceX's historic IPO. Priced at $135 per share, it aims to raise ~$75 billion with a $1.75 trillion valuation, becoming the largest U.S. IPO ever. It will join the Nasdaq 100 in 15 days, triggering massive index fund buying. However, critics cite extreme valuation (88x sales) and market liquidity concerns.

marsbit45m ago

Trend in US Stocks: A Post Triggers a 930-Point Rebound, Tonight Belongs to SpaceX

marsbit45m ago

The Trillion-Dollar Valuation Test: Are the Three Super IPOs a Tech Stock Frenzy or a Crypto Market Nightmare?

Trillion-Dollar Valuation Test: Are the Three Mega IPOs a Tech Stock Frenzy or a Crypto Market Nightmare? The capital market in 2026 is witnessing a highly anticipated wave of tech IPOs, centered on SpaceX, OpenAI, and Anthropic. Collectively valued at over $3.5 trillion, their potential listing represents one of the largest such waves in recent years. This raises concerns about market liquidity, valuation bubbles, and potential capital outflows from other assets like crypto. SpaceX's valuation narrative has shifted from rocket launches to becoming a global infrastructure play via its Starlink satellite network, which now drives most revenue. Despite ongoing losses, investors focus on its long-term growth potential. OpenAI and Anthropic represent the core productivity engines of generative AI. Their public listings would offer the first direct investment opportunity in large foundation model companies, potentially triggering a repricing within the AI sector. Market fears of a massive "capital drain" from these IPOs are likely overstated. Historical precedents like Alibaba and Saudi Aramco show that mega-listings primarily cause capital reallocation, not destruction, within the vast equities market. Systemic risk is rarely triggered by IPOs alone. For stock markets, short-term volatility and sector repricing are expected, especially for AI concept stocks. Long-term, these listings could reinforce the tech sector's importance. For crypto, direct competition for speculative capital exists, particularly affecting AI-themed tokens. However, crypto's trajectory remains more tied to its own cycles, macro liquidity, and Bitcoin ETF flows rather than a single IPO event. The real risk lies not in the listings themselves but in the sky-high growth expectations embedded in these valuations. If future revenue, profitability, or commercialization progress disappoints, significant valuation resets could follow, impacting high-growth tech stocks. Ultimately, the market's direction hinges on macroeconomic conditions and whether these companies can deliver on their ambitious promises.

链捕手1h ago

The Trillion-Dollar Valuation Test: Are the Three Super IPOs a Tech Stock Frenzy or a Crypto Market Nightmare?

链捕手1h ago

Trillion-Dollar Valuation Test: Are the Three Super IPOs a Tech Stock Frenzy or a Crypto Market Nightmare?

Title: Trillion-Dollar Valuations at Stake: Super IPOs of SpaceX, OpenAI, Anthropic – Tech Boom or Crypto Nightmare? TL;DR: A wave of mega-tech IPOs is approaching, featuring SpaceX (targeting a $1.75 trillion valuation), OpenAI (~$852B), and Anthropic (~$965B), with a combined potential valuation exceeding $3.5 trillion. This tests the market's pricing of innovation and sparks debate on liquidity impact. * **SpaceX**'s valuation is now driven more by its Starlink global communications infrastructure than its core rocket business. * **OpenAI & Anthropic** offer the first major public investment opportunities in foundational AI models, potentially repricing the entire AI sector. * Concerns about a market-wide "liquidity drain" are likely overblown; history shows large IPOs mainly cause fund reallocation, not disappearance, and rarely trigger systemic risk. * Crypto markets, especially some AI-themed tokens, may face short-term fund competition, but their long-term trajectory depends more on macro liquidity, regulation, and Bitcoin cycles. * The real risk lies not in the IPOs themselves, but in whether these companies can justify their sky-high valuations with future revenue growth and profitability. Unmet expectations could lead to significant repricing pressure. Ultimately, these IPOs represent a massive market pricing of next-gen tech infrastructure, not a prelude to a market crash. The broader market direction will be determined by macro conditions, corporate earnings, and risk appetite.

marsbit1h ago

Trillion-Dollar Valuation Test: Are the Three Super IPOs a Tech Stock Frenzy or a Crypto Market Nightmare?

marsbit1h ago

Trading

Spot
Futures

Hot Articles

Discussions

Welcome to the HTX Community. Here, you can stay informed about the latest platform developments and gain access to professional market insights. Users' opinions on the price of S (S) are presented below.

活动图片