Glassnode: Farewell to Panic, Embrace Volatility – After a 26% Surge, BTC Faces a 'Supply Wall' at $81,000-$86,000

marsbitPublished on 2026-08-27Last updated on 2026-08-27

Abstract

Glassnode reports that a record-breaking short squeeze, causing massive liquidations, triggered a 26% Bitcoin rebound from mid-August lows. Unlike past leverage-driven rallies, this move is backed by solid capital inflows: US spot ETFs saw their strongest weekly inflows of the year ($2.23B), with Bitcoin consistently leaving exchanges and all wallet cohorts accumulating simultaneously. The rally's sustainability now hinges on overcoming a key "supply wall" in the $81k-$86k range, where significant on-chain cost basis, order book sell-side liquidity, and remaining short liquidation clusters converge. While market structure has improved with leverage reduced and cycle indicators exiting a prolonged cool phase, the advance remains narrowly led by large-cap assets. Breaking above the $81k-$86k resistance with sustained ETF inflows would signal strength; failure to hold above the ~$70k short-term holder cost basis could see a retest of the $62k-$65k support zone.

Author: Glassnode

Compiled by: AididiaoJP, Foresight News

Key Takeaways

  • Record-breaking short liquidations triggered the rebound, with Bitcoin facing a test at the $81,000 to $86,000 supply concentration zone.
  • ETFs saw a single-week net inflow of $2.23 billion, with accumulation across all market participant groups, providing clear support from capital flows.
  • After deleveraging, the market is undergoing turnover; the $81,000-$86,000 range has become a key resistance band overhead.

Introduction

A short squeeze of unprecedented scale ignited a rebound of approximately 26% from the lows in mid-August. Unlike past rallies driven solely by leverage, this surge has been supported by substantial buying pressure: US spot ETFs recorded their strongest weekly inflow of the year, Bitcoin continued to see net outflows from exchanges, and all wallet size groups on-chain showed synchronized accumulation. The key to whether the rally can extend to the January highs now depends on whether the $81,000 to $86,000 supply concentration zone can be decisively breached.

The Liquidation Storm: The Largest Short Squeeze in History Ignites the Rally

Record Daily Short Liquidations

In US dollar terms, August 19, 2026, saw the largest single-day short liquidation on record since data became available in 2019. During the entire squeeze window, short liquidations accounted for 85% of total liquidations. It should be noted that our data covers major centralized exchanges but excludes Hyperliquid, so the actual total liquidation value is higher than our statistics.

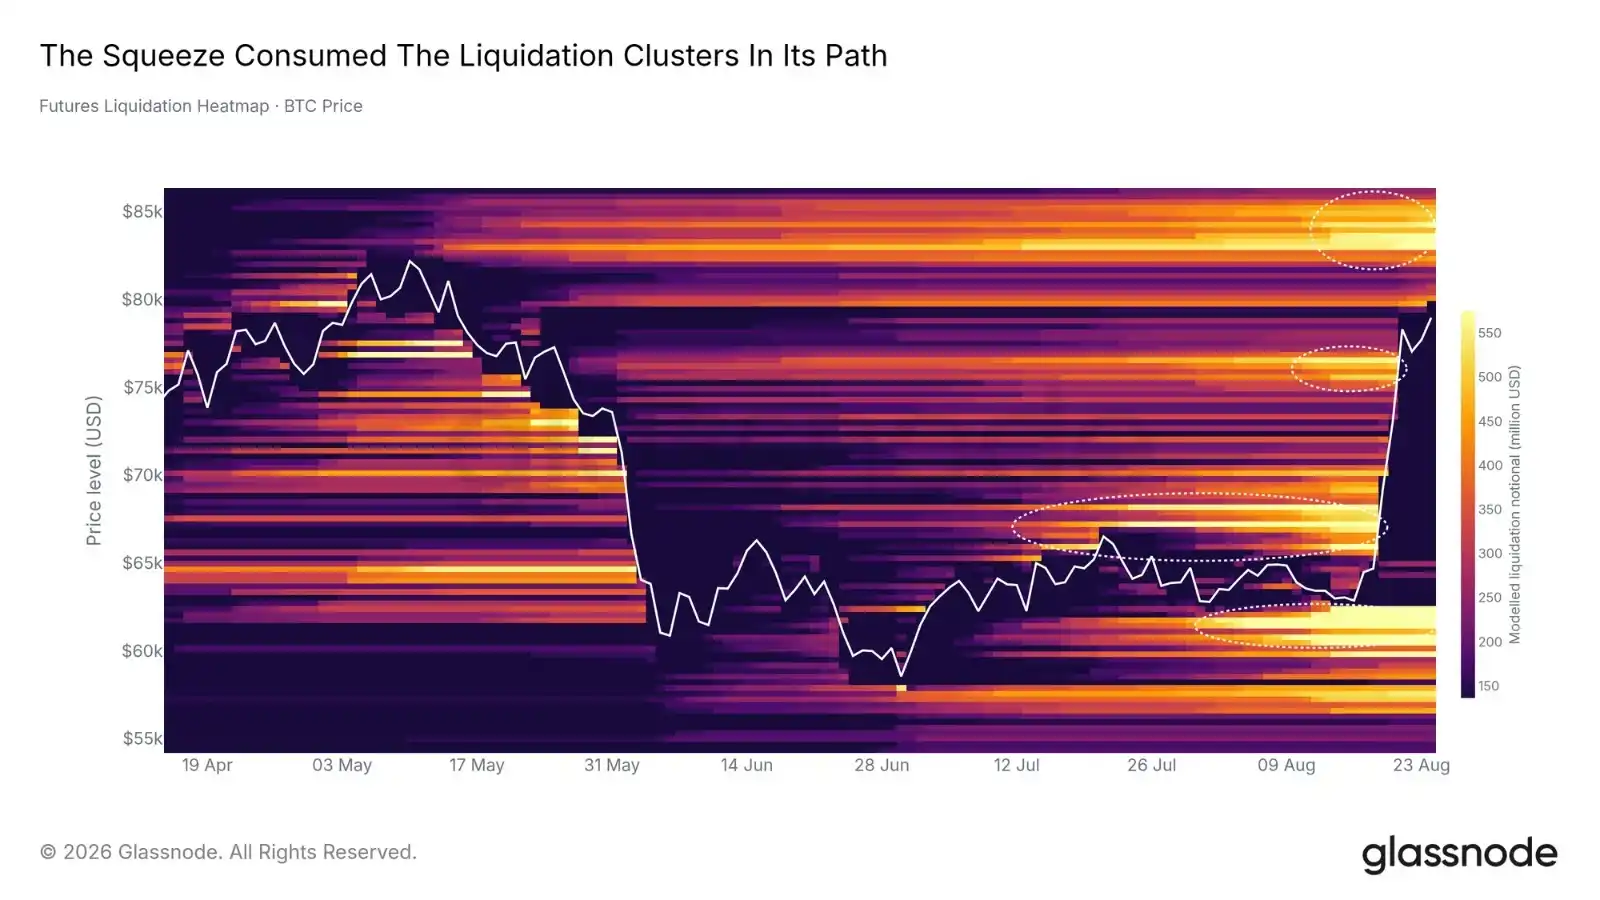
The liquidation heatmap clearly shows how price action consumed this "fuel." During the rebound, simulated liquidation clusters along the price path were triggered one by one, with approximately 86% of the liquidation positions digested along the way. The remainder is distributed at both ends: dense short liquidation orders cluster in the $82,000-$86,000 range above, while residual long liquidation positions remain in the $60,500-$62,400 region below.
Significant Deleveraging

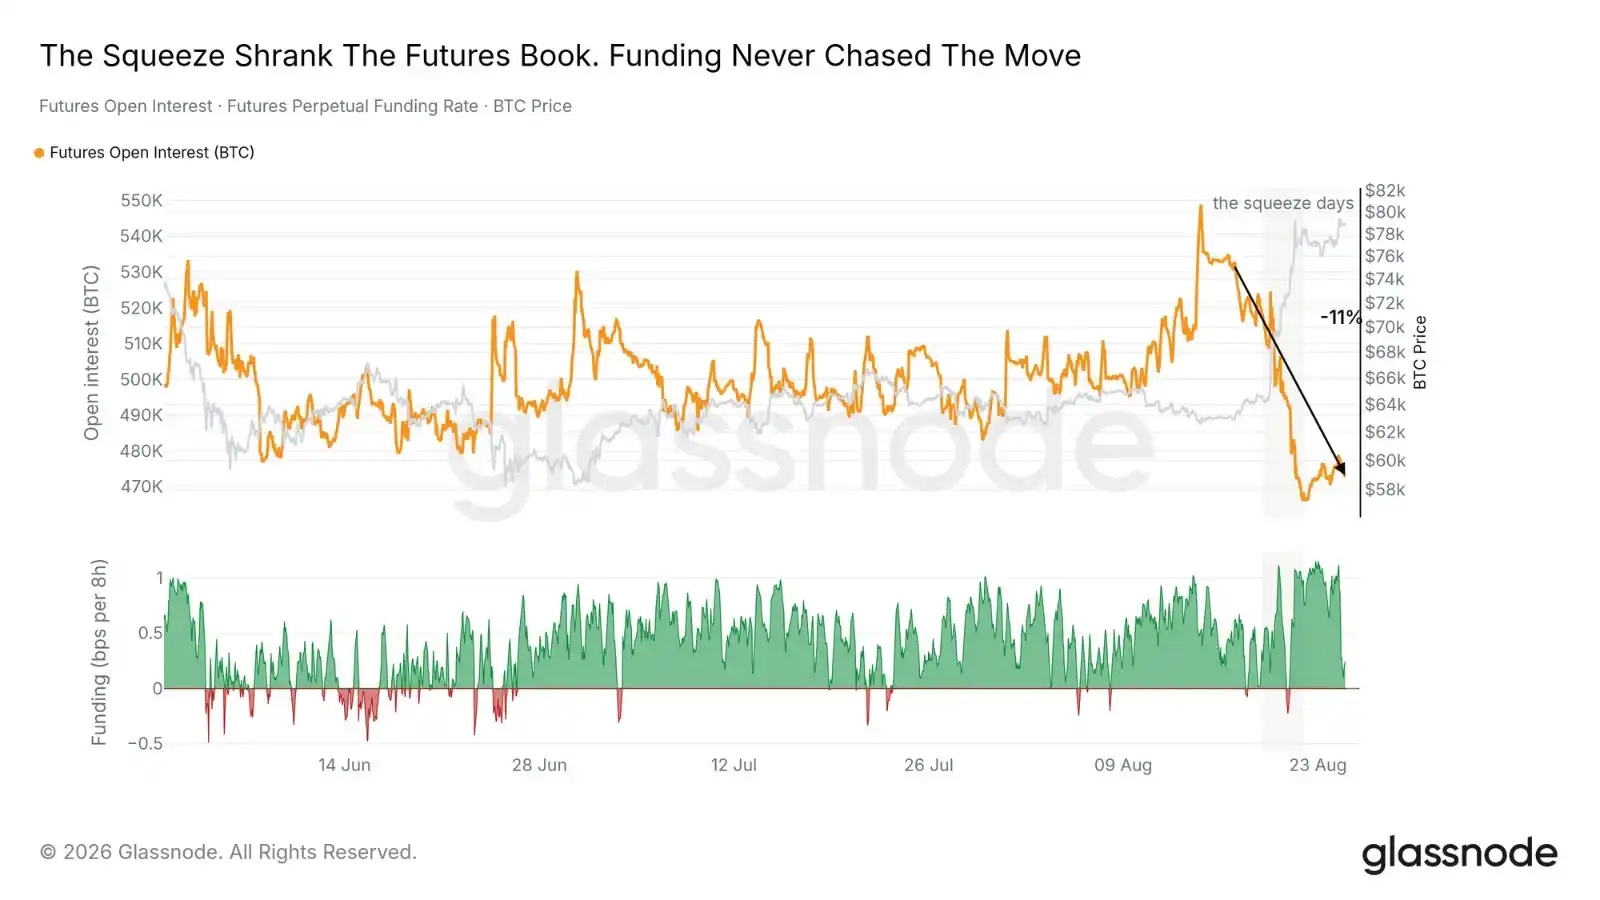
This squeeze effectively cleared leverage from the market it traversed. Measured in Bitcoin terms, futures open interest contracted by 11% during the window—the expansion in USD nominal size was entirely due to price appreciation. This means that the liquidated short positions were not quickly replaced by new contracts.

Perpetual swap funding rates corroborate this point. Throughout the rally, funding rates largely fluctuated around the neutral baseline, occasionally turning negative. This indicates the rebound was not driven by new longs chasing the price, but rather a concentrated release of stop-loss positions. A renewed expansion in Bitcoin-denominated open interest coupled with rising funding rates would be the first warning sign of renewed leverage inflow.
Capital Flow Validation: Real Money Backs the Rebound

ETF Channel Reactivated

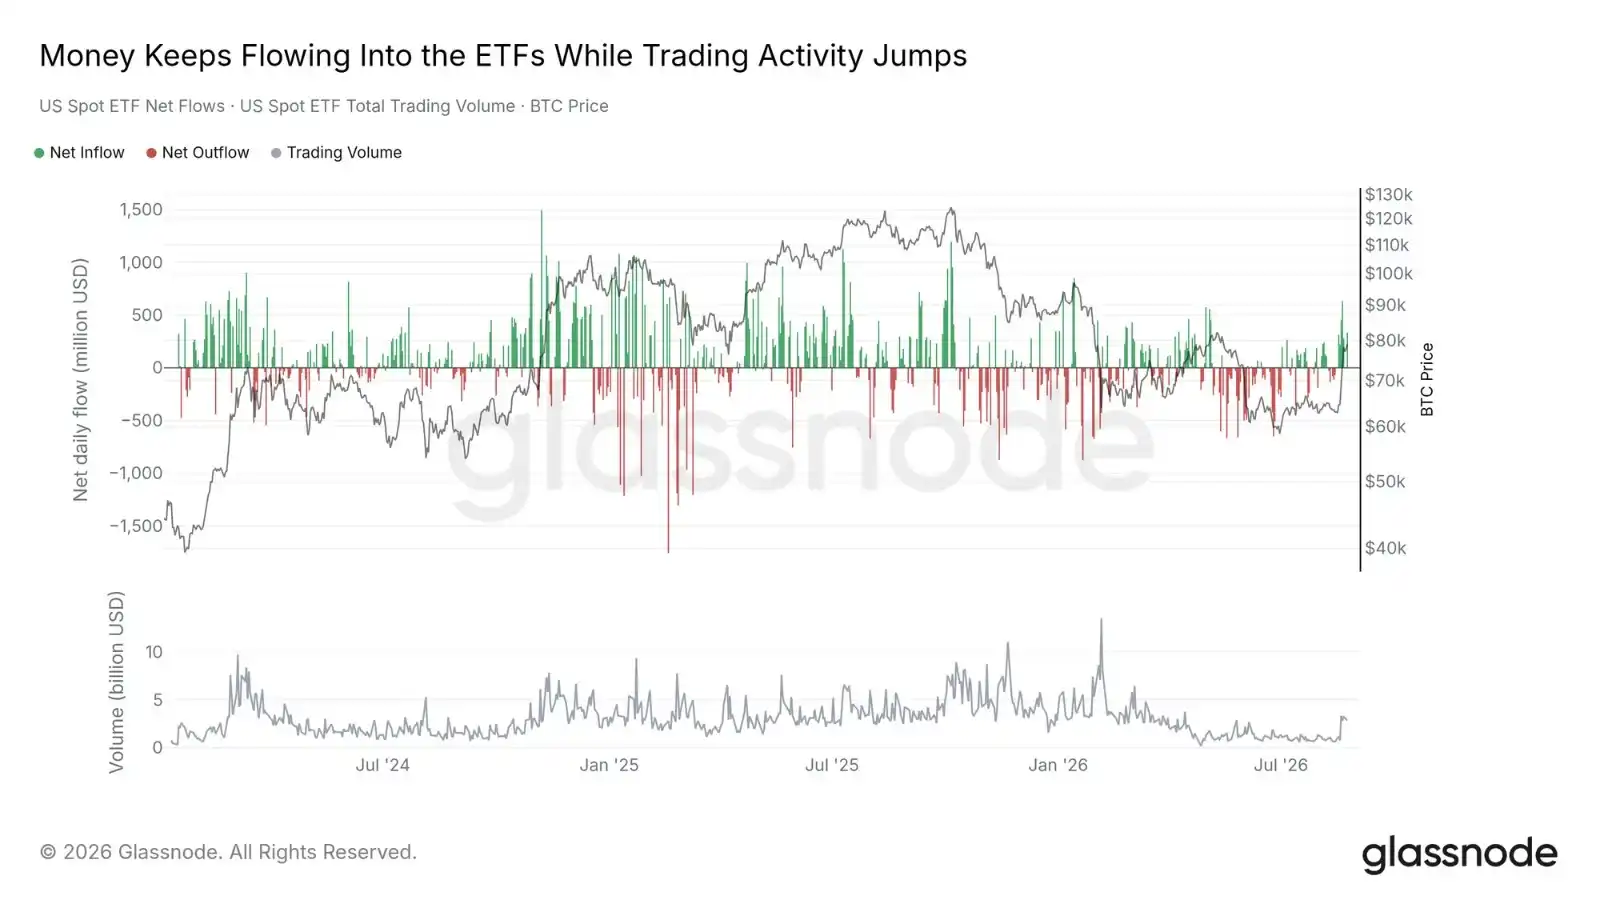
US spot Bitcoin ETFs recorded a net inflow of $2.23 billion during the squeeze window, with no outflow days, marking the strongest weekly inflow of the year. The single-day maximum subscription volume during this period was the highest since January 14, 2026. The price also reclaimed the short-term holder cost basis during the rally.

Trading activity recovered somewhat but remains far from historical peaks: the average daily ETF trading volume during the squeeze week was approximately $2.4 billion, roughly half the level seen during the January-February peak and about one-third lower than August last year.
On-Chain Supply Shifts Up the Size Ladder

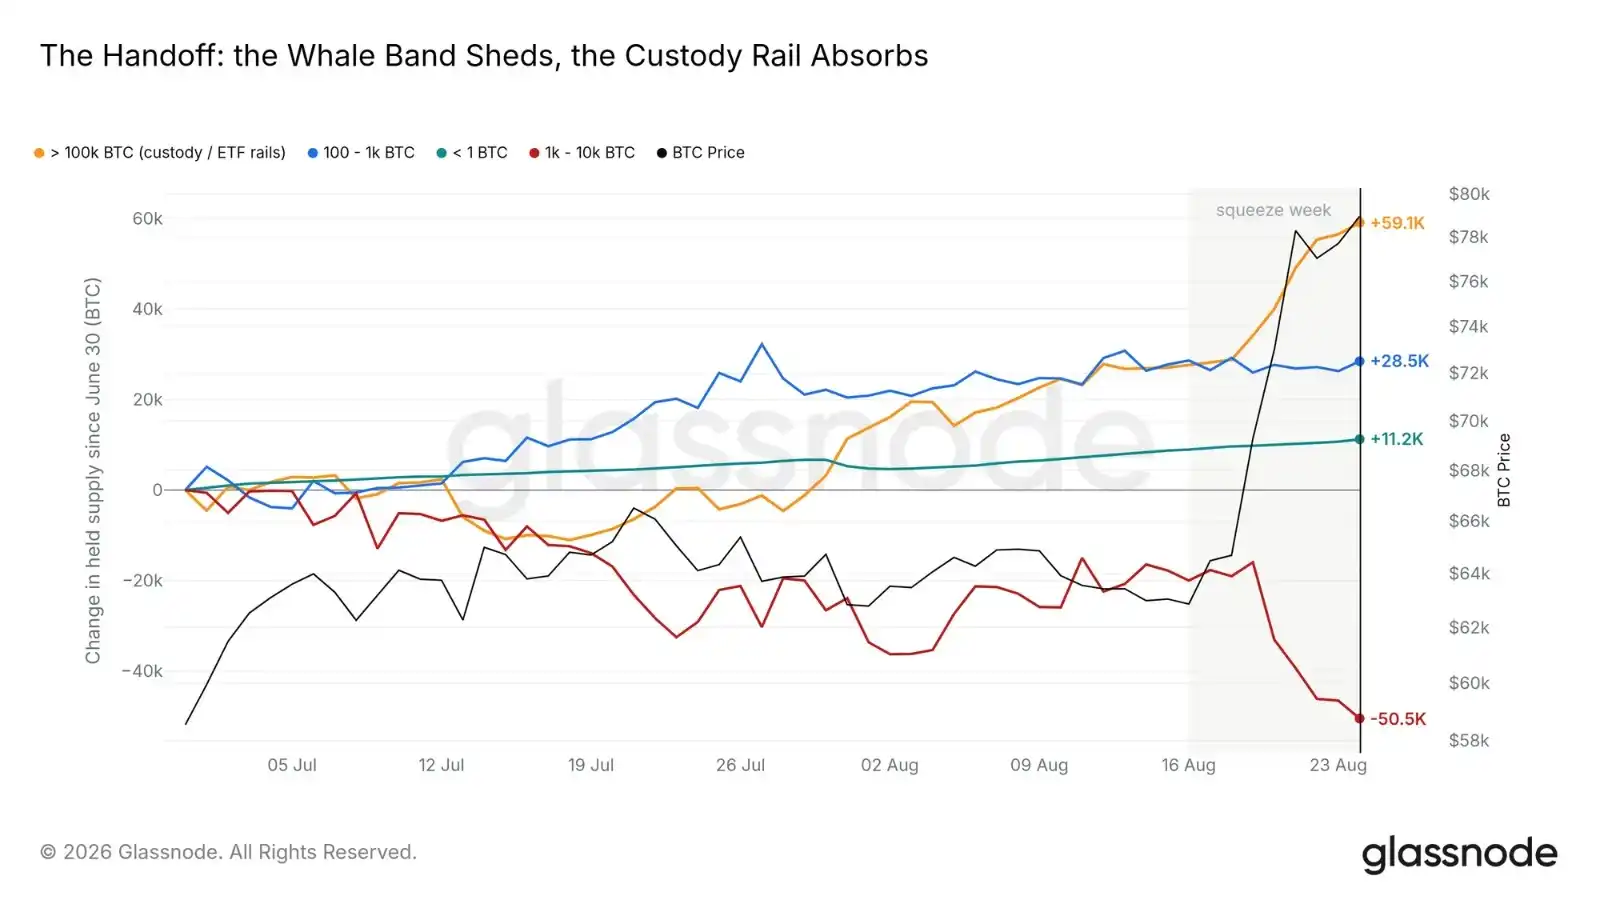
Since the low on June 30, 2026, entities holding 1,000-10,000 BTC have cumulatively reduced their holdings by approximately 50,500 BTC, while the largest group (over 100,000 BTC, primarily consisting of exchanges, custodians, and ETF wrapper products) absorbed about 59,100 BTC in the same period. Capital is shifting up the size ladder from small and medium-sized whales towards large custodial institutions.

This trend intensified during the squeeze week: the custodial group added roughly 31,500 BTC during the window, a magnitude similar to the net ETF purchases for the week (though not a one-to-one correspondence). BTC sold off by pressured whale wallets appeared in institutional custodial channels at a comparable scale.
Synchronous Accumulation Across All Market Groups

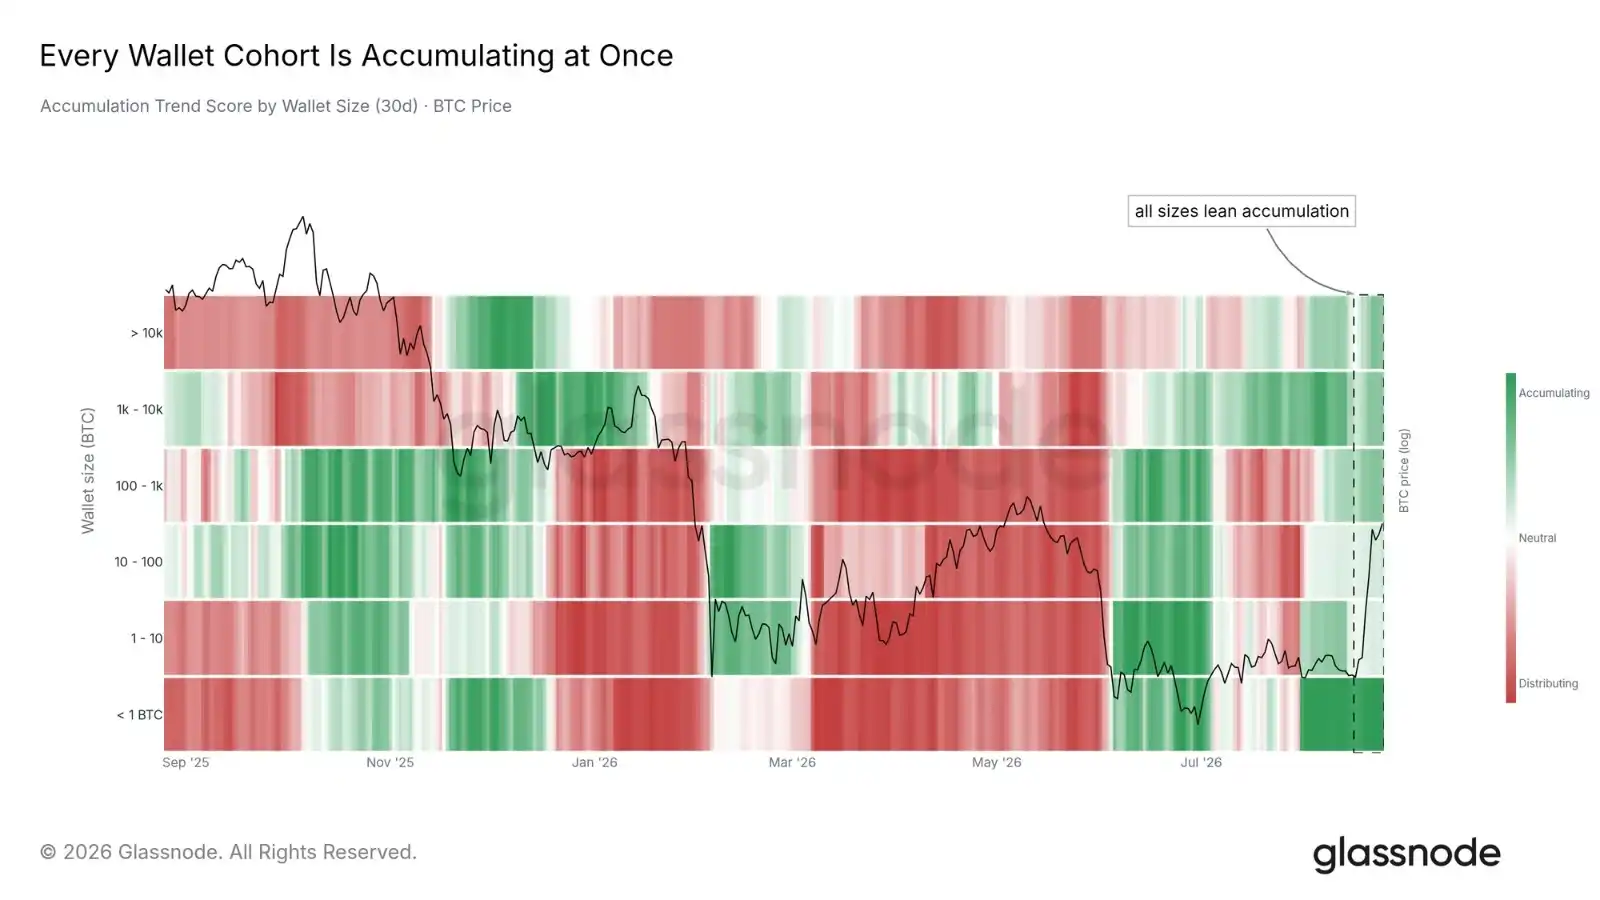
The breadth of buying activity confirms the authenticity of the capital inflow. The 30-day Accumulation Trend Score shows all six wallet size groups at or above the neutral threshold of 0.5. This state has persisted for 20 days since August 5, marking the longest period of synchronized accumulation across all groups since the 22-day record in late 2024.

The squeeze day was primarily driven by large wallet accumulation, while smaller groups had been gradually accumulating throughout August. If any group's score falls back below 0.5, it would be the first sign of a crack in market breadth, indicating that the buying supporting this rebound is narrowing.
Rally Structure: Cycle Positioning and Cross-Asset Performance

Cycle Indicators Exit Cooling Zone

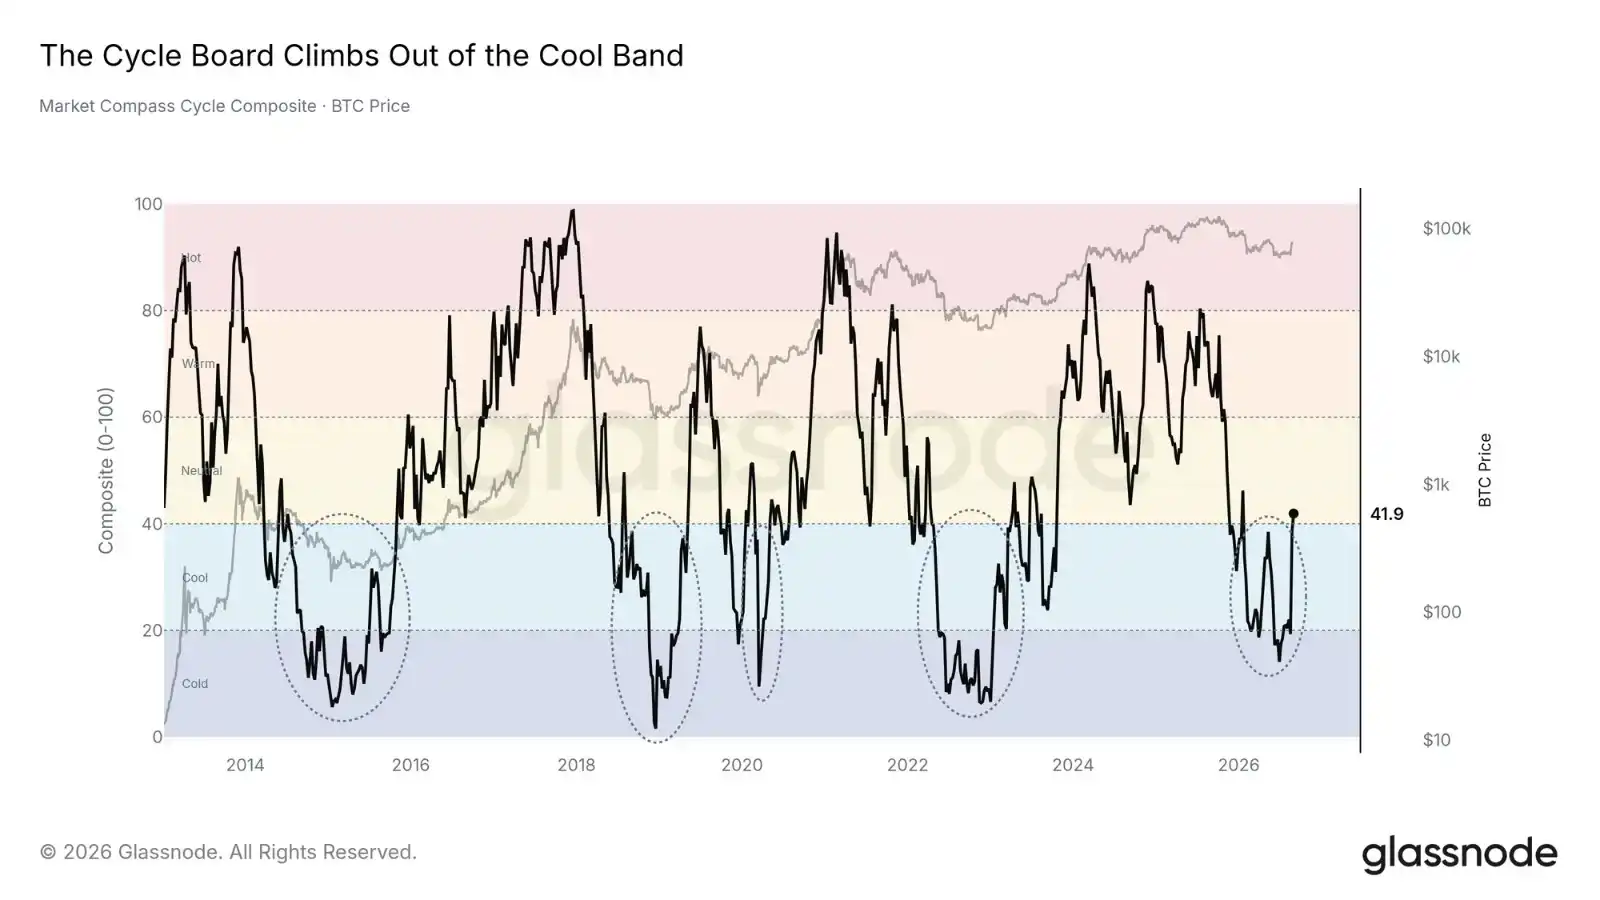
The Cycle Composite indicator (median of 45 on-chain cycle metrics) has rebounded to the neutral boundary of 40, after lingering in the "Cold" to "Cool" zones for seven months.

The five circular markers on the chart denote historically similar prolonged periods of low readings: 2014-2015, 2018-2019, 2020, 2022-2023, and the current cycle. Each corresponded to a low region within its respective cycle. This indicator does not predict the speed of the rebound but positions the current market in the early stages of the cycle, far from the elevated readings typical of prior peaks.
Rally Structure Shows "Top-Heavy" Characteristics

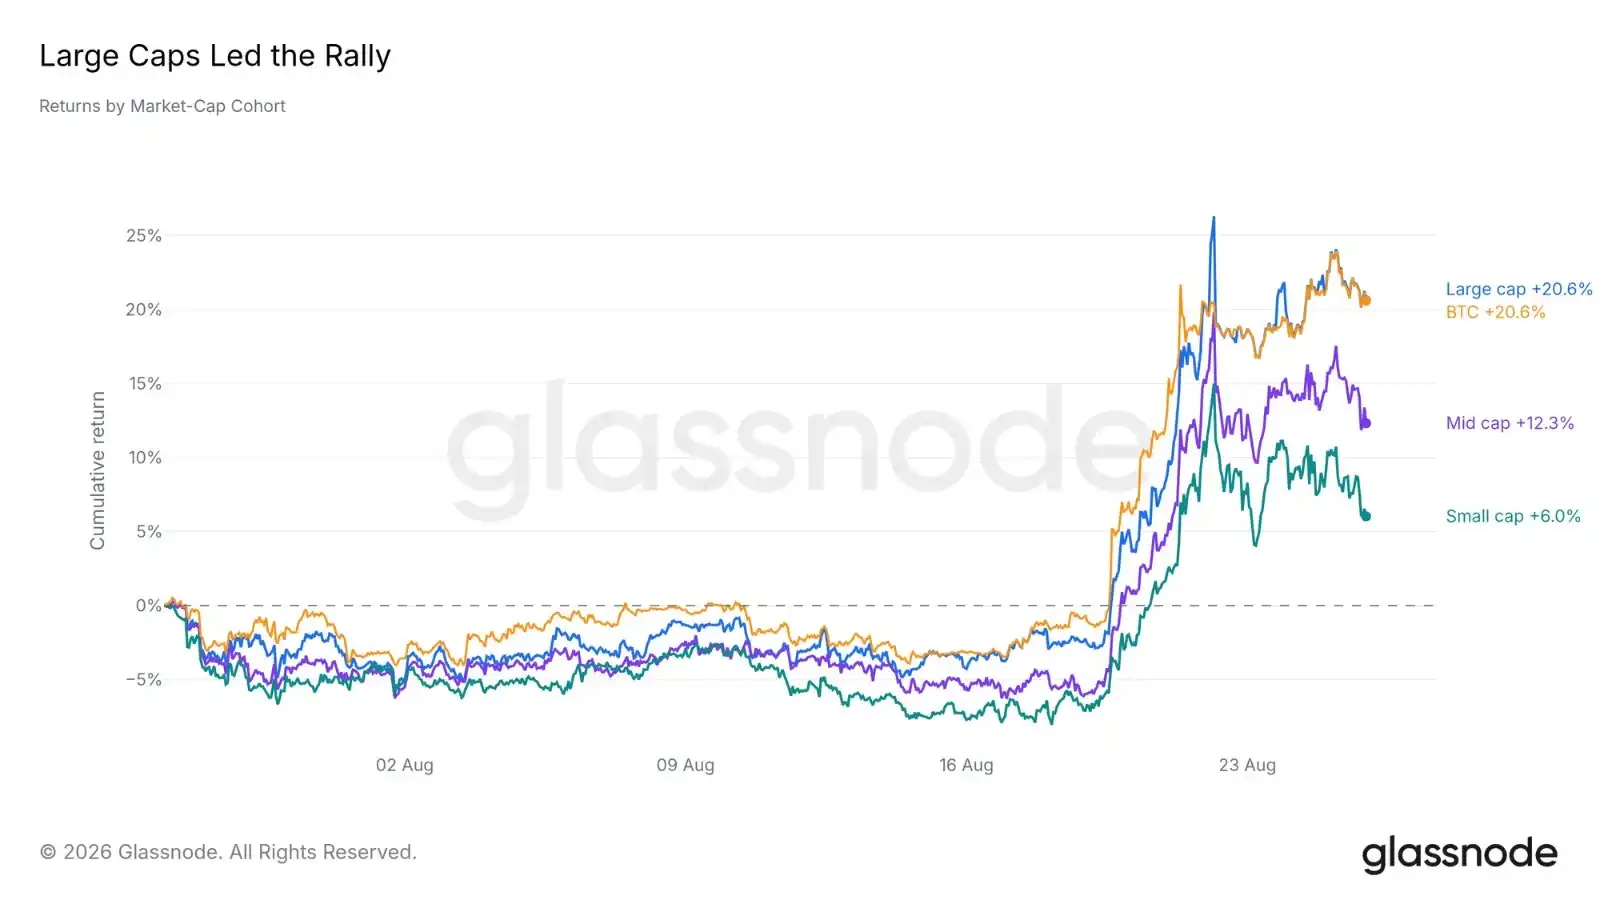
From a cross-asset perspective, the breadth of the rally is narrow. Over the past month, the average return for large-cap altcoins is approximately 20.6%, roughly in line with Bitcoin; while small-cap altcoins gained only about 6.0%. The smaller the market cap, the less capital inflow it received.

This is a typical structure for early-stage rallies—the most liquid assets are allocated first. If mid- and small-cap groups can catch up later, the rally will broaden. Until then, this remains a market led by large-cap assets, with Bitcoin at the forefront.
Significant Decoupling from US Stocks

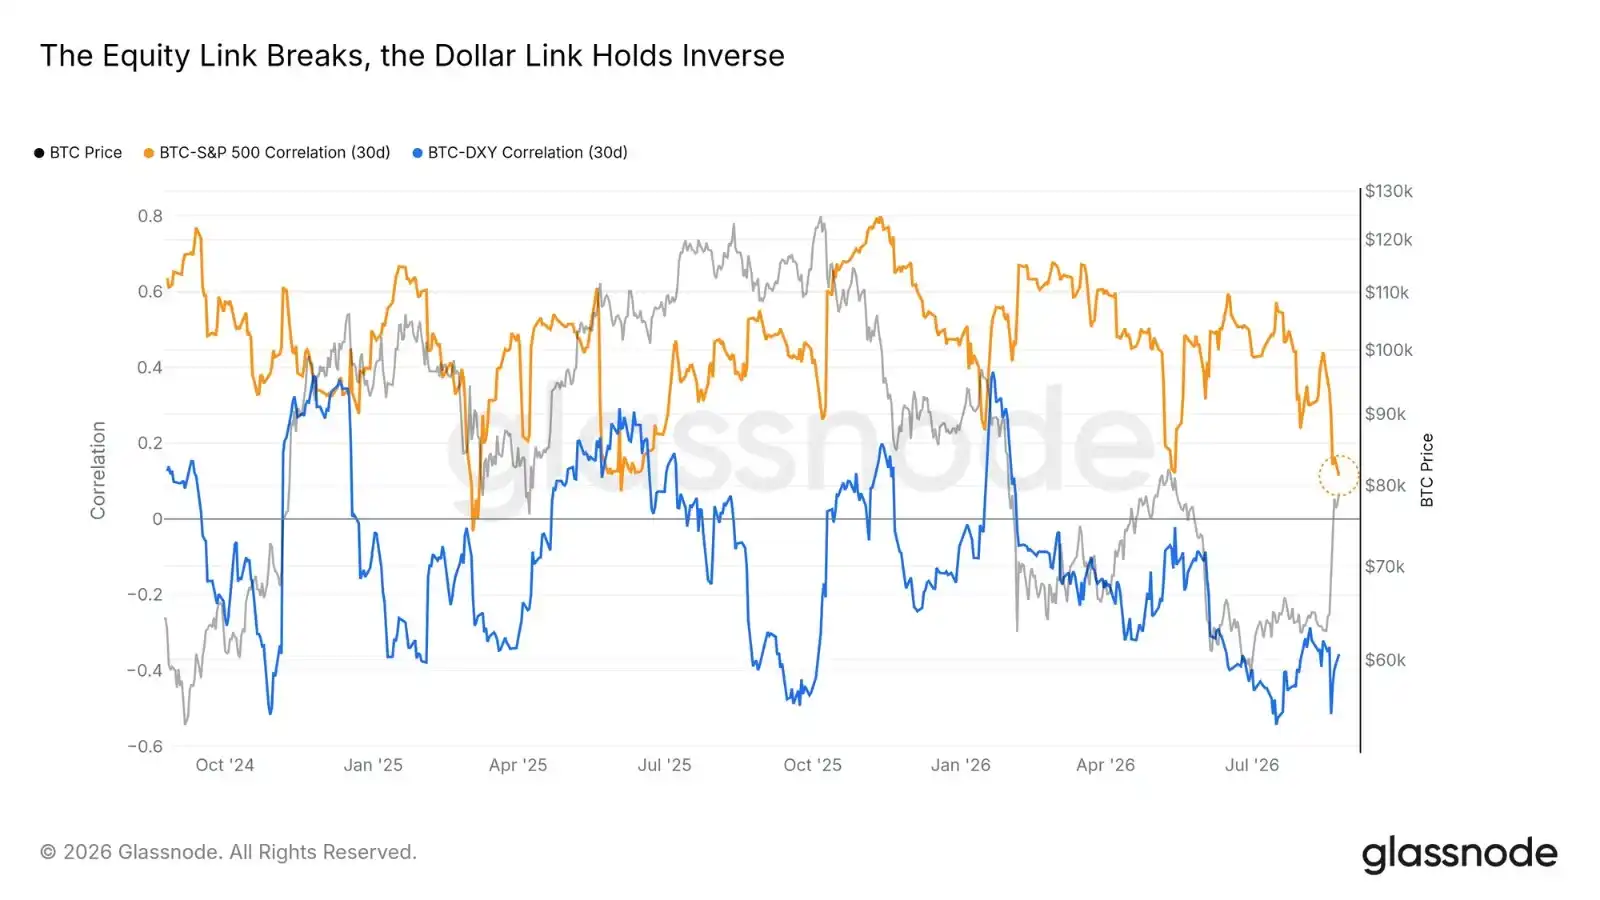
This rally diverged from macro trends. During the squeeze window, Bitcoin rose about 25%, while the S&P 500 fell 1.7%. Their one-month rolling return correlation plunged to near zero. The negative correlation with the US dollar remained firm.

Similar rapid decouplings in 2025 reverted to the mean within weeks on two occasions, so a structural shift cannot yet be declared—the quarterly window correlation has also only just begun to trend downward. However, a rally completed against a backdrop of stock market weakness is clearly not a "stock beta" move; its true driver is capital inflow specific to the crypto market.
Overhead Resistance: $81,000 - $86,000 Supply Concentration Zone

Cost Basis: Floor and Ceiling

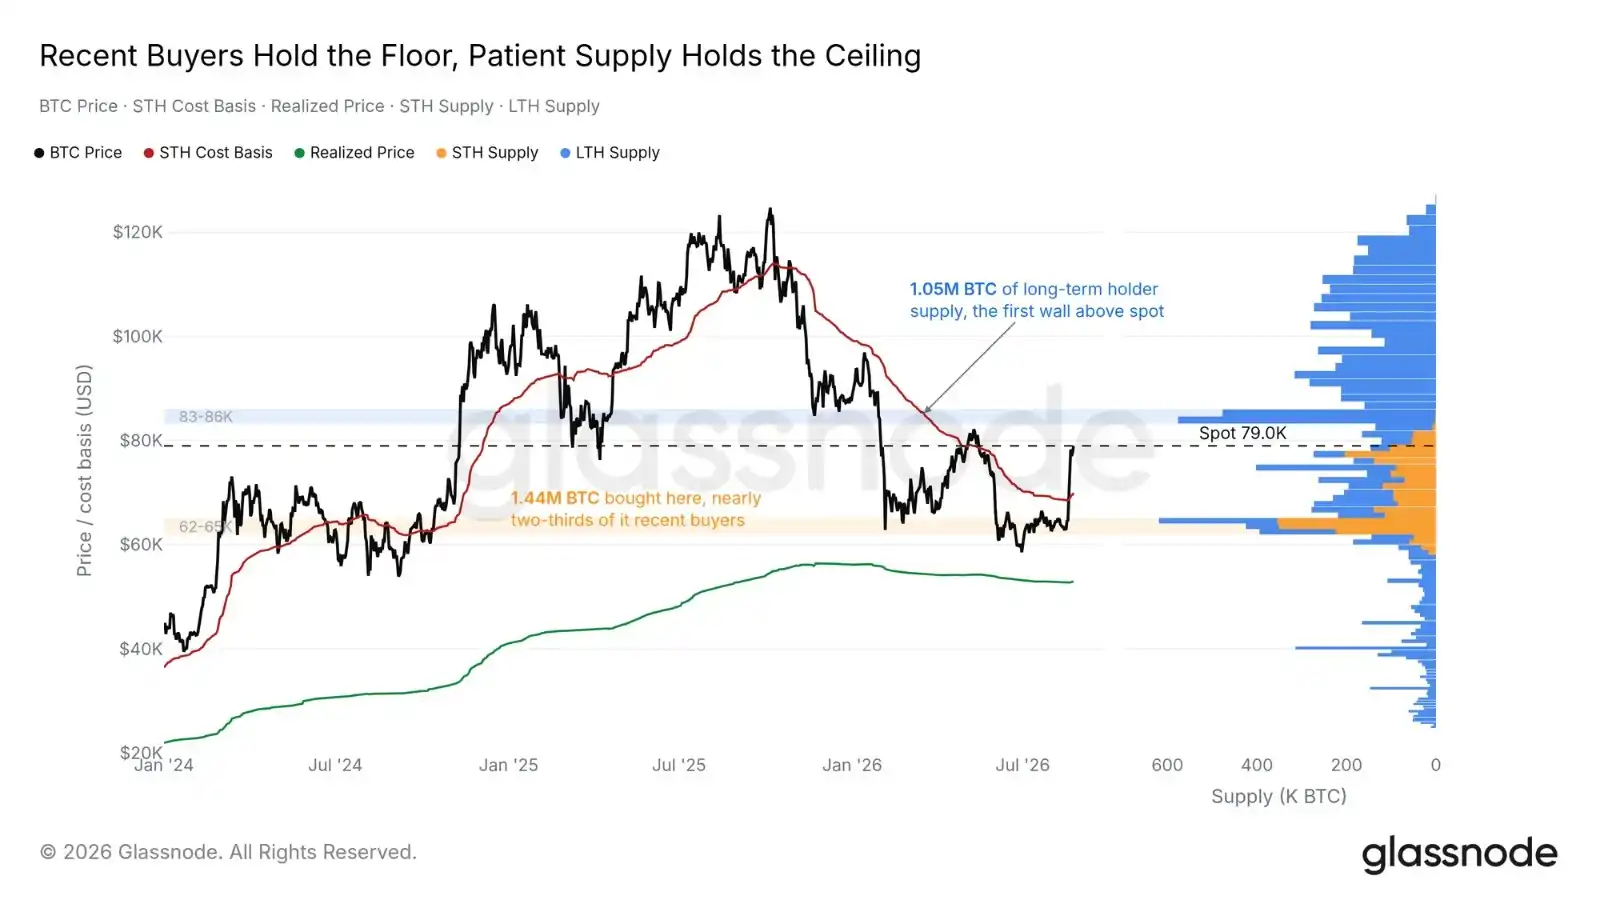
On-chain cost distribution has sandwiched the price. Below, buyers who entered at the June to August bottom hold the $62,000-$65,000 range, nearly two-thirds of whom are short-term holders—recent buyers inclined to defend their cost basis. Above, the first major supply structure lies at $83,000-$86,000, almost entirely composed of long-term holders who experienced the full drawdown.

The current spot price resides in the gap. The short-term holder cost basis has recovered to around $70,000 (below the price). A move towards $83,000-$86,000 will test whether long-term holders choose to sell near their breakeven point.
Sell-Side Orders Re-cluster Above

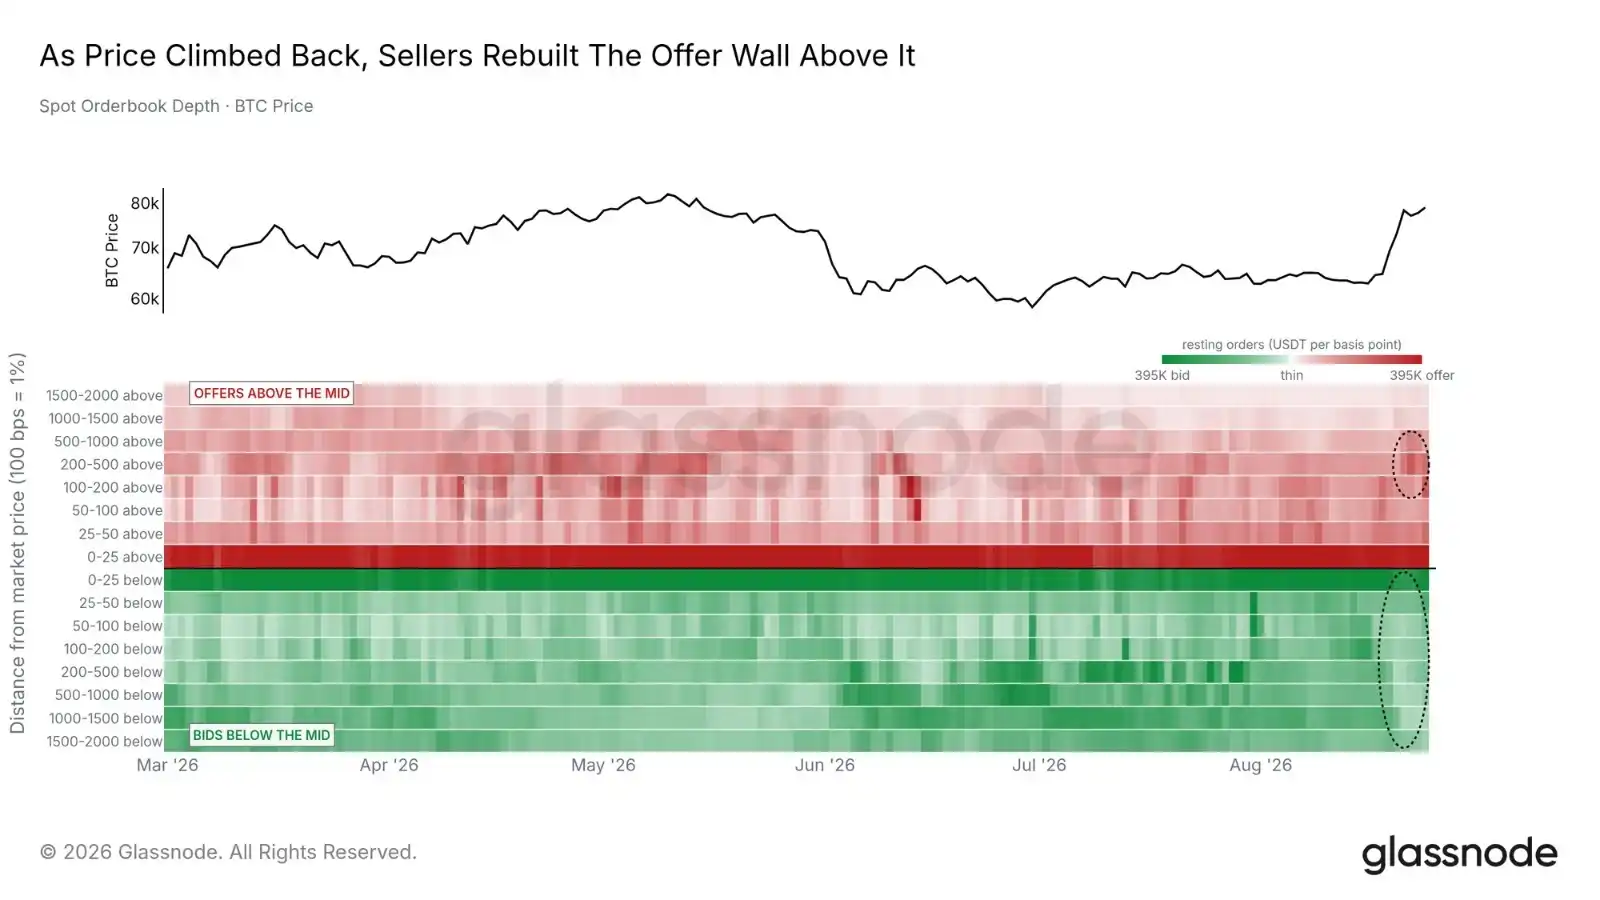
As the price rose, sell orders reappeared on the order book above. Static sell orders in the +100 to +1000 basis point range from the mid-price grew by approximately 41% in the final five days of the window; meanwhile, visible buy orders across the entire order book thinned by about 32% in the last seven days. Static orders can be canceled instantly, so the order book reflects areas where sellers are willing to offer—currently, they are inclined to place sell orders above.

The re-clustered sell orders point to the same zone as multiple independent indicators: the first self-custodied cost basis plateau begins at $80,800; market maker gamma turns negative at $82,300; existing liquidation orders extend to $86,000; and the patient supply wall fills the $83,000-$86,000 range. All the overhead structures we track currently concentrate between $81,000 and $86,000—this is the real test for the rally's sustainability.
Options Market Pricing: Steady Expectations

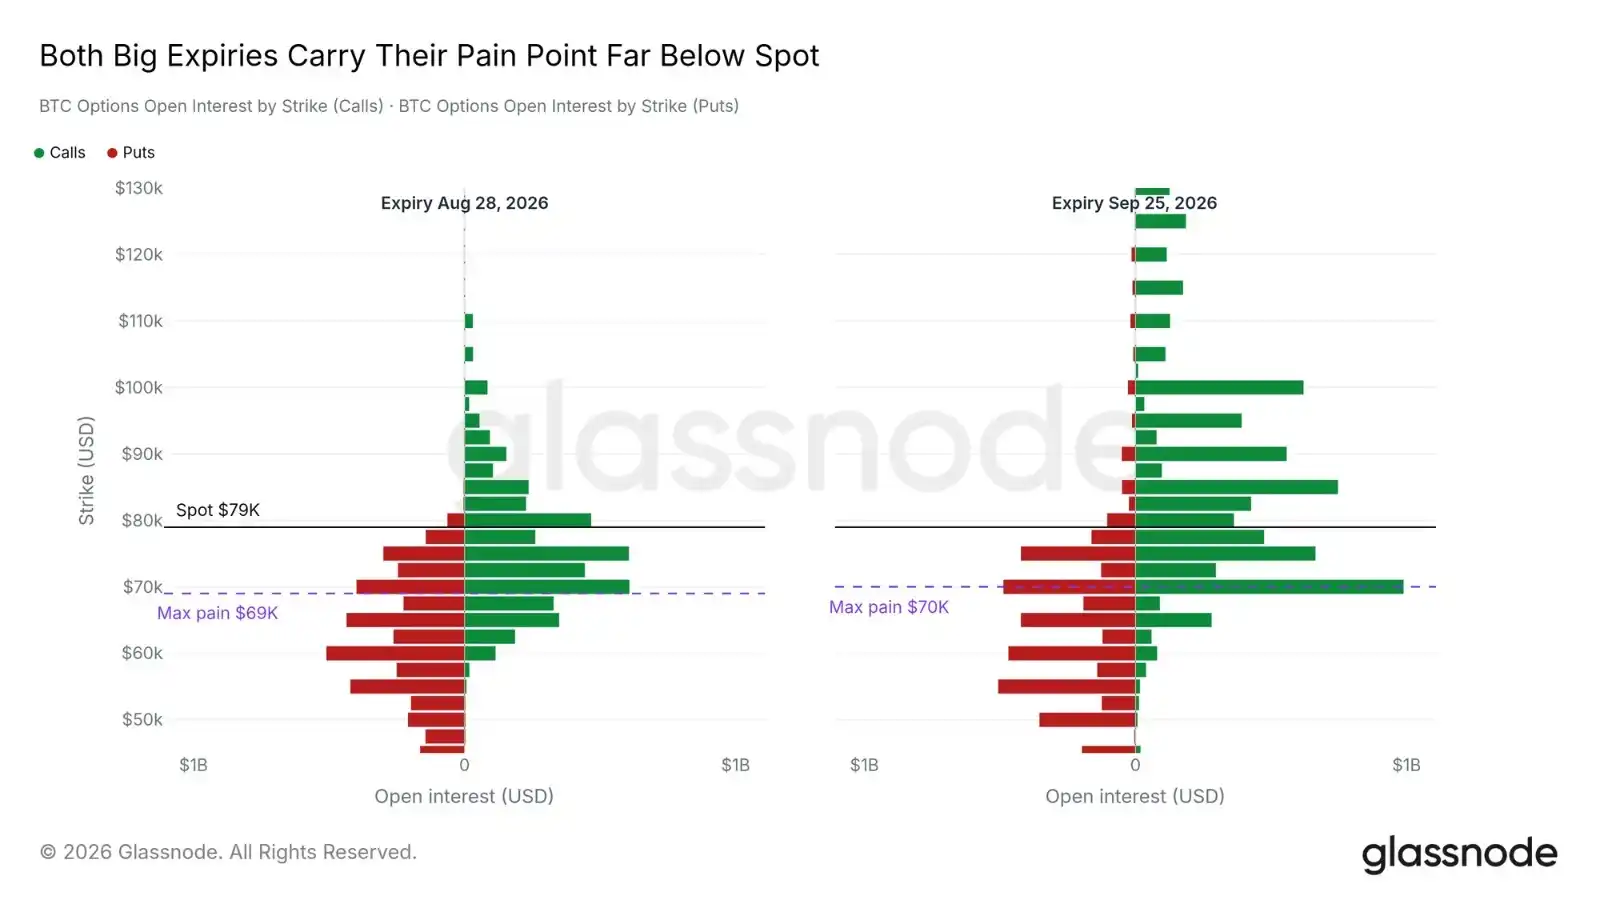
The options market suggests patient expectations. The two most concentrated upcoming expiries—this Friday with approximately $10.4 billion notional value, and the September quarterly expiry with about $13.7 billion—both have max pain levels significantly below the spot price. Max pain (the strike price where the maximum number of options expire worthless) is at $69,000 and $70,000 respectively, with spot around $79,000. Below are dense put option clusters; above are call option order zones.

Forward distributions have flattened. For the expiry up to September 25, 2026, roughly 70% of strike prices imply outcomes within the $69,000 to $89,700 range, with the median only a few hundred dollars above spot. The options market's baseline scenario is for steady consolidation within the current supply wall: it neither expects a break above the $86,000 zone nor a return to the floor below.
Conclusion

The largest short liquidation on record in our data source initiated this rebound; sustained ETF inflows, active on-chain buying, and net exchange outflows provided the capital needed for continuation; and cycle indicators still place the market in early stages. This is a classic profile of a cyclical rebound.

Confirmation will come from above: a decisive close above $83,300, coupled with sustained ETF inflows, would indicate the supply wall is being digested, not respected. Signs of weakness would first appear with a loss of the $70,000 short-term holder cost basis, followed by the $62,000-$65,000 floor zone defended by recent buyers. A return to the $62,900 squeeze starting point would completely erase the entire move.


Trending Cryptos

Related Questions

QAccording to the article, what were the main drivers behind the recent 26% Bitcoin price rally?

AThe rally was primarily triggered by a record-setting, large-scale short squeeze (massive single-day short liquidations). Crucially, this price move was backed by substantial buy-side pressure, including the largest single-week net inflows into US spot Bitcoin ETFs in the year, consistent net outflows from exchanges, and synchronized accumulation by all wallet size cohorts on-chain.

QWhat is the key resistance zone for Bitcoin mentioned in the report, and what factors define it?

AThe key resistance zone is between $81,000 and $86,000, identified as a 'supply wall' or 'supply-dense region'. It is defined by several converging factors: the cost basis of long-term holders who bought during the previous decline, a cluster of existing short liquidation orders, a significant build-up of static sell orders on exchanges, and a self-custody cost basis plateau starting at $80.8k.

QWhat does the article suggest about the health of the current rally based on the behavior of different investor groups?

AThe article suggests the rally is healthy as it shows broad-based buying. The 30-day Accumulation Trend Score indicates that all six wallet size cohorts have been accumulating or holding (scoring at or above 0.5) for an extended period. This 'synchronous accumulation' across large and small investors signals genuine demand and provides a strong underlying support for the price increase.

QHow did the market's leverage levels and the nature of the price move change during the squeeze, as described in the report?

AThe squeeze effectively reduced market leverage. While the dollar-denominated futures open interest increased due to the higher price, the bitcoin-denominated open interest contracted by 11%. Crucially, funding rates remained neutral or even negative, indicating the rally was not primarily driven by new speculative long positions chasing the price, but rather by the passive covering of short positions being liquidated.

QAccording to the Glassnode report, what are the key confirmation and weakness signals for the market's direction going forward?

AThe key confirmation signal is a sustained close above approximately $83.3k, coupled with continued ETF inflows, suggesting the upper supply wall is being absorbed. The primary weakness signals would be a break below the $70k short-term holder cost basis, followed by a test of the $62k-$65k support floor established by recent buyers. A return to the squeeze starting point of $62.9k would negate the entire rally.

Related Reads

Unstoppable Domains Abandons Plans to Integrate .crypto and .bitcoin into DNS

Unstoppable Domains has abandoned its plans to integrate nine of its Web3 domain extensions, including .crypto and .bitcoin, into the traditional DNS system. The company cited ICANN requirements and the high costs of the application program as reasons for the decision. Other affected domains are .wallet, .polygon, .nft, .dao, .unstoppable, .zil, and .blockchain. They will continue to function as on-chain domains but will not become native DNS zones. The applications for the nine domains would have cost over $2 million, not including additional compliance expenses and potential auctions. Founder Matthew Gould stated the total costs outweighed expected revenues. A major obstacle was ICANN's proposed integration rules, which would require registering every existing on-chain domain in a unified zone and disclosing owner data—affecting over 4 million domains, many purchased as one-time, anonymous assets. In response to user criticism, the company is offering refunds for domains purchased after its public ICANN announcement dates, with the refund window open from August 25 to September 25. Unstoppable Domains clarified that the domains retain all their on-chain functionalities. The company is still proceeding with ICANN applications for five other domain extensions: .agi, .robot, .gram, .hub, and .xmr, developed with partners like 0G, Telegram, Monero, and Hub Culture. The first approved domains from the current ICANN round are expected by mid-2027, with a full DNS launch anticipated in late 2027 or 2028.

cryptonews.ru39m ago

Unstoppable Domains Abandons Plans to Integrate .crypto and .bitcoin into DNS

cryptonews.ru39m ago

Trading

Spot

Hot Articles

What is $BITCOIN

DIGITAL GOLD ($BITCOIN): A Comprehensive Analysis Introduction to DIGITAL GOLD ($BITCOIN) DIGITAL GOLD ($BITCOIN) is a blockchain-based project operating on the Solana network, which aims to combine the characteristics of traditional precious metals with the innovation of decentralized technologies. While it shares a name with Bitcoin, often referred to as “digital gold” due to its perception as a store of value, DIGITAL GOLD is a separate token designed to create a unique ecosystem within the Web3 landscape. Its goal is to position itself as a viable alternative digital asset, although specifics regarding its applications and functionalities are still developing. What is DIGITAL GOLD ($BITCOIN)? DIGITAL GOLD ($BITCOIN) is a cryptocurrency token explicitly designed for use on the Solana blockchain. In contrast to Bitcoin, which provides a widely recognized value storage role, this token appears to focus on broader applications and characteristics. Notable aspects include: Blockchain Infrastructure: The token is built on the Solana blockchain, known for its capacity to handle high-speed and low-cost transactions. Supply Dynamics: DIGITAL GOLD has a maximum supply capped at 100 quadrillion tokens (100P $BITCOIN), although details regarding its circulating supply are currently undisclosed. Utility: While precise functionalities are not explicitly outlined, there are indications that the token could be utilized for various applications, potentially involving decentralized applications (dApps) or asset tokenization strategies. Who is the Creator of DIGITAL GOLD ($BITCOIN)? At present, the identity of the creators and development team behind DIGITAL GOLD ($BITCOIN) remains unknown. This situation is typical among many innovative projects within the blockchain space, particularly those aligning with decentralized finance and meme coin phenomena. While such anonymity may foster a community-driven culture, it intensifies concerns about governance and accountability. Who are the Investors of DIGITAL GOLD ($BITCOIN)? The available information indicates that DIGITAL GOLD ($BITCOIN) does not have any known institutional backers or prominent venture capital investments. The project seems to operate on a peer-to-peer model focused on community support and adoption rather than traditional funding routes. Its activity and liquidity are primarily situated on decentralized exchanges (DEXs), such as PumpSwap, rather than established centralized trading platforms, further highlighting its grassroots approach. How DIGITAL GOLD ($BITCOIN) Works The operational mechanics of DIGITAL GOLD ($BITCOIN) can be elaborated on based on its blockchain design and network attributes: Consensus Mechanism: By leveraging Solana’s unique proof-of-history (PoH) combined with a proof-of-stake (PoS) model, the project ensures efficient transaction validation contributing to the network's high performance. Tokenomics: While specific deflationary mechanisms have not been extensively detailed, the vast maximum token supply implies that it may cater to microtransactions or niche use cases that are still to be defined. Interoperability: There exists the potential for integration with Solana’s broader ecosystem, including various decentralized finance (DeFi) platforms. However, the details regarding specific integrations remain unspecified. Timeline of Key Events Here is a timeline that highlights significant milestones concerning DIGITAL GOLD ($BITCOIN): 2023: The initial deployment of the token occurs on the Solana blockchain, marked by its contract address. 2024: DIGITAL GOLD gains visibility as it becomes available for trading on decentralized exchanges like PumpSwap, allowing users to trade it against SOL. 2025: The project witnesses sporadic trading activity and potential interest in community-led engagements, although no noteworthy partnerships or technical advancements have been documented as of yet. Critical Analysis Strengths Scalability: The underlying Solana infrastructure supports high transaction volumes, which could enhance the utility of $BITCOIN in various transaction scenarios. Accessibility: The potential low trading price per token could attract retail investors, facilitating wider participation due to fractional ownership opportunities. Risks Lack of Transparency: The absence of publicly known backers, developers, or an audit process may yield skepticism regarding the project's sustainability and trustworthiness. Market Volatility: The trading activity is heavily reliant on speculative behavior, which can result in significant price volatility and uncertainty for investors. Conclusion DIGITAL GOLD ($BITCOIN) emerges as an intriguing yet ambiguous project within the rapidly evolving Solana ecosystem. While it attempts to leverage the “digital gold” narrative, its departure from Bitcoin's established role as a store of value underscores the need for a clearer differentiation of its intended utility and governance structure. Future acceptance and adoption will likely depend on addressing the current opacity and defining its operational and economic strategies more explicitly. Note: This report encompasses synthesised information available as of October 2023, and developments may have transpired beyond the research period.

2.3k Total ViewsPublished 2025.05.13Updated 2025.05.13

What is $BITCOIN

Discussions

Welcome to the HTX Community. Here, you can stay informed about the latest platform developments and gain access to professional market insights. Users' opinions on the price of BTC (BTC) are presented below.

活动图片