Ethereum’s (ETH) latest downturn below $2,000 is no longer confined to price charts alone. Capital flows, on-chain data, and technical structure are now aligning with the bearish momentum, supporting concerns that the selloff may have further room to run.
Related Reading: Bitcoin Price May Slide Toward $50,000 By March-April, Top Analyst Warns
As ETH breaks below key support zones, fresh ETF outflows and shifting investor behavior are adding pressure at a time when confidence already looks fragile.
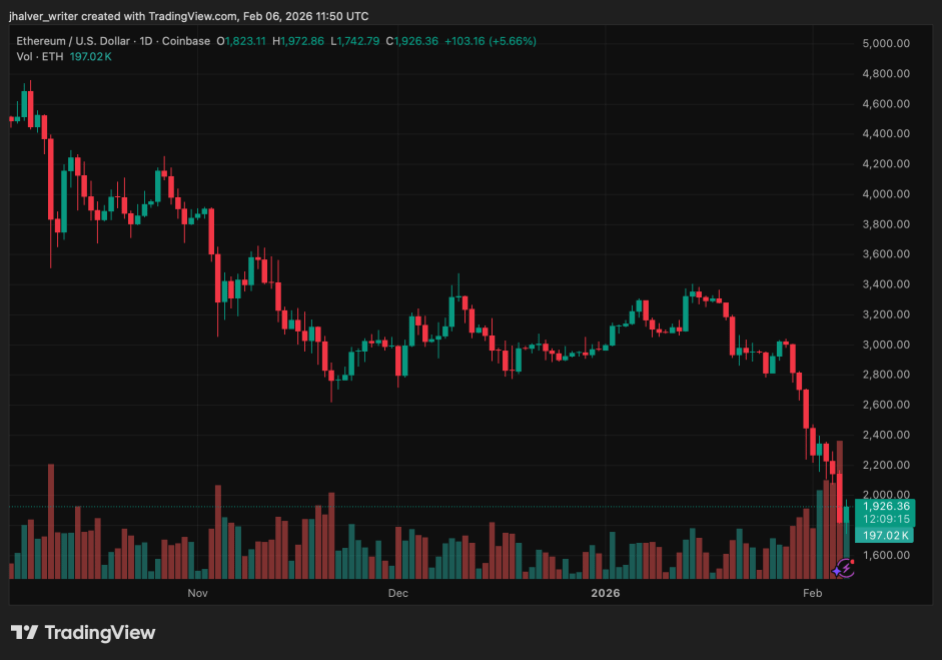
ETH's price trends to the downside on the daily chart. Source: ETHUSD on Tradingview
ETF Outflows Signal Waning Institutional Appetite
Ethereum spot ETFs recorded a net outflow of $80.79 million on February 5, according to SoSoValue data.
Fidelity’s FETH accounted for the bulk of the move, with $55.78 million leaving the fund in a single session. While FETH still holds a cumulative historical inflow of $2.51 billion, the sharp daily withdrawal highlights renewed caution among investors.
Not all products saw exits. Grayscale’s Ethereum Mini Trust (ETH) posted the largest daily inflow at $7.05 million, followed by Invesco’s QETH with $3.53 million. However, these gains were not enough to offset broader selling.
Total Ethereum spot ETF assets now stand at $10.9 billion, representing about 4.83% of ETH’s market capitalization. The uneven flow picture suggests selective positioning rather than broad-based accumulation.
Ethereum Price Structure Weakens as Support Levels Give Way
Ethereum’s price action has continued to trend lower, with ETH recently trading below the $2,000 range after briefly dipping to $1,750 earlier this week. Analysts tracking higher time frames note that the bearish market structure remains intact, with no confirmed bullish shift on the four-hour chart.
Former support around $2,125 has now turned into resistance, while traders are watching liquidity zones near $2,200 and $2,300 for potential reactions. A sustained reclaim above $2,345 is widely viewed as the minimum requirement to signal a trend change.
Until then, rallies are being treated as corrective moves within a broader downtrend.
On-Chain Signals and Developer Concerns Add Context
On-chain data shows a clear divergence between investor cohorts. Mid-sized holders have reduced exposure during the decline, while large wallets have increased their holdings, suggesting accumulation by long-term players amid weakness.
At the same time, exchange inflows, particularly on Binance, have risen to levels last seen in 2022, often associated with distribution or repositioning.
Beyond price, Ethereum’s co-founder Vitalik Buterin has recently criticized the lack of innovation among copycat EVM chains, arguing that scaling progress risks stagnation without deeper technical differentiation.
While these comments are not directly market-related, they support broader concerns about direction and execution within the ecosystem.
Cover image from ChatGPT, ETHUSD chart on Tradingview