Market Analyst Conaldo, Master of Financial Statistics from Columbia University, USA, focused on quantitative trading of US stocks during university and gradually expanded into digital assets such as Bitcoin. He has built a systematic quantitative trading model and risk control system through practical experience; possesses keen data insight into market fluctuations and is committed to continuous深耕 in the professional trading field, pursuing stable returns; will delve into BTC technical, macro, and capital flow changes weekly, review and display practical strategies, and preview noteworthy upcoming events for reference.

Trading Weekly Report Core Summary: Last week's trading strictly followed the established strategy, successfully completed two short-term operations, achieving a cumulative return of 6.93%. The following will detail the market forecast, strategy execution, and specific trading process.
I. Bitcoin Market Review Last Week (12.01~12.07)
1. Review of Last Week's Core Views and Operation Strategies:
In last week's journal, the author clearly stated: Using $89,000 as the bull-bear dividing line for研判, and formulated corresponding operation strategies accordingly. The specific content review is as follows:
1. Market Trend Prediction Review: Regarded $89,000 as the short-term key watershed. If it can provide effective support, the price is expected to rebound upwards; if it is effectively broken below, it will initiate a downward探底.
Core Resistance Levels:
- First Resistance Zone: $94,000~$96,500
- Second Resistance Zone: $98,500~$100,000
Core Support Levels:
- First Support Level: Near $89,000
- Second Support Level: $85,500~$88,000 area
- Important Support Level: Near $80,500
2. Operation Strategy Review:
- Mid-term Strategy: Maintain about 65% mid-term short position.
- Short-term Strategy: All short-term operations are based on the final decision of the gain or loss of $89,000, and two sets of plans were formulated:
- Plan A: If the $89,000 support is effective, when the price rebounds to the $94,000-$96,500 interval and shows resistance signals, initially establish a 10% short position, stop loss set above $100,000. If the rebound continues to near $98,500 and encounters resistance again, add an additional 20% short position, unified stop loss above $100,000.
- Plan B: If the price effectively breaks below $89,000, directly establish a 20% short position, stop loss set near $92,000.
- Unified Closing Rule: When the price runs near the aforementioned important support levels and shows bottom resistance signals,酌情 close part or all of the short-term positions for profit.
2. Last week, two short-term operations were successfully completed as planned (Figure 1), achieving a cumulative return of 6.93%. Specific trading details and review are as follows:
Bitcoin 30-minute K-line Chart: (Momentum Quantitative Model + Spread Trading Model)
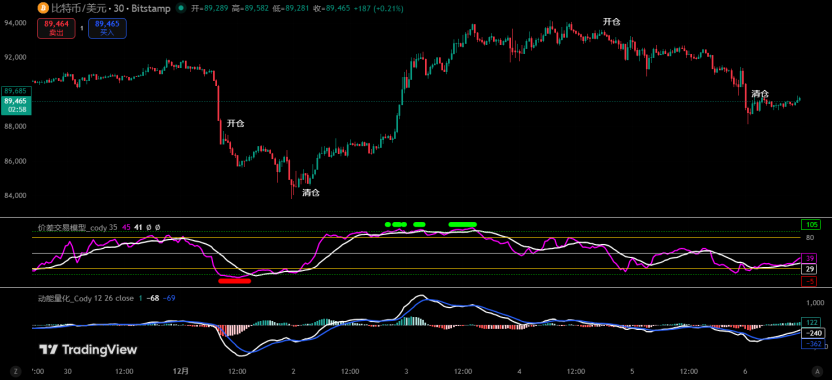
Figure 1
1. Trading Details Summary:

2. First Trade (Profit 2.14%): This operation was a classic execution of Plan B. After the Bitcoin price effectively broke below the key point of $89,000, decisively established a 20% short position at $87,103, and finally took profit near the second support area of $84,989. This operation perfectly reflected the trading discipline of "following the break".
3. Second Trade (Profit 4.44%): This operation was the precise implementation of Plan A. After the price found support at $89,000 and rebounded, patiently waited for it to enter the first resistance zone ($94,000~$96,500). When the price showed a signal at $93,321, established a 10% short position as planned, successfully capturing the subsequent回调 band, and took profit near $89,355.
4. Profit Summary: Last week's strategy execution had a high degree of fit with the market. Both trades strictly followed the preset entry, stop loss, and closing rules, successfully converting market fluctuations into actual profits, with a total profit of 6.93%, verifying the effectiveness of the previous strategy framework.
3. Review of Bitcoin Core Data Last Week:
- Opening Price: $90,369
- Lowest Price: $83,814 (Monday)
- Highest Price: $94,172 (Wednesday)
- Closing Price: $90,405
- Price Change: Weekly increase 0.03%, maximum amplitude 12.36%
- Trading Volume: $13.429 billion
- Trend: Wide-range fluctuation, weekly chart closed with a "cross star" K-line with upper and lower shadows
4. Review of Actual Market Movement Last Week:
Last week, Bitcoin showed a typical "violent wide-range fluctuation" pattern, with a曲折 trend. The week finally closed up 0.03%, forming a "cross star"阳 K-line with upper and lower shadows. Specifically, after opening on Monday, the price quickly dived, effectively breaking through the key support of $89,000,探底 to a low of $83,814 before stabilizing and rebounding, closing down 4.53% for the day. In the following two days, the market上演 a "V"-shaped reversal, with prices continuing to rise, not only recovering all Monday's losses but also once touching the weekly high of $94,172, with a cumulative increase of 8.18% over two trading days. After mid-week, the market weakened again, with prices falling 4.45% cumulatively over two consecutive days before转入 narrow fluctuations until the weekend. It is worth noting that the mid-week high of $94,172高度吻合 with the lower limit of the first resistance zone of $94,000~$96,500 predicted by the author last week,differing by only $172. This再次验证 the accuracy of the previous judgment on key resistance levels.
II. Systematic Technical Analysis: Comprehensive研判 Based on Multi-Model and Multi-Dimensional Analysis
Combining last week's market operation, the author will conduct an in-depth analysis of the evolution of Bitcoin's internal structure using multi-dimensional analysis models.
Weekly Level:
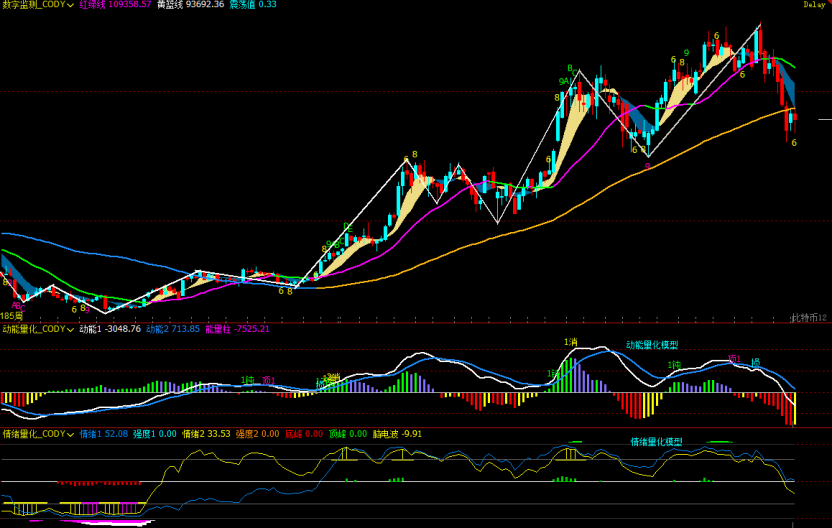
Figure 2
1. As shown in (Figure 2), analysis from the weekly chart:
- Momentum Quantitative Model: After last week's movement, the two momentum lines continue to run downward, with the white momentum line having been below the zero axis for three weeks, and the blue momentum line about to cross below the zero axis. After two consecutive weeks of oversold rebound, the energy (negative) column has begun to shorten compared to previous weeks. The多头 force must now organize a relatively strong counterattack to pull the two momentum lines back above the zero axis, otherwise the空头 will release greater shorting energy.
Momentum Quantitative Model Indicates: Price decline index: High
- Sentiment Quantitative Model: Blue sentiment line value 52.08, intensity zero; yellow sentiment line value 33.53, intensity zero, peak value is 0.
Sentiment Quantitative Model Indicates: Price pressure and support index: Neutral
- Digital Monitoring Model: No digital signals shown currently.
The above data indicates: Bitcoin is in a downward trend, and the weekly level is about to enter a bear market.
Daily Level:
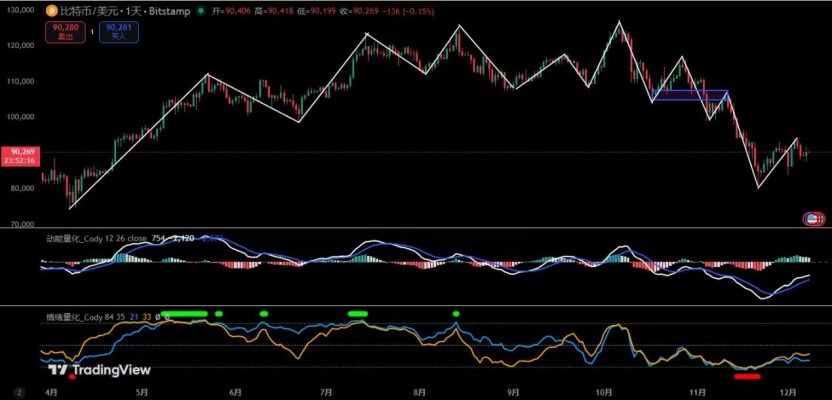
Figure 3
2. As shown in (Figure 3), analysis from the daily chart:
- Momentum Quantitative Model: After a week of rebound, the two momentum lines continue to run upward below the zero axis and are gradually approaching the zero axis, but the energy column is gradually shortening compared to previous days.
Momentum Quantitative Model Indicates: The momentum of the多头 rebound is gradually exhausting.
- Sentiment Quantitative Model: Blue sentiment line 21, intensity zero; yellow sentiment line 32, intensity zero.
Sentiment Quantitative Model Indicates: Pressure and support index: Neutral
The above data suggests: The daily level is in a bear market, an oversold rebound is in progress, but shows signs of weakening.
III. This Week's Market Forecast (12.08~12.14)
1. It is预计 that the price will maintain区间震荡 this week with high probability. The author divides the market into three areas, namely $94200~$91000~$87500~$83500. It is currently fluctuating narrowly within the $91,000~$87,000 range, and the market will choose a direction next.
2. Resistance Levels: First resistance at $91,000, second resistance at the $94,000~$96,500 area, important resistance at the $98,500~$100,000 area.
3. Support Levels: First support at the $85,500~$87,500 area, second support at $83,500, important support near $80,000.
IV. This Week's Operation Strategy (Excluding the Impact of Sudden News)
1. Mid-term Strategy: Maintain about 65% mid-term position (short).
2. Short-term Strategy: Utilize 30% of the position, set stop loss points, and look for "spread" opportunities based on support and resistance levels. (Using 60 minutes/240 minutes as the operation cycle).
3. Based on the high probability of区间震荡 this week, the author formulates the following two sets of plans for short-term operations to cope with market movements.
Plan A: If the market fluctuates upwards at the beginning of the week: (Selling on rebounds)
- Open Position: If the price rebounds to the $91,000~$94,200 area and shows resistance, establish a 15% short position.
- Add Position: If the price continues to rebound to near $98,500 and encounters resistance again, add another 15% short position.
- Risk Control: All short stops are set above $100,000.
- Reduce Position: When the price falls after the rebound ends and shows resistance near the first support level, close 50% of the position.
- Close Position: If the price continues to fall to the second support level area and shows resistance, close all remaining positions to complete the trade.
Plan B: If it effectively breaks below the $87,500 support at the beginning of the week and探底 downwards: (Buying the deep dip for a rebound)
- Open Position: If the price falls to the $83,500~$80,000 area and shows a bottom signal, establish a 15% long position.
- Risk Control: Stop loss set below $80,000.
- Close Position: When the price rebounds to the $87,500~$88,000 area and shows resistance signals, close all positions for profit.
V. Special Notes:
1. When opening a position: Immediately set the initial stop loss.
2. When profit reaches 1%: Move the stop loss to the opening cost price (break-even point) to ensure capital safety.
3. When profit reaches 2%: Move the stop loss to the position of 1% profit.
4. Continuous Tracking: Thereafter, for every additional 1% profit the price makes, move the stop loss同步 by 1%, dynamically protecting and locking in existing profits.
(Note: The above 1% profit trigger threshold can be flexibly adjusted by investors according to their own risk preference and标的 volatility.)
VI. Macro and Capital Flow Analysis (12.8~12.14):
This week is the most critical "Super Central Bank Week" for global financial markets before the end of the year. The core focus is on the December Fed interest rate decision, the update of the dot plot, and Powell's speech. Although the market almost unanimously believes that this meeting will cut interest rates, what really determines risk assets (including Bitcoin) is not the rate cut itself, but the Fed's guidance on the 2025 rate cut path. Therefore, this week's macro and capital structure will revolve around the "expectation gap," and asset price fluctuations are expected to significantly放大.
From a macro perspective, key data is密集 this week: Tuesday's US JOLTs job openings will reveal the extent of the cooling labor market. If it continues to weaken, it will strengthen the logic of提前 rate cuts; Wednesday's Chinese CPI and social financing will determine the direction of Asian demand and liquidity; Friday's UK GDP and European CPI will affect global synchronized easing expectations. However, the importance of these data is significantly weaker than the Fed meeting, and the market整体 enters a state of "waiting for the Fed to give the answer."
The tone of this Fed meeting is almost locked in for a "December rate cut," but the dot plot will determine the market's direction for the next 3~6 months. If the dot plot is hawkish,暗示 only 0~1 rate cuts in 2025, the market will quickly correct current easing expectations, leading to rising US bond yields, a stronger dollar, and short-term pressure on risk assets. BTC may even test the $85,000 area. If the dot plot is dovish,暗示 at least 2 rate cuts in 2025, it means the easing cycle may accelerate提前, risk assets will反弹 quickly, and BTC is expected to challenge above $90,000 again. Powell's speech will also further influence sentiment. Any wording emphasizing "sticky inflation" or "policy仍需保持 restrictive" will amplify short-term fluctuations.
From a capital flow perspective, the current market is整体 in a compressed state with an undetermined direction. BTC failed to effectively stand back above $90,000 over the weekend, but trading volume decreased significantly, indicating筹码换手 is slowing, retail sentiment is stable, and there is no panic selling. Institutional funds generally choose to reduce risk exposure before the "Super Central Bank Week," so there was no significant increase or withdrawal of positions last week, which is typical of the "pre-meeting interest rate window." The macro environment itself has no new negatives. US employment and inflation data continue to weaken,反而 increasing the probability of entering an easing cycle in the medium term. This is also an important reason why BTC can maintain strong fluctuations at high levels.
Overall, the core variable for BTC this week is not sentiment, nor liquidity, but whether the Fed will provide a rate cut path guidance consistent with market expectations. Favorable factors include: a very high probability of a December rate cut,持续 cooling employment and inflation, and the new Fed chairman is likely to be dovish. These factors all support further easing in 2025. Risks are mainly reflected in the dot plot being hawkish, Powell's rhetoric being tight, and a decrease in January rate cut expectations leading to short-term sentiment weakening.
In summary, this week is an important time window for determining the trend of risk assets in 2025. The Fed's dot plot and attitude will directly affect BTC's medium-term trend. Once the guidance is dovish, the market may usher in a year-end反弹; if it is hawkish, there may be a short-term回调, but it does not change the medium-term多头 structure. For BTC, this week's fluctuations are not only short-term price changes but also a repricing of future trends.