Bitcoin Liquidation Shakeout Leaves Traders Watching $66K Resistance And $61K Support

bitcoinistPublished on 2026-06-13Last updated on 2026-06-13

Abstract

Bitcoin's recent volatility triggered a major liquidation event, wiping out roughly $980 million in leveraged positions within 24 hours as price swung from ~$64,100 down to $60,700 and back above $63,000. Traders are now watching key technical levels. Major pivot resistance is identified at $66,247, with reclaimed highs near $64,234 and next resistance at $65,890. Critical support zones lie between $63,127-$63,354, then $62,459, with broader downside targets around $59,150-$60,171. Liquidation heatmaps show significant liquidity clusters above ($63.5K-$66K) and below ($58.5K-$61K) spot price, creating a volatile corridor. The market is in a corrective phase; a clean break above resistance is needed for a bullish shift, while failure to hold low-$63K support risks a move toward lower liquidity zones.

TL;DR

  • Bitcoin’s sharp move from the mid-$64,000 area to near $60,700, followed by a rebound above $63,000, triggered a large leverage reset across crypto markets.
  • CryptoReviewing/status/2065076555949216117′′>CryptoReviewing said total crypto liquidations reached about $980 million in less than 24 hours, with liquidity zones now sitting both above and below spot.
  • Trade Nation’s TradingView analysis places Bitcoin’s key pivot resistance at 66,247, with downside supports at 59,150, 56,900, and 54,920.
  • A separate TradingView idea from virDeStatera points to 64,234 as the swept high to reclaim, with 65,890 as the next key resistance.

Bitcoin traders are watching a tight cluster of liquidation zones and technical levels after a sharp two-way move flushed leverage from both sides of the market.

CryptoReviewing, citing a Coinglass liquidation heatmap, said Bitcoin first dropped from $64,100 to $60,700, liquidating roughly $456 million, before rebounding back above $63,000 and triggering another $524 million in liquidations. The analyst described the combined move as roughly $980 million in crypto liquidations in less than 24 hours.
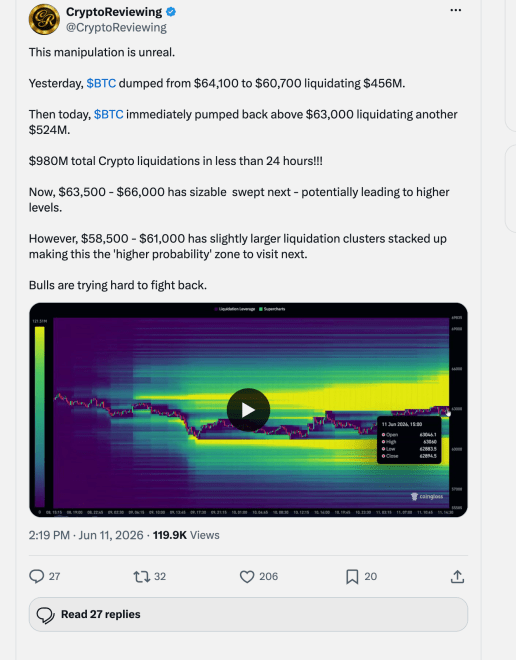
CryptoReviewing highlighted Bitcoin liquidation clusters using Coinglass heatmap data.

The word “manipulation” appeared in the original post, but the cleaner read is that this was a high-leverage market reacting violently around crowded positioning. In that kind of environment, both long and short traders can be forced out quickly as price sweeps liquidity above and below nearby ranges.

Bitcoin Liquidity Zones Sit On Both Sides

The key issue now is where the next liquidity pocket sits. CryptoReviewing pointed to the $63,500 to $66,000 region as a sizable upside zone, while also noting a slightly larger downside cluster around $58,500 to $61,000.

That creates an awkward setup for short-term traders. A push higher could force more short covering if Bitcoin breaks into the upper liquidity zone. But a failure to hold current levels could pull price back toward the lower cluster, where late longs may again be vulnerable.

Liquidation maps are not precise price forecasts. They show where leveraged positions may be concentrated, not where price must go. Still, when volatility is elevated and liquidity is thin, these levels can become magnets because forced liquidations often add fuel to already-moving markets.

Trade Nation Flags 66,247 As Pivot Resistance

A TradingView idea from Trade Nation offered a more traditional support-and-resistance framework for Bitcoin’s current pullback. The analysis described BTC as being in a corrective phase on the four-hour chart and identified 66,247 as the main pivot resistance level.

As long as Bitcoin remains below that level, Trade Nation’s downside scenario highlights 59,150 as near-term support, followed by 56,900 and 54,920. On the upside, a move above 66,247 would shift attention toward 67,950 and then 69,940.

Those levels line up reasonably well with the broader liquidation-map picture. The $59,150 support sits inside the wider $58,500 to $61,000 downside liquidity region, while the 66,247 pivot is close to the upper $63,500 to $66,000 zone identified in the heatmap post.
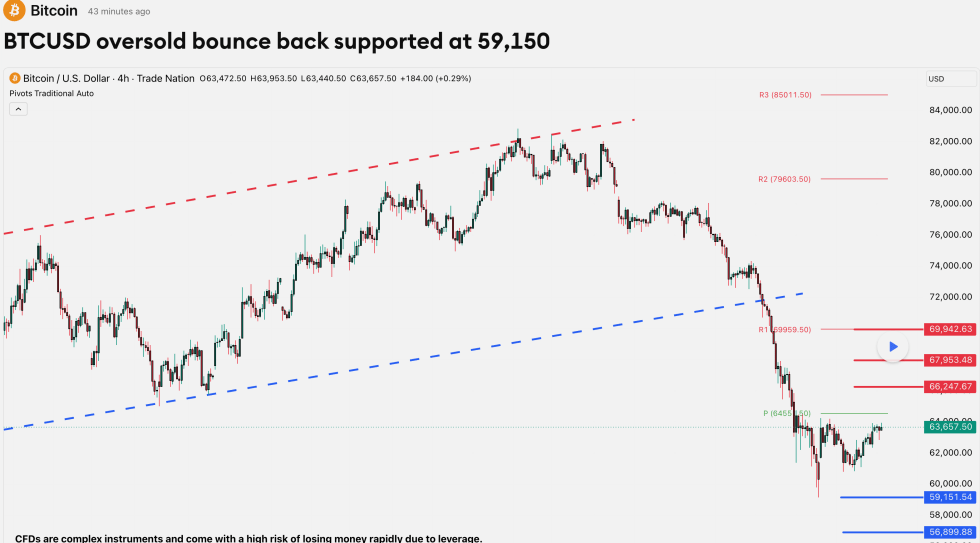
Trade Nation’s TradingView setup marked 66,247 as the main pivot resistance.

Short-Term Traders Watch The Swept High

A separate TradingView idea from virDeStatera focused on Bitcoin’s one-hour structure and argued that a new overnight high had been swept. The analysis placed that swept high at 64,234, with price pulling back toward 63,713 at the time of the post.

The same setup identified 65,890 as key resistance, with intraday support between 63,127 and 63,354. Below that, virDeStatera highlighted 62,459 as key support and 60,171 as a broader thesis line.

The technical language in the original TradingView post included several proprietary indicators, but the practical takeaway is simpler: Bitcoin needs to reclaim the swept 64,234 area with convincing volume before traders can reasonably look toward 65,890 and the broader 66,000 region.

If that reclaim fails, attention likely shifts back toward the lower support stack. The first area to watch would be the 63,127 to 63,354 band, followed by 62,459 and then the wider 60,000 to 61,000 zone flagged by liquidation data.
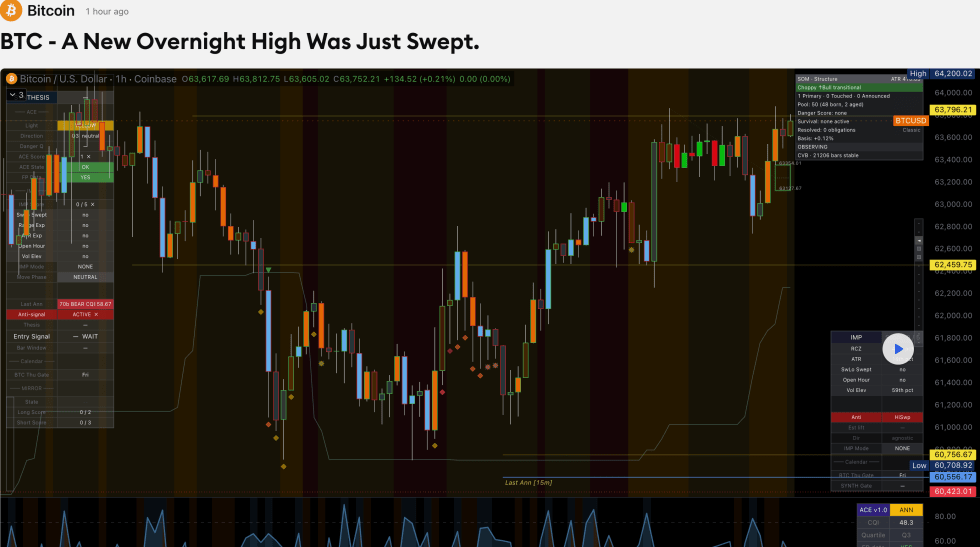
virDeStatera’s TradingView idea focused on the 64,234 swept high and nearby intraday support.

What This Means For Bitcoin Traders

The current setup does not offer a clean one-way signal. Instead, it shows a market sitting between two obvious liquidity pockets after a major leverage reset.

For bulls, reclaiming 64,234 and then pressing toward 65,890 would be the first step toward testing the 66,247 pivot and the upper liquidation zone. For bears, failure to hold above the low-$63,000 area would keep the lower support cluster in play.

That makes risk management more important than prediction. Bitcoin can move quickly when liquidation levels sit close to spot, and the recent $980 million flush shows how fast crowded positioning can unwind.

For now, the clearest map is this: resistance is stacked between roughly 64,234, 65,890, and 66,247, while downside risk builds around 63,127 to 63,354, then 62,459, and finally the broader 59,150 to 60,171 region. Until one side breaks cleanly, Bitcoin remains trapped in a short-term volatility corridor.


Originally shared by CryptoReviewing on X

Trending Cryptos

Related Questions

QWhat was the total estimated value of crypto liquidations triggered by Bitcoin's recent volatile price move, and over what time period did this occur?

AThe total estimated value of crypto liquidations was about $980 million, and this occurred in less than 24 hours.

QAccording to the article, what is the main pivot resistance level for Bitcoin identified in Trade Nation's TradingView analysis?

AThe main pivot resistance level identified by Trade Nation is $66,247.

QWhat are the two broad Bitcoin price ranges identified as liquidity clusters or zones by the analyst CryptoReviewing?

ACryptoReviewing identified an upside liquidity zone from $63,500 to $66,000, and a slightly larger downside liquidity cluster around $58,500 to $61,000.

QIn the shorter-term analysis by virDeStatera, what price level is identified as the 'swept high' that Bitcoin needs to reclaim?

AThe 'swept high' that Bitcoin needs to reclaim is at $64,234.

QBased on the article's conclusion, what is the primary focus for traders in the current Bitcoin market setup, rather than trying to predict direction?

AThe primary focus for traders should be on risk management, as the market is trapped in a short-term volatility corridor between key resistance and support levels.

Related Reads

When Traditional Finance Fails People in Crisis, Bitcoin Succeeds

When traditional finance fails to reach people in crisis, Bitcoin succeeds. This article highlights how fundraising platforms like GoFundMe face severe limitations in delivering aid to conflict zones like Gaza due to banking regulations, sanctions, and compliance rules. For instance, Sami Jamal Al-Shannat raised over £55,000 for his family but couldn't receive the funds directly; instead, money had to be routed through a beneficiary in another country, leading to disputes and loss of access. The piece explores how compliance requirements often force reliance on intermediaries, shifting risk and responsibility away from platforms and onto individuals. In contrast, Bitcoin and blockchain-based platforms like Geyser and Agora enable direct, peer-to-peer transactions, bypassing traditional financial bottlenecks. These platforms shift trust from centralized institutions to verifiers—local partners or trusted organizations—who validate projects, allowing donors to send funds directly to recipients' wallets. While not a panacea, Bitcoin offers a way to circumvent "transnational financial repression," where sanctions and AML rules inadvertently harm legitimate aid recipients, activists, and dissidents. The conclusion emphasizes that open payment networks and decentralized trust models represent a systemic shift, empowering beneficiaries and providing more resilient humanitarian fundraising in crisis situations. However, challenges around verification, accountability, and fraud prevention remain.

marsbit29m ago

When Traditional Finance Fails People in Crisis, Bitcoin Succeeds

marsbit29m ago

Bitcoin Shifts Towards Consolidation, Long-Term Holder Selling Pressure Significantly Eases

Bitcoin's Bottoming Process Shows Signs of Shifting Dynamics Bitcoin's bottom formation is ongoing, but key characteristics are changing. The capitulation selling by long-term holders (LTHs), a primary source of selling pressure this cycle, has begun to cool from its recent peak. Buyers successfully absorbed the selling at the June lows, and price is now recovering to challenge overhead resistance. The market is testing higher resistance levels. Bitcoin reacted more strongly to soft inflation data than major equity indices, signaling sellers may be exhausted and buyers are waiting for a catalyst. Its correlation with stocks is weakening while its inverse relationship with the USD is deepening, suggesting liquidity dynamics are now more influential than risk sentiment. On-chain, price sits between the network's Realized Price (a historical bear market floor) and the Short-Term Holder (STH) cost basis near $69k, a key resistance level where recent buyers break even. LTH profit-taking has largely dried up, and losses now dominate realized on-chain volume—a typical late bear market signal. Crucially, the pace of LTH capitulation has started to decline. Derivatives markets show bearish positions are being unwound, with put/call ratios falling and crash protection costs moderating. However, this derisking hasn't been accompanied by significant spot buying, a missing link for sustained recovery. US spot ETF outflows have slowed but not reversed. In conclusion, foundational elements for a bottom are forming: LTH selling is easing, low-point selling was absorbed, and the market is responding to positive macro cues. The next critical test is whether spot-driven buying can push price through and hold above the STH cost basis near $69k. The follow-through is not yet confirmed.

marsbit47m ago

Bitcoin Shifts Towards Consolidation, Long-Term Holder Selling Pressure Significantly Eases

marsbit47m ago

Defending Champions or New Kings? World Cup Final Sees All AIs Backing the Same Side

Will the 2026 World Cup final see Argentina successfully defend their title or a new champion crowned? AI models from various platforms have made their prediction. The final in Buenos Aires pits defending champions Argentina against a resilient Spanish side that has reached this stage with a record of exceptional defensive solidity, conceding only one goal in seven matches. Argentina's path was dramatically different, filled with late comebacks and narrow victories, including a semi-final win over England secured by late goals assisted by the 39-year-old Lionel Messi. A poignant subplot adds narrative weight: a nearly 20-year-old photo shows a young Messi bathing an infant Lamine Yamal, who is now a 19-year-old key player for Spain, symbolizing a potential passing of the torch. In the semi-finals, most AI models incorrectly predicted a French victory over Spain, with only Google's Gemini correctly picking Spain's advancement and also accurately forecasting Argentina's win over England. For the final, however, all six surveyed AIs—ChatGPT, Claude, Gemini, Grok, DeepSeek, and Qwen—unanimously predict a Spanish victory. Their reasoning centers on Spain's superior defense, midfield control, and better physical preparedness after a less strenuous knockout stage journey. While consensus favors Spain as champions, five of the six AIs believe the match will be tightly contested, predicting a draw (1-1 or 0-0) within regular time, with Spain's advantage potentially telling in extra time or even a penalty shootout. Only DeepSeek forecasts a clear Spanish victory within 90 minutes. The stage is set for a clash between Argentina's legendary fighting spirit and Spain's machine-like consistency, with artificial intelligence firmly backing the latter to lift the trophy.

Odaily星球日报1h ago

Defending Champions or New Kings? World Cup Final Sees All AIs Backing the Same Side

Odaily星球日报1h ago

From a Loss of 19.2 Billion to a Profit of 7.1 Billion, ChangXin Technology States 'Downturn Cycle Remains a Concern'

Changxin Technology, China's leading domestic DRAM manufacturer, is nearing its IPO on the STAR Market. After reporting significant net losses of -192.25 billion yuan and -90.51 billion yuan in 2023 and 2024 respectively, the company achieved a net profit of 71.44 billion yuan in 2025. This turnaround is attributed to an AI-driven surge in DRAM demand and tight industry supply, leading to a 33.69% increase in average selling prices alongside reduced unit costs. Despite the improved profitability, with gross margins rising from -1.93% in 2023 to 40.99% in 2025, Chairman Zhu Yiming cautions that the strongly cyclical DRAM industry remains vulnerable. Risks include potential macroeconomic shifts, uncertain AI demand, and new capacity expansions that could trigger another downturn. The company still faces high fixed costs, with depreciation reaching 246.8 billion yuan in 2025. Changxin plans to raise 29.5 billion yuan through its IPO to fund technology upgrades, DRAM advancement, and R&D. While its capacity ranks fourth globally, its 7.67% Q4 2025 market share lags behind leaders Samsung, SK Hynix, and Micron. Analysts note the company must now prove its ability to achieve stable mass production with high yields and low cost-per-bit, especially for advanced products. Its growth currently relies on transitioning from DDR4/LPDDR4X to DDR5/LPDDR5X and increasing domestic substitution. Successfully developing and commercializing high-value AI products like HBM is seen as crucial for future competitiveness and closing the gap with international giants.

marsbit1h ago

From a Loss of 19.2 Billion to a Profit of 7.1 Billion, ChangXin Technology States 'Downturn Cycle Remains a Concern'

marsbit1h ago

Trading

Spot

Hot Articles

What is $BITCOIN

DIGITAL GOLD ($BITCOIN): A Comprehensive Analysis Introduction to DIGITAL GOLD ($BITCOIN) DIGITAL GOLD ($BITCOIN) is a blockchain-based project operating on the Solana network, which aims to combine the characteristics of traditional precious metals with the innovation of decentralized technologies. While it shares a name with Bitcoin, often referred to as “digital gold” due to its perception as a store of value, DIGITAL GOLD is a separate token designed to create a unique ecosystem within the Web3 landscape. Its goal is to position itself as a viable alternative digital asset, although specifics regarding its applications and functionalities are still developing. What is DIGITAL GOLD ($BITCOIN)? DIGITAL GOLD ($BITCOIN) is a cryptocurrency token explicitly designed for use on the Solana blockchain. In contrast to Bitcoin, which provides a widely recognized value storage role, this token appears to focus on broader applications and characteristics. Notable aspects include: Blockchain Infrastructure: The token is built on the Solana blockchain, known for its capacity to handle high-speed and low-cost transactions. Supply Dynamics: DIGITAL GOLD has a maximum supply capped at 100 quadrillion tokens (100P $BITCOIN), although details regarding its circulating supply are currently undisclosed. Utility: While precise functionalities are not explicitly outlined, there are indications that the token could be utilized for various applications, potentially involving decentralized applications (dApps) or asset tokenization strategies. Who is the Creator of DIGITAL GOLD ($BITCOIN)? At present, the identity of the creators and development team behind DIGITAL GOLD ($BITCOIN) remains unknown. This situation is typical among many innovative projects within the blockchain space, particularly those aligning with decentralized finance and meme coin phenomena. While such anonymity may foster a community-driven culture, it intensifies concerns about governance and accountability. Who are the Investors of DIGITAL GOLD ($BITCOIN)? The available information indicates that DIGITAL GOLD ($BITCOIN) does not have any known institutional backers or prominent venture capital investments. The project seems to operate on a peer-to-peer model focused on community support and adoption rather than traditional funding routes. Its activity and liquidity are primarily situated on decentralized exchanges (DEXs), such as PumpSwap, rather than established centralized trading platforms, further highlighting its grassroots approach. How DIGITAL GOLD ($BITCOIN) Works The operational mechanics of DIGITAL GOLD ($BITCOIN) can be elaborated on based on its blockchain design and network attributes: Consensus Mechanism: By leveraging Solana’s unique proof-of-history (PoH) combined with a proof-of-stake (PoS) model, the project ensures efficient transaction validation contributing to the network's high performance. Tokenomics: While specific deflationary mechanisms have not been extensively detailed, the vast maximum token supply implies that it may cater to microtransactions or niche use cases that are still to be defined. Interoperability: There exists the potential for integration with Solana’s broader ecosystem, including various decentralized finance (DeFi) platforms. However, the details regarding specific integrations remain unspecified. Timeline of Key Events Here is a timeline that highlights significant milestones concerning DIGITAL GOLD ($BITCOIN): 2023: The initial deployment of the token occurs on the Solana blockchain, marked by its contract address. 2024: DIGITAL GOLD gains visibility as it becomes available for trading on decentralized exchanges like PumpSwap, allowing users to trade it against SOL. 2025: The project witnesses sporadic trading activity and potential interest in community-led engagements, although no noteworthy partnerships or technical advancements have been documented as of yet. Critical Analysis Strengths Scalability: The underlying Solana infrastructure supports high transaction volumes, which could enhance the utility of $BITCOIN in various transaction scenarios. Accessibility: The potential low trading price per token could attract retail investors, facilitating wider participation due to fractional ownership opportunities. Risks Lack of Transparency: The absence of publicly known backers, developers, or an audit process may yield skepticism regarding the project's sustainability and trustworthiness. Market Volatility: The trading activity is heavily reliant on speculative behavior, which can result in significant price volatility and uncertainty for investors. Conclusion DIGITAL GOLD ($BITCOIN) emerges as an intriguing yet ambiguous project within the rapidly evolving Solana ecosystem. While it attempts to leverage the “digital gold” narrative, its departure from Bitcoin's established role as a store of value underscores the need for a clearer differentiation of its intended utility and governance structure. Future acceptance and adoption will likely depend on addressing the current opacity and defining its operational and economic strategies more explicitly. Note: This report encompasses synthesised information available as of October 2023, and developments may have transpired beyond the research period.

845 Total ViewsPublished 2025.05.13Updated 2025.05.13

What is $BITCOIN

Discussions

Welcome to the HTX Community. Here, you can stay informed about the latest platform developments and gain access to professional market insights. Users' opinions on the price of BTC (BTC) are presented below.

活动图片