Bitcoin Indicator Shows Market At Liquidity Equilibrium – What Next?

bitcoinistPublished on 2026-02-15Last updated on 2026-02-15

Abstract

Bitcoin is stabilizing near $68,000 after a recent 2.41% weekly loss, still down 46% from its 2025 all-time high. A key indicator, the Stablecoin Supply Ratio (SSR), is currently around 9.5–9.6, signaling a liquidity equilibrium. SSR measures Bitcoin's market cap against stablecoin supply, indicating available buying power. When SSR declines toward 9.5, it often signals strengthening liquidity and potential upward reversals. Conversely, a rise toward 9.5 suggests fading liquidity and possible corrections. Despite a 3.97% daily price increase, trading volume has dropped 15.3%, and the Fear and Greed Index reflects extreme caution. However, some analysts project short-term targets of $73,769 and $77,687, with a three-month expectation of $72,480.

The current market landscape for Bitcoin remains largely bearish following a net 2.41% loss over the past week. While Bitcoin is presently stabilizing around $68,000, the digital asset remains about 46% off its all-time high ($126,100) recorded in late 2025.

Bull Or Bear? Decoding Bitcoin’s SSR Liquidity Signals

In a QuickTake post on the CryptoQuant platform, a pseudonymous analyst, MorenoDV, explained how the Stablecoin Supply Ratio (SSR) acts as a liquidity signal for Bitcoin and why the current level around 9.5–9.6 is important.

SSR measures Bitcoin’s market cap relative to stablecoin supply. In other words, it reflects how much “dry powder“ (buying power) exists in the market. High SSR shows that Bitcoin’s market cap is large relative to stablecoins – less sidelined buying power, while Low SSR indicates stablecoin supply relatively strong to Bitcoin — more potential buying power available.

Source: CryptoQuant

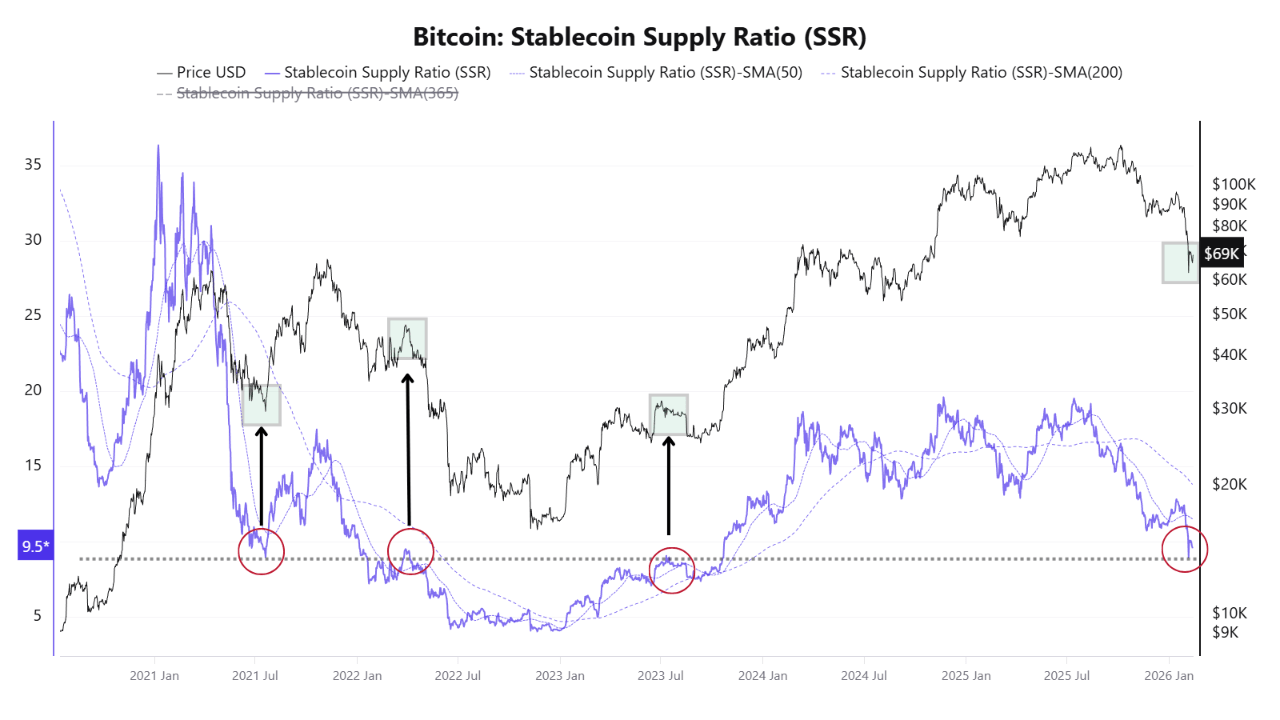
According to analyst MorenoDV, the SSR is not a straightforward bullish or bearish indicator; its significance depends on the direction of the market’s approach to the 9.5 level. When the SSR falls towards 9.5 from higher levels, it typically signals strengthening stablecoin liquidity, which has often led to Bitcoin finding support or reversing upward in past cycles.

Conversely, if the SSR rises toward 9.5 from lower levels, it suggests fading liquidity, historically preceding local tops and short-term corrections.

Analyst MorenoDV describes the 9.5 level as a liquidity equilibrium zone due to its ability to act as support or resistance based on the market approach. As the SSR navigates this critical zone, market traders will closely observe if stablecoin inflows are maintained at a constant level, or if there is an impending liquidity exhaustion, which would be indicated by a rejection at this equilibrium zone.

Bitcoin Price Overview

As of writing, Bitcoin’s price stands at ~$68,840, reflecting a 3.97% increase over the past 24 hours. Meanwhile, its daily trading volume is down by 15.3% and valued at $37.33 billion. According to data from Coincodex, the Fear and Greed index stands at 9, indicating extreme levels of caution among investors.

However, Coincodex analysts and investors will gradually adopt a more bullish stance, as their projections hint at a $73,769 target in five days and $77,687 in a month. Meanwhile, a three-month target of $72,480, suggest some levels retracement following the initial surge, in line with a classic ascending pattern.

BTC trading at $68,932 on the daily chart | Source: BTCUSDT chart on Tradingview.com

Featured image from XVerse, chart from Tradingview.com

Related Questions

QWhat is the current Bitcoin SSR level and why is it considered a liquidity equilibrium zone?

AThe current Bitcoin SSR level is around 9.5–9.6. It is considered a liquidity equilibrium zone because it can act as either support or resistance depending on the market's direction. When SSR falls to this level from higher values, it signals strengthening stablecoin liquidity and potential upward momentum. Conversely, when SSR rises to this level from lower values, it indicates fading liquidity and potential corrections.

QHow does the Stablecoin Supply Ratio (SSR) function as a liquidity indicator for Bitcoin?

ASSR measures Bitcoin's market capitalization relative to the supply of stablecoins. A high SSR indicates that Bitcoin's market cap is large compared to stablecoins, suggesting less available 'dry powder' or buying power. A low SSR shows that stablecoin supply is strong relative to Bitcoin, indicating more potential buying power available in the market.

QWhat was Bitcoin's price and recent performance at the time of writing?

AAt the time of writing, Bitcoin's price was approximately $68,840, reflecting a 3.97% increase over the past 24 hours. However, it had experienced a net 2.41% loss over the past week and remained about 46% below its all-time high of $126,100 recorded in late 2025.

QWhat does the current Fear and Greed Index value of 9 indicate about market sentiment?

AA Fear and Greed Index value of 9 indicates extreme fear or caution among investors, reflecting very bearish market sentiment and high levels of risk aversion in the cryptocurrency market.

QWhat are the short-term and medium-term price projections for Bitcoin according to Coincodex analysts?

AAccording to Coincodex analysts, short-term projections suggest Bitcoin could reach $73,769 in five days and $77,687 in one month. The three-month target is $72,480, indicating an expected retracement following an initial surge, consistent with a classic ascending pattern.

Related Reads

From Robinhood to Polymarket: Is the Era of Integrating All Assets on a Single Platform Coming?

From Robinhood to Polymarket: The Era of All-in-One Asset Platforms Is Coming Asset classes are rapidly converging. Platforms that once specialized in single categories—such as stocks, cryptocurrencies, or prediction markets—are now moving toward offering all three. Robinhood pioneered this model, starting with equities, adding crypto in 2018, and prediction markets in 2025. This strategy has proven resilient: when crypto revenues fell, other segments like options and stocks filled the gap. Now, prediction market leaders Polymarket and Kalshi are moving in the same direction, both announcing perpetual futures trading on April 21, 2026, pending regulatory approval. These futures will cover assets like Bitcoin, gold, and stocks such as Nvidia. This trend mirrors the consolidation seen in consumer tech, like smartphones replacing dedicated cameras and MP3 players. Younger users, accustomed to interacting with multiple asset types from an early age, will increasingly demand unified platforms. A key competitive advantage in prediction markets is collateral utilization—idle assets locked during betting periods. Polymarket’s move into perpetuals may be a strategy to generate yield from that capital, similar to earlier DeFi integrations like PolyAave. As the regulatory landscape evolves, traditional finance is also likely to incorporate crypto and prediction markets, further accelerating this convergence.

marsbit37m ago

From Robinhood to Polymarket: Is the Era of Integrating All Assets on a Single Platform Coming?

marsbit37m ago

Trading

Spot
Futures

Hot Articles

What is $BITCOIN

DIGITAL GOLD ($BITCOIN): A Comprehensive Analysis Introduction to DIGITAL GOLD ($BITCOIN) DIGITAL GOLD ($BITCOIN) is a blockchain-based project operating on the Solana network, which aims to combine the characteristics of traditional precious metals with the innovation of decentralized technologies. While it shares a name with Bitcoin, often referred to as “digital gold” due to its perception as a store of value, DIGITAL GOLD is a separate token designed to create a unique ecosystem within the Web3 landscape. Its goal is to position itself as a viable alternative digital asset, although specifics regarding its applications and functionalities are still developing. What is DIGITAL GOLD ($BITCOIN)? DIGITAL GOLD ($BITCOIN) is a cryptocurrency token explicitly designed for use on the Solana blockchain. In contrast to Bitcoin, which provides a widely recognized value storage role, this token appears to focus on broader applications and characteristics. Notable aspects include: Blockchain Infrastructure: The token is built on the Solana blockchain, known for its capacity to handle high-speed and low-cost transactions. Supply Dynamics: DIGITAL GOLD has a maximum supply capped at 100 quadrillion tokens (100P $BITCOIN), although details regarding its circulating supply are currently undisclosed. Utility: While precise functionalities are not explicitly outlined, there are indications that the token could be utilized for various applications, potentially involving decentralized applications (dApps) or asset tokenization strategies. Who is the Creator of DIGITAL GOLD ($BITCOIN)? At present, the identity of the creators and development team behind DIGITAL GOLD ($BITCOIN) remains unknown. This situation is typical among many innovative projects within the blockchain space, particularly those aligning with decentralized finance and meme coin phenomena. While such anonymity may foster a community-driven culture, it intensifies concerns about governance and accountability. Who are the Investors of DIGITAL GOLD ($BITCOIN)? The available information indicates that DIGITAL GOLD ($BITCOIN) does not have any known institutional backers or prominent venture capital investments. The project seems to operate on a peer-to-peer model focused on community support and adoption rather than traditional funding routes. Its activity and liquidity are primarily situated on decentralized exchanges (DEXs), such as PumpSwap, rather than established centralized trading platforms, further highlighting its grassroots approach. How DIGITAL GOLD ($BITCOIN) Works The operational mechanics of DIGITAL GOLD ($BITCOIN) can be elaborated on based on its blockchain design and network attributes: Consensus Mechanism: By leveraging Solana’s unique proof-of-history (PoH) combined with a proof-of-stake (PoS) model, the project ensures efficient transaction validation contributing to the network's high performance. Tokenomics: While specific deflationary mechanisms have not been extensively detailed, the vast maximum token supply implies that it may cater to microtransactions or niche use cases that are still to be defined. Interoperability: There exists the potential for integration with Solana’s broader ecosystem, including various decentralized finance (DeFi) platforms. However, the details regarding specific integrations remain unspecified. Timeline of Key Events Here is a timeline that highlights significant milestones concerning DIGITAL GOLD ($BITCOIN): 2023: The initial deployment of the token occurs on the Solana blockchain, marked by its contract address. 2024: DIGITAL GOLD gains visibility as it becomes available for trading on decentralized exchanges like PumpSwap, allowing users to trade it against SOL. 2025: The project witnesses sporadic trading activity and potential interest in community-led engagements, although no noteworthy partnerships or technical advancements have been documented as of yet. Critical Analysis Strengths Scalability: The underlying Solana infrastructure supports high transaction volumes, which could enhance the utility of $BITCOIN in various transaction scenarios. Accessibility: The potential low trading price per token could attract retail investors, facilitating wider participation due to fractional ownership opportunities. Risks Lack of Transparency: The absence of publicly known backers, developers, or an audit process may yield skepticism regarding the project's sustainability and trustworthiness. Market Volatility: The trading activity is heavily reliant on speculative behavior, which can result in significant price volatility and uncertainty for investors. Conclusion DIGITAL GOLD ($BITCOIN) emerges as an intriguing yet ambiguous project within the rapidly evolving Solana ecosystem. While it attempts to leverage the “digital gold” narrative, its departure from Bitcoin's established role as a store of value underscores the need for a clearer differentiation of its intended utility and governance structure. Future acceptance and adoption will likely depend on addressing the current opacity and defining its operational and economic strategies more explicitly. Note: This report encompasses synthesised information available as of October 2023, and developments may have transpired beyond the research period.

363 Total ViewsPublished 2025.05.13Updated 2025.05.13

What is $BITCOIN

Discussions

Welcome to the HTX Community. Here, you can stay informed about the latest platform developments and gain access to professional market insights. Users' opinions on the price of BTC (BTC) are presented below.

活动图片