Bitcoin Enters Bull Regime As Taker Flow Surge Drives $3,400 Premium

bitcoinistPublished on 2026-03-17Last updated on 2026-03-17

Abstract

Bitcoin has reclaimed the $70,000 level and is testing resistance near $74,000, signaling renewed bullish momentum. According to analyst Axel Adler, the Bitcoin Integrated Market Index has flipped back into a bullish regime, currently at 96, after a bearish period from mid-February. Key indicators show Bitcoin trading at a $3,453 premium above its Fair Value, with a Price Index of 95.35, suggesting strong buyer interest. The market structure shifted on March 10 as taker flow reversed and open interest expanded. A break above $74K could target the $82K–$90K range, though failure may lead to consolidation.

Bitcoin has reclaimed the $70,000 level and is now testing resistance near $74,000, signaling renewed strength after several weeks of volatile price action. The recent move higher suggests that buyers are regaining control as market sentiment begins to improve, with traders closely watching whether BTC can sustain momentum above this critical resistance zone.

Beyond the price chart, derivatives market data is beginning to reflect a notable structural shift. According to top analyst Axel Adler, Bitcoin’s Integrated Market Index, a model designed to measure aggregate pressure from the derivatives market, has recently flipped back into a bullish regime.

The indicator operates on a 0–100 scale and combines normalized metrics of price behavior and futures market flows. Readings above 55 typically indicate a bullish regime, while values below 45 suggest bearish conditions.

Bitcoin Integrated Market Index (0-100) | Source: CryptoQuant

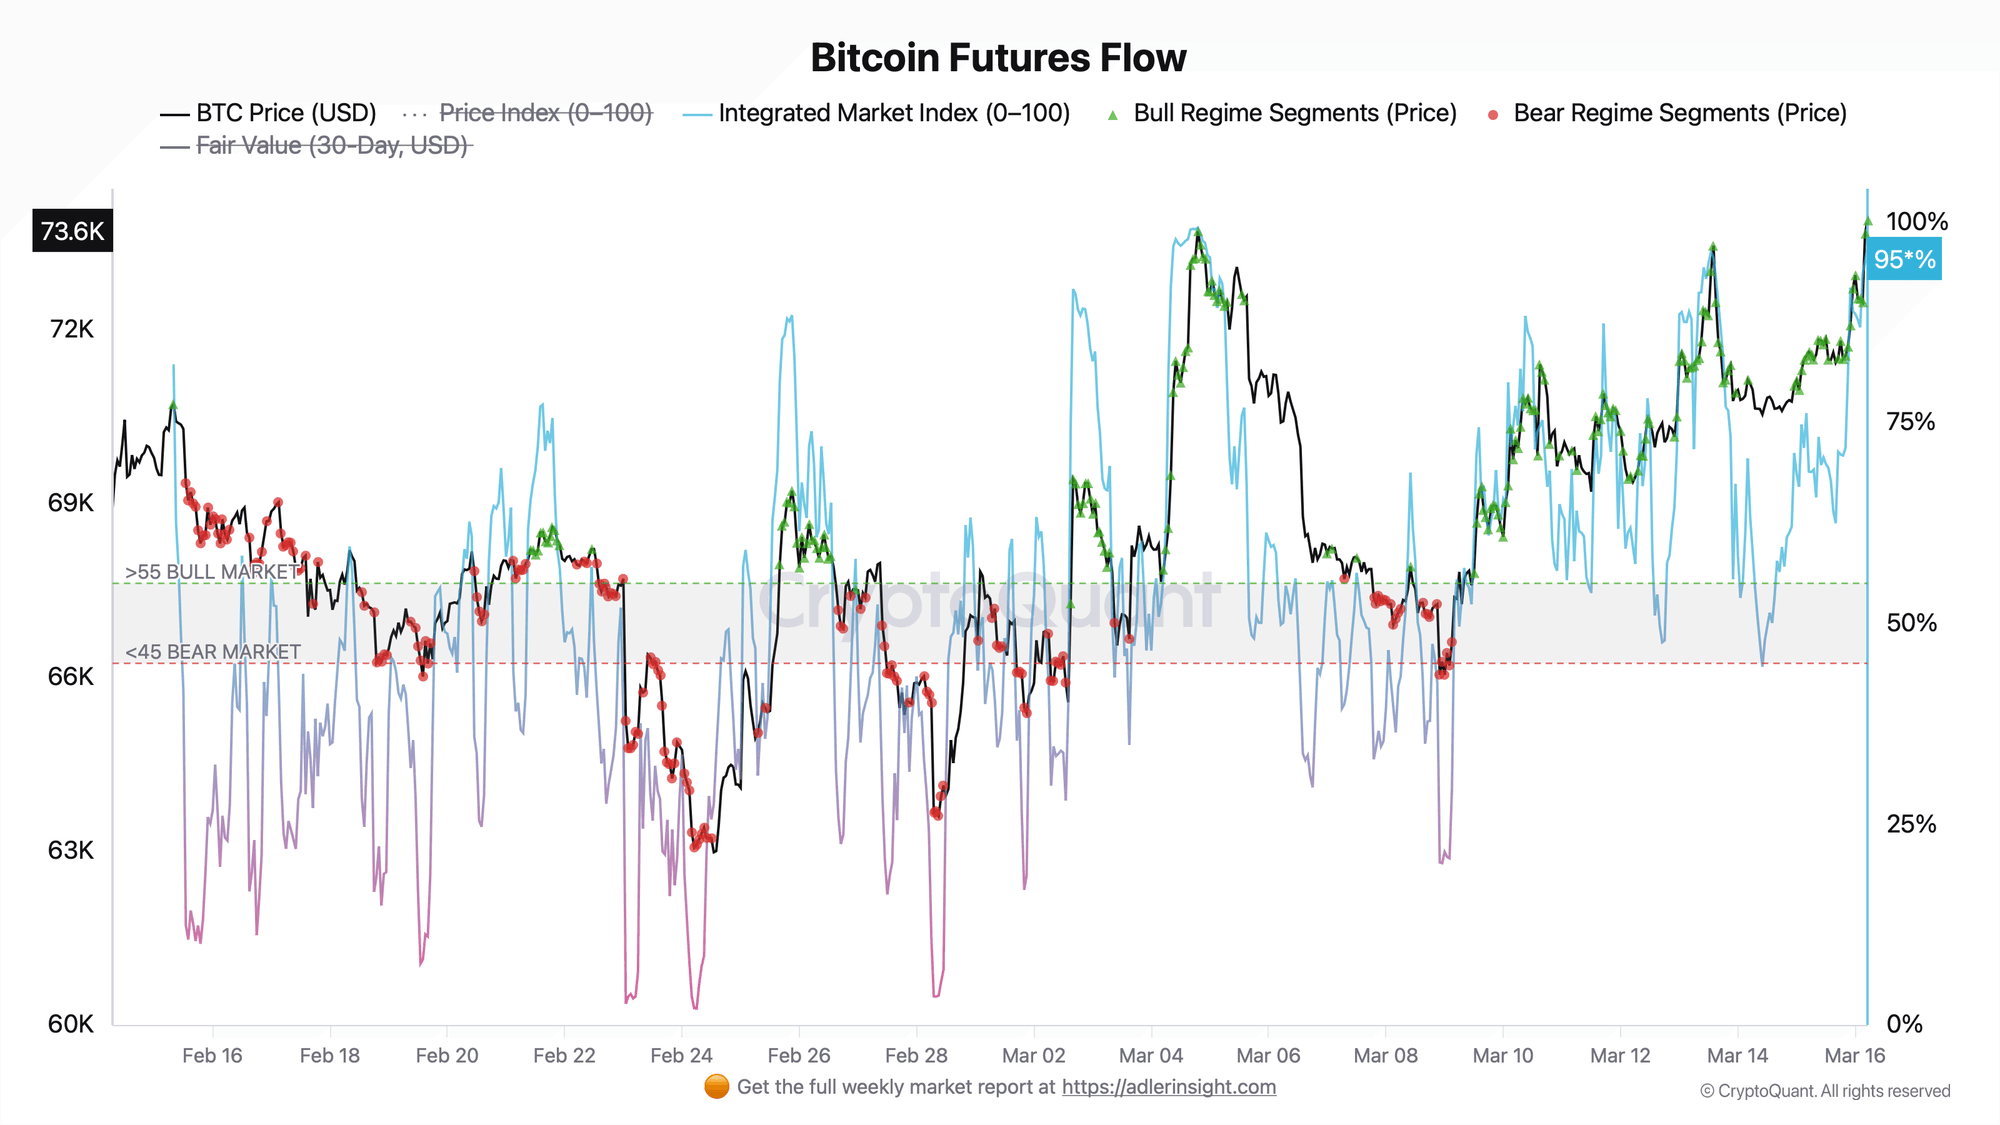
From February 15 onward, the model remained firmly in a bear regime. During that period, both price dynamics and futures market flows deteriorated simultaneously as sustained negative net taker volume and compression in open interest pushed the Flow Index below the bearish threshold. As Bitcoin’s price dropped toward $63,000, the Integrated Index reached its lowest levels.

However, the structure shifted on March 10, when taker flow reversed, and open interest began expanding again. Since that moment, the model has remained firmly bullish, with the index currently standing at 96, its highest level in weeks.

Price Index and Fair Value Confirm Bitcoin’s Regime Shift

Adler further explains that Bitcoin’s Price Index (0–100) and 30-day Fair Value model provide additional insight into how the market is behaving relative to its statistical equilibrium. The Price Index represents the normalized z-score of price, measuring how far Bitcoin deviates from its recent average, while Fair Value acts as an adjusted benchmark that reflects the prevailing market regime.

During the previous bear regime, Bitcoin consistently traded below Fair Value, signaling persistent market weakness. At the peak of selling pressure on February 24, the discount widened significantly. At that moment, Bitcoin was trading more than $3,300 below Fair Value, while the Price Index dropped to 1.85, indicating that price had deviated sharply below the statistical norm for that market environment.

Today, the situation has reversed. According to Adler’s data, the Price Index currently stands at 95.35, with Bitcoin trading around $73,886, while the model estimates Fair Value at approximately $70,433. This places the market at a premium of about $3,453 above Fair Value.

Adler notes that premiums exceeding $3,000 with a Price Index above 90 represent zones of heightened attention. However, this does not automatically imply an imminent reversal. As long as the Integrated Index remains strong—currently around 0.94—the premium is considered structurally justified, supporting the view that the current breakout reflects a genuine regime shift rather than a temporary price anomaly.

Bitcoin Tests Major Resistance After Recovery From February Selloff

The weekly chart shows Bitcoin attempting to extend its recovery after the sharp decline that unfolded earlier in 2026. Following a prolonged uptrend that pushed BTC above the $110,000 region in late 2025, the market entered a corrective phase characterized by strong selling pressure and a sequence of lower highs.

BTC testing critical resistance | Source: BTCUSDT chart on TradingView

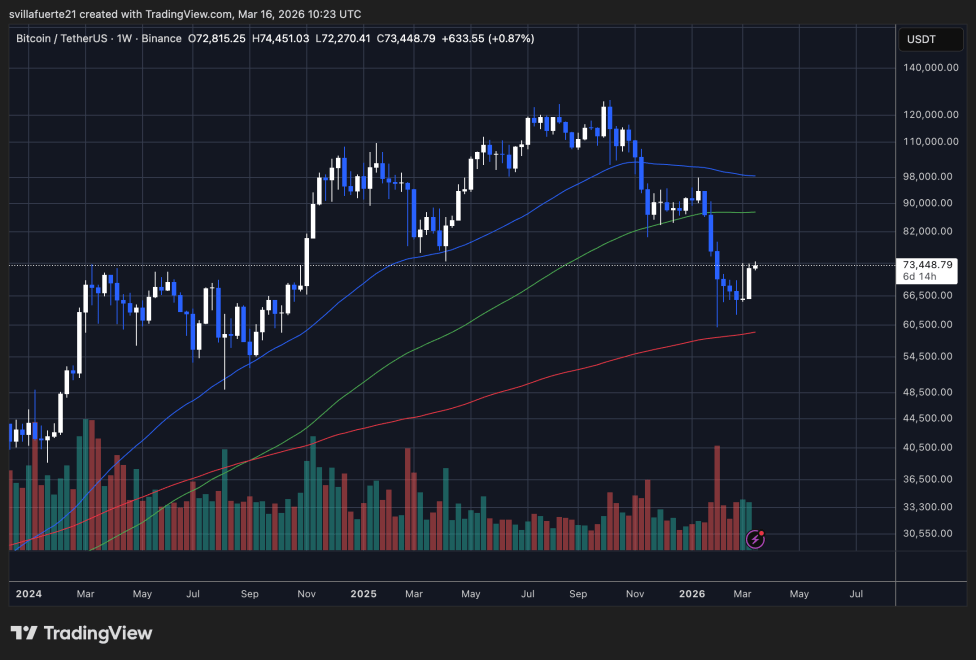
That correction accelerated in February, when Bitcoin dropped toward the $60,000–$65,000 zone, triggering a surge in trading volume that likely reflected forced liquidations and broader market capitulation. However, buyers stepped in quickly after the decline, allowing BTC to stabilize and begin a gradual rebound.

In recent weeks, Bitcoin has reclaimed the $70,000 level and is now trading near $73,400, approaching an important resistance zone around $74,000–$75,000. This region previously acted as a key support level before the February breakdown and is now functioning as overhead resistance.

From a technical perspective, Bitcoin remains above its 200-week moving average, which continues to slope upward and serves as a critical long-term support indicator. Meanwhile, the 100-week moving average sits above the current price, suggesting that BTC must reclaim higher levels to fully confirm a bullish continuation.

If Bitcoin manages to break above the $74K resistance zone, the next upside targets could emerge around the $82K–$90K range. However, failure to sustain momentum may lead to renewed consolidation as the market absorbs recent volatility.

Featured image from ChatGPT, chart from TradingView.com

Related Questions

QWhat does Bitcoin's Integrated Market Index flipping back into a bullish regime indicate?

AIt indicates a notable structural shift in the derivatives market, with the index (on a 0-100 scale) now at 96, reflecting renewed strength and bullish conditions as taker flow reversed and open interest began expanding again.

QHow is the current Bitcoin price premium above Fair Value interpreted according to analyst Axel Adler?

AThe premium of about $3,453 above Fair Value, coupled with a Price Index above 90, represents a zone of heightened attention but is considered structurally justified as long as the Integrated Index remains strong (around 0.94), supporting a genuine regime shift rather than a temporary anomaly.

QWhat critical resistance level is Bitcoin currently testing after its recent recovery?

ABitcoin is currently testing resistance near the $74,000–$75,000 zone, which previously acted as key support before the February breakdown and now functions as overhead resistance.

QWhat were the key factors that pushed the Integrated Market Index into a bear regime from February 15 onward?

ASustained negative net taker volume and compression in open interest simultaneously deteriorated price dynamics and futures market flows, pushing the Flow Index below the bearish threshold and causing the Integrated Index to reach its lowest levels as Bitcoin's price dropped toward $63,000.

QWhat are the potential upside targets if Bitcoin breaks above the $74K resistance zone?

AIf Bitcoin breaks above the $74K resistance zone, the next upside targets could emerge around the $82K–$90K range.

Related Reads

Goldman Sachs Bows Down, Bitcoin Finally Breaks Through the Gates of Wall Street

Wall Street giants, including Goldman Sachs, Morgan Stanley, Charles Schwab, and the New York Stock Exchange, have reversed their long-standing opposition to Bitcoin and are now actively embracing it. After years of dismissing Bitcoin as a scam, a bubble, or a tool for illicit activities, these institutions are launching Bitcoin ETFs, enabling spot trading, and building dedicated crypto infrastructure. Goldman Sachs, which once called Bitcoin a "fraud tool," is now offering Bitcoin ETFs. Morgan Stanley, which internally banned the term "cryptocurrency," has launched its largest-ever ETF backed by Bitcoin. Charles Schwab has opened spot crypto trading for its retail clients, integrating Bitcoin alongside traditional assets. The NYSE is building robust infrastructure to support digital assets, signaling a long-term commitment. This dramatic shift is driven not by a change in ideology but by economic necessity. As Bitcoin repeatedly survived market crashes and grew into a multi-trillion-dollar asset class, ignoring it became too costly. Wall Street’s business model relies on capturing fees, and Bitcoin’s rise represented a massive wealth transfer occurring outside their ecosystem. The fear of missing out (FOMO) and client demand forced these institutions to capitulate. The article frames this as a historic surrender to Bitcoin’s mathematical inevitability. Unlike the trust-based traditional financial system, Bitcoin operates on decentralized, transparent, and unchangeable rules. Its scarcity and resilience make it a hedge against fiat currency devaluation and systemic risk. The narrative has flipped: not holding Bitcoin is now seen as the greater risk. The author concludes that Bitcoin has not been co-opted by Wall Street; instead, it has co-opted Wall Street, marking a fundamental shift in the global financial architecture.

marsbit46m ago

Goldman Sachs Bows Down, Bitcoin Finally Breaks Through the Gates of Wall Street

marsbit46m ago

Trading

Spot
Futures

Hot Articles

How to Buy FLOW

Welcome to HTX.com! We've made purchasing Flow (FLOW) simple and convenient. Follow our step-by-step guide to embark on your crypto journey.Step 1: Create Your HTX AccountUse your email or phone number to sign up for a free account on HTX. Experience a hassle-free registration journey and unlock all features.Get My AccountStep 2: Go to Buy Crypto and Choose Your Payment MethodCredit/Debit Card: Use your Visa or Mastercard to buy Flow (FLOW) instantly.Balance: Use funds from your HTX account balance to trade seamlessly.Third Parties: We've added popular payment methods such as Google Pay and Apple Pay to enhance convenience.P2P: Trade directly with other users on HTX.Over-the-Counter (OTC): We offer tailor-made services and competitive exchange rates for traders.Step 3: Store Your Flow (FLOW)After purchasing your Flow (FLOW), store it in your HTX account. Alternatively, you can send it elsewhere via blockchain transfer or use it to trade other cryptocurrencies.Step 4: Trade Flow (FLOW)Easily trade Flow (FLOW) on HTX's spot market. Simply access your account, select your trading pair, execute your trades, and monitor in real-time. We offer a user-friendly experience for both beginners and seasoned traders.

2.8k Total ViewsPublished 2024.03.29Updated 2025.05.06

How to Buy FLOW

Discussions

Welcome to the HTX Community. Here, you can stay informed about the latest platform developments and gain access to professional market insights. Users' opinions on the price of FLOW (FLOW) are presented below.

活动图片