Author: WEEX Labs
In past Bitcoin bull market cycles, the price peak has often been accompanied by signs of market overheating. However, this bull market appears to have undergone some significant changes—many previously reliable indicators have not yet signaled a top, while the price of Bitcoin has been in a steady decline since hitting a new high on October 6th, further driving several indicators to turn bearish.
Below, we will examine 10 classic indicators, evaluate their characteristics and limitations, and outline the underlying changes in Bitcoin and the broader crypto market.
1. Pi Cycle Top Indicator: Has the Cycle Peak Been Reached?
The Pi Cycle indicator is a classic tool for identifying Bitcoin price tops using the 111-day moving average (111DMA) and the 350-day moving average multiplied by 2 (350DMA x 2).
Typically, when the short-term line crosses above the long-term line, it often signals a market top, as it indicates that the price is rising too quickly and detaching from fundamental support.
Historically, the Pi Cycle Top Indicator has shown crossover behavior before each bull market peak:
2017 peak: The 111DMA crossed above the 350DMA x 2, marking the subsequent bubble burst;
2021 double top: A similar crossover occurred before the first top, followed by a rapid market correction;
Currently (Q4 2025), as shown in the chart below, the two lines have not yet crossed.
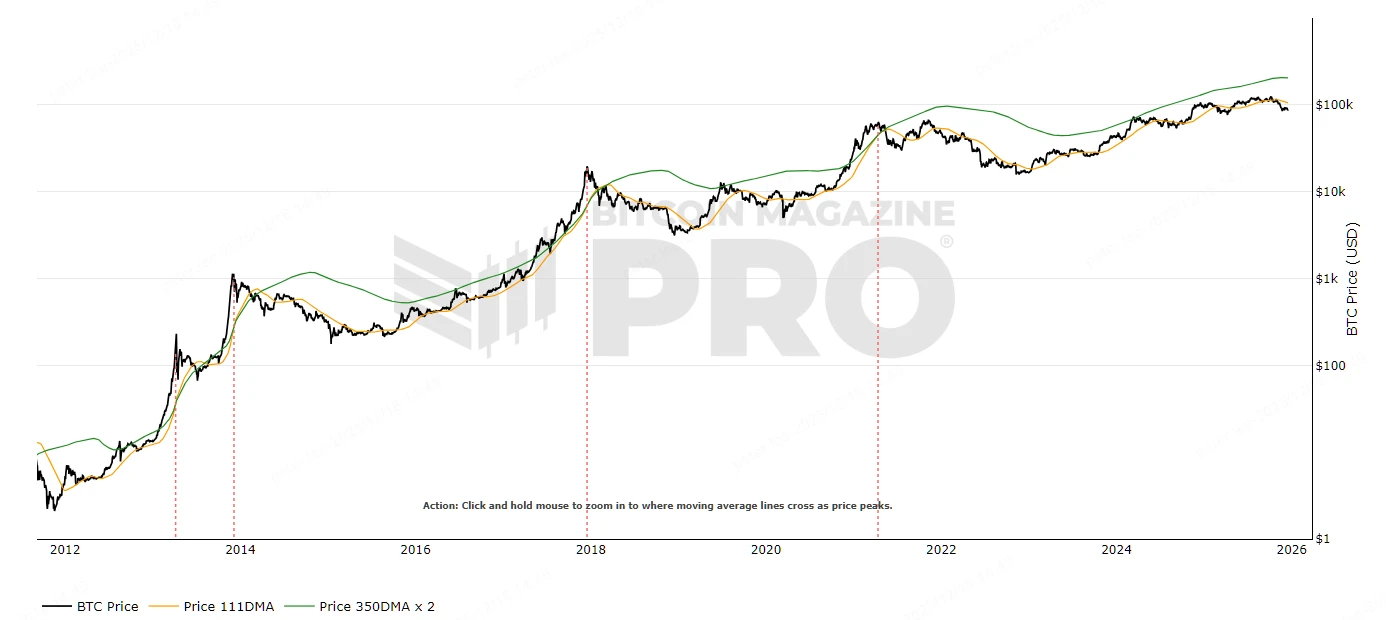
Source: https://www.bitcoinmagazinepro.com/charts/pi-cycle-top-indicator
2. Puell Multiple: Are Miner Profits Excessive?
The Puell Multiple measures the ratio of miners' daily revenue to its 365-day moving average, used to assess miner profitability and market cycles.
Its principle is based on miner behavior: when the ratio is too high, miners are highly profitable and may increase selling pressure, forming a top; when it is too low, it indicates miner capitulation, signaling a bottom. In other words, a high Puell Multiple reflects that "miners are making too much money," accumulating supply pressure.
Historically, the Puell Multiple has also shown extreme spikes before each bull market peak:
2017 peak: Exceeded 7, a historical high;
2021 double top: Exceeded 3, followed by a crash;
Currently (Q4 2025), the Puell Multiple is in the 1~2 range, indicating moderate miner pressure.
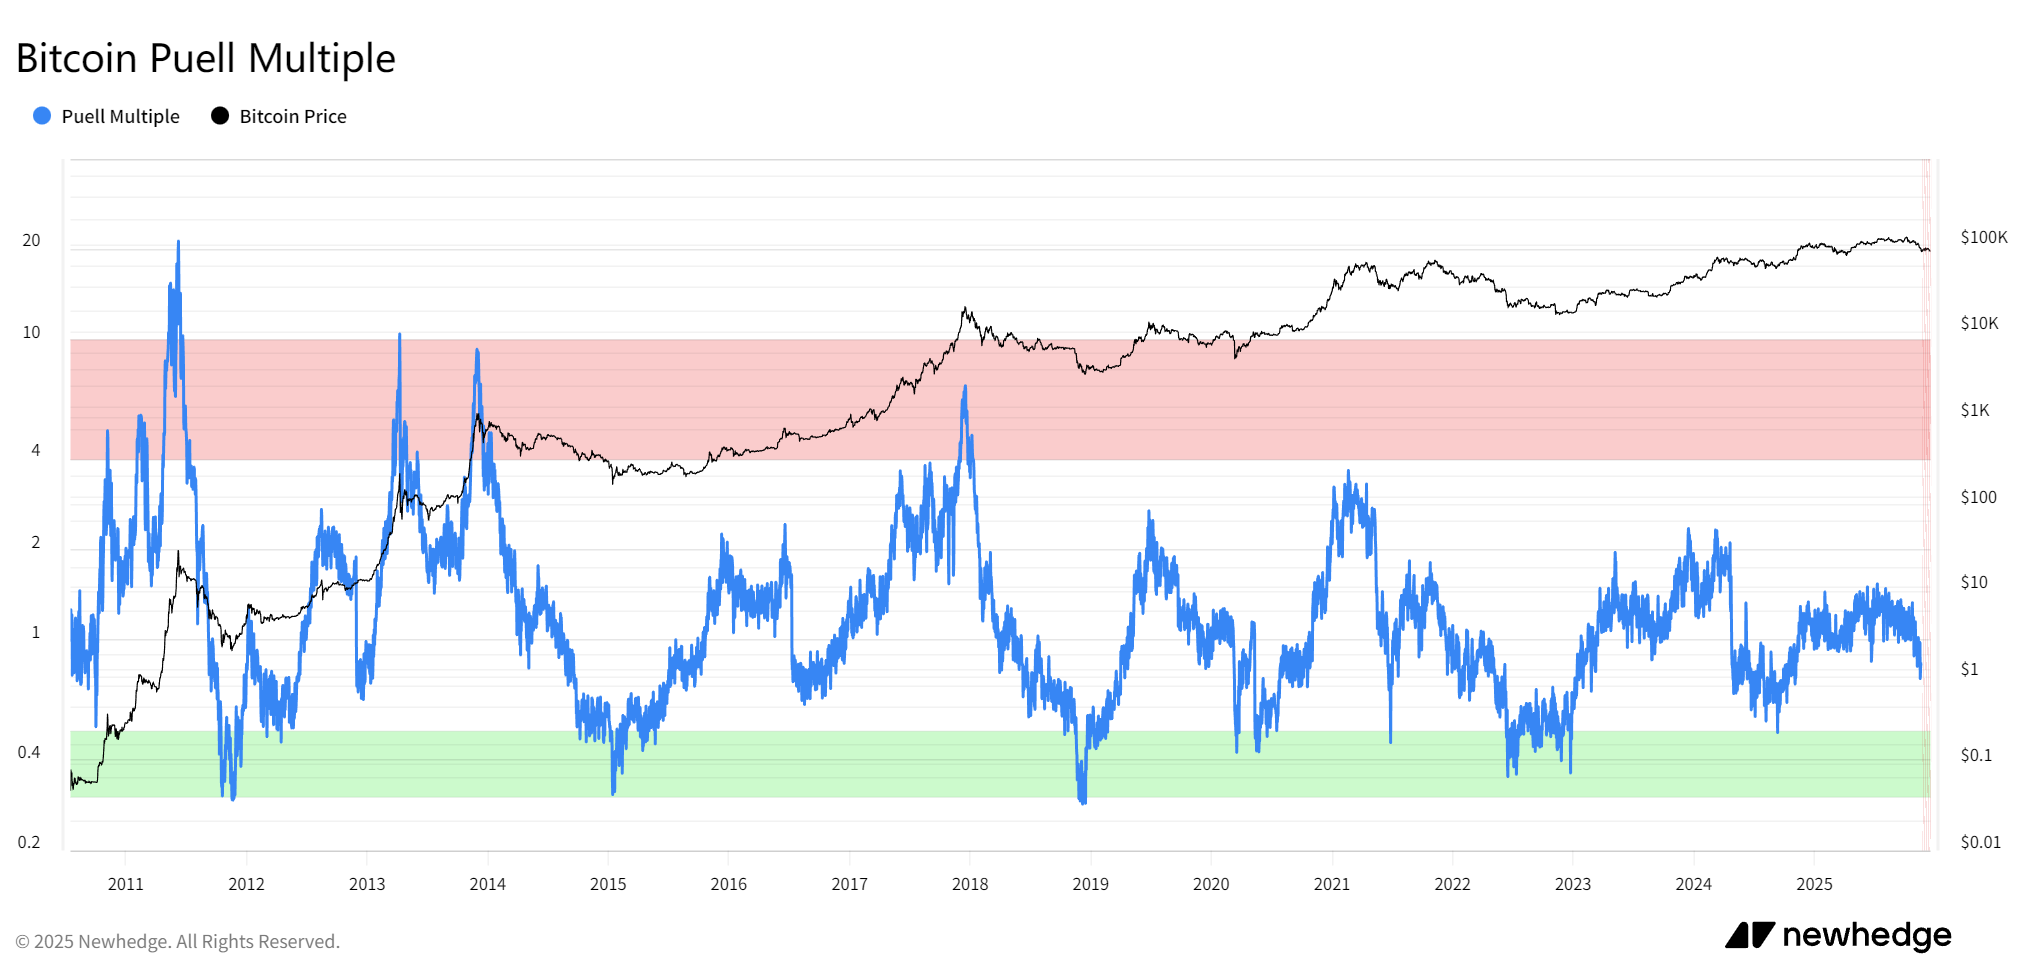
Source: https://newhedge.io/bitcoin/puell-multiple
3. Bitcoin Rainbow Chart: Has the Price Entered the "Sell" Zone?
The Bitcoin Rainbow Chart uses a logarithmic growth curve overlaid with rainbow-colored bands to evaluate Bitcoin's long-term valuation levels.
Its principle maps prices to color bands: the blue zone indicates undervaluation (buy), and the red zone indicates overvaluation (sell). The bands are based on historical growth curves, helping to identify extreme market sentiment.
Historically, the Bitcoin Rainbow Chart has entered the red zone before each bull market peak:
2017 peak: Deep red zone, bubble peak;
2021 double top: Orange-red zone, followed by a correction;
Currently (Q4 2025), the price is in the yellow to orange range, not yet reaching the red bubble zone. We have also seen many analysts adjust this indicator, but regardless of the adjustments, the price has indeed not reached the red bubble area based on past historical experience.
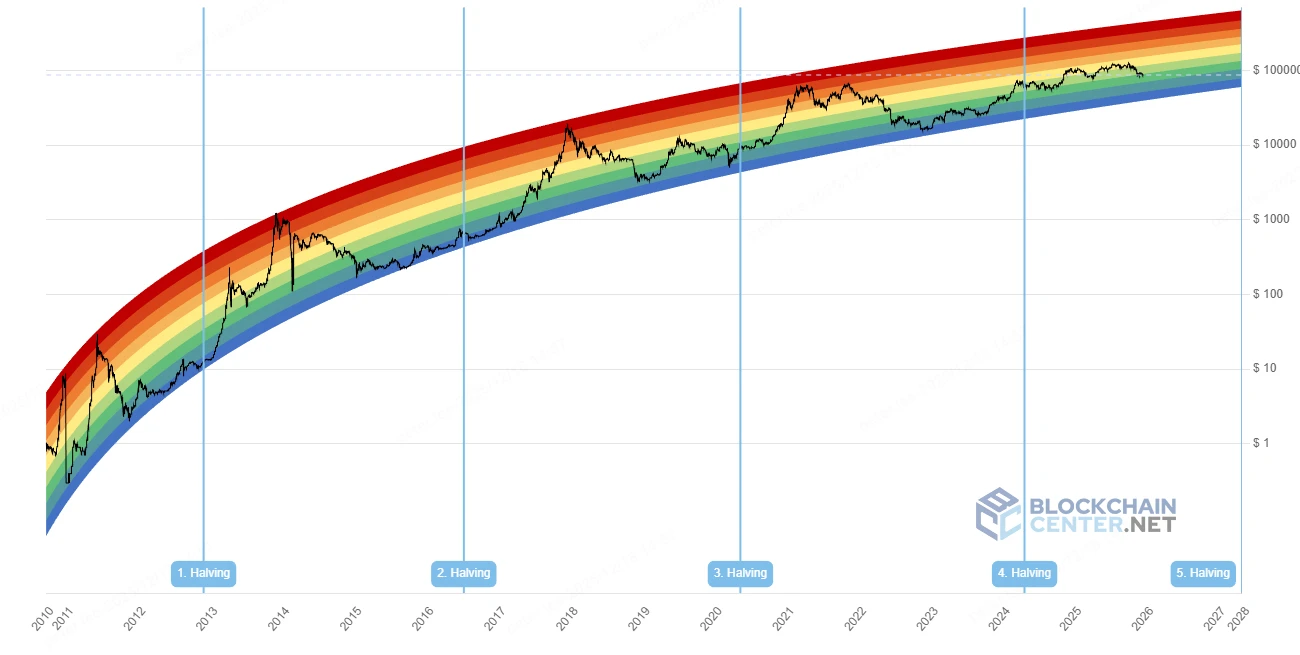
Source: https://www.blockchaincenter.net/en/bitcoin-rainbow-chart/
4. 2-Year MA Multiplier: Has the Multiple Peaked?
The 2-Year MA Multiplier (also known as the Golden Ratio Multiplier) identifies price resistance zones by multiplying the 2-year moving average by Fibonacci ratios.
Its principle combines the golden ratio (1.6) and Fibonacci sequences to evaluate the multiple of the price relative to the long-term average: a high multiple indicates overheating, signaling a correction. In other words, a high multiple means the price has "deviated too far from the long-term trend," accumulating risk.
Historically, the 2-Year MA Multiplier has shown extreme multiples before each bull market peak:
2017 peak: The indicator differed from the price by up to 10 times, with the price crossing above 2 Yr MA *5 one month before the peak;
2021 double top: Exceeded 5 times, with the price just touching 2 Yr MA *5 before the first top;
Currently (Q4 2025), the multiple is in the 2~3 range, not yet entering the high multiple zone.
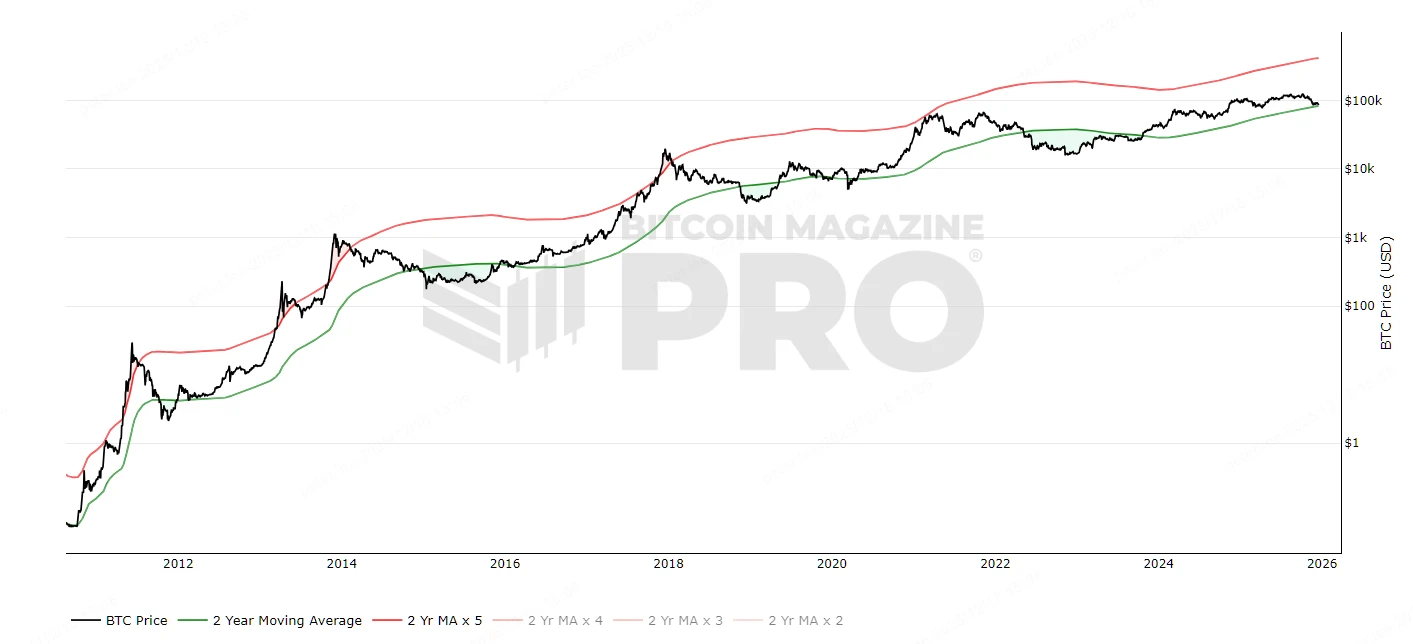
Source: https://www.bitcoinmagazinepro.com/charts/bitcoin-investor-tool/
5. Bitcoin 4-Year Moving Average: Is the Price Far Above the Long-Term Average?
The Bitcoin 4-Year Moving Average calculates the 4-year price average to assess Bitcoin's macro trend.
Its principle smooths out cyclical fluctuations: a price far above the average indicates overheating; closeness to the average indicates equilibrium. In other words, a large deviation means a "cyclical bubble," accumulating risk.
Historically, the Bitcoin 4-Year Moving Average has shown extreme price deviations before each bull market peak:
2017 peak: The indicator reached 16;
2021 double top: Reached 6 at the first top, followed by a crash;
Currently (Q4 2025), the price reached a maximum of 2.3, showing a decreasing peak trend.
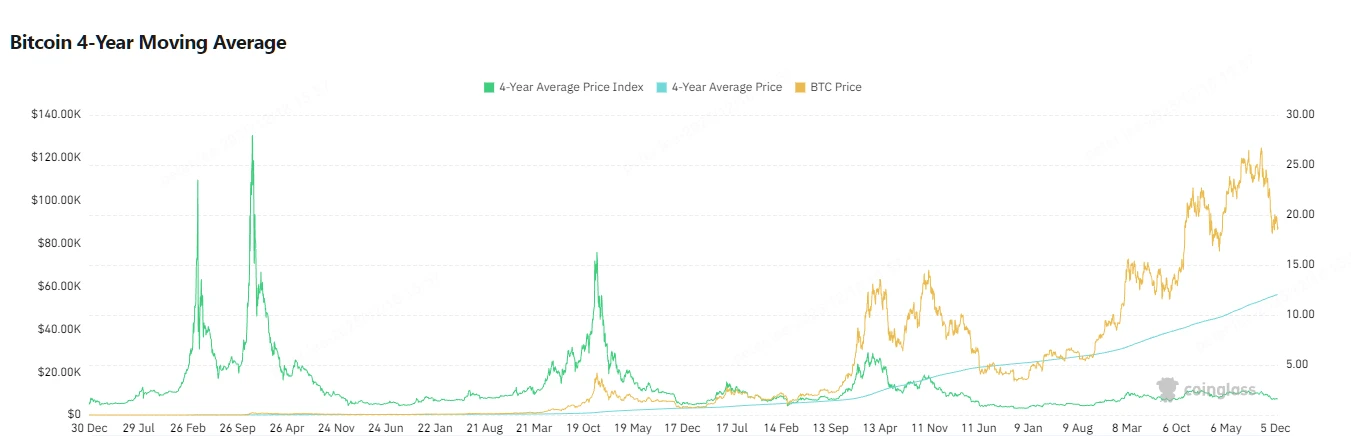
Source: https://www.coinglass.com/pro/i/four-year-moving-average
6. Bitcoin MVRV Z-Score: Has Valuation Entered the Risk Zone?
The MVRV Z-Score is a classic on-chain indicator for judging whether Bitcoin's valuation has "deviated from its true value."
Its principle compares Bitcoin's current market cap to its "realized cap" (the total cost basis of all coins) and calculates the standard deviation of the difference. In other words: a higher Z-Score means most people are in a state of unrealized profits, the market is "making too much money," and risk is accumulating.
Historically, the MVRV Z-Score has shown extreme spikes before each bull market peak:
2017 peak: Approached 10, a historical extreme;
2021 double top: Exceeded 7 at the first top, followed by a market crash;
Currently (Q4 2025), the Z-Score is in the 2~4 range, indicating neutral valuation.
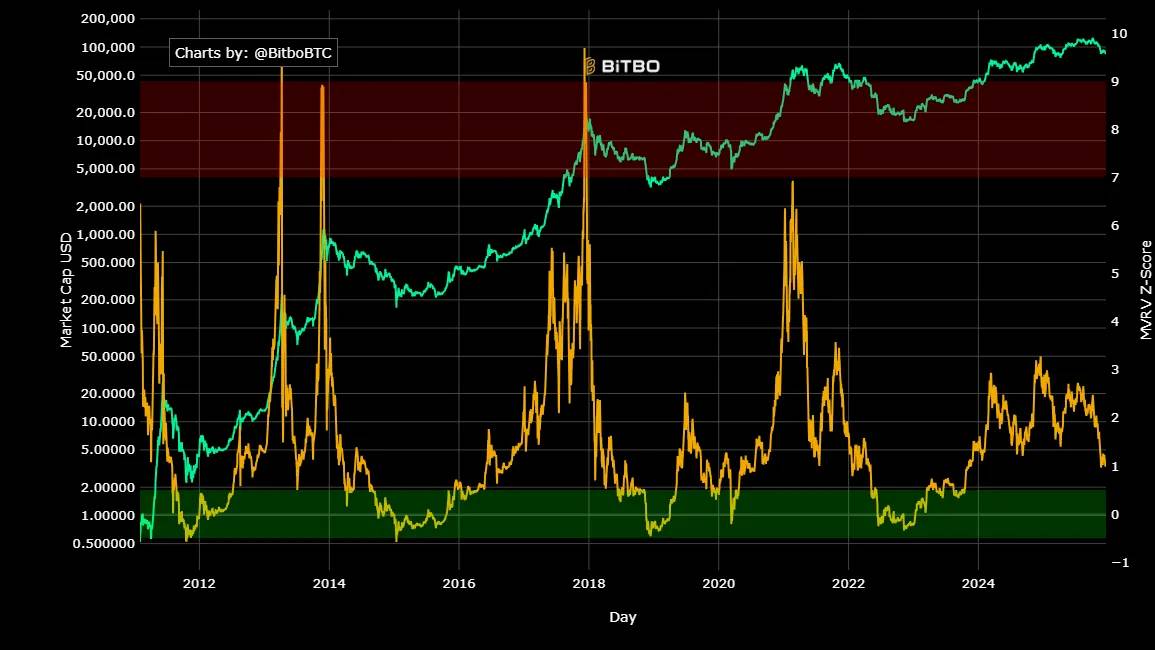
Source: https://charts.bitbo.io/mvrv-z-score
It is worth mentioning that the MVRV Rate adds statistical analysis to MVRV, measuring the standard deviation between the current MVRV and its historical average. This standardization helps identify when Bitcoin is trading above or below "fair value." However, as shown below, the peak values of this indicator at each bull market top have shown a decreasing trend, and the price has even diverged from the peaks, greatly increasing the difficulty of using this indicator to predict tops.
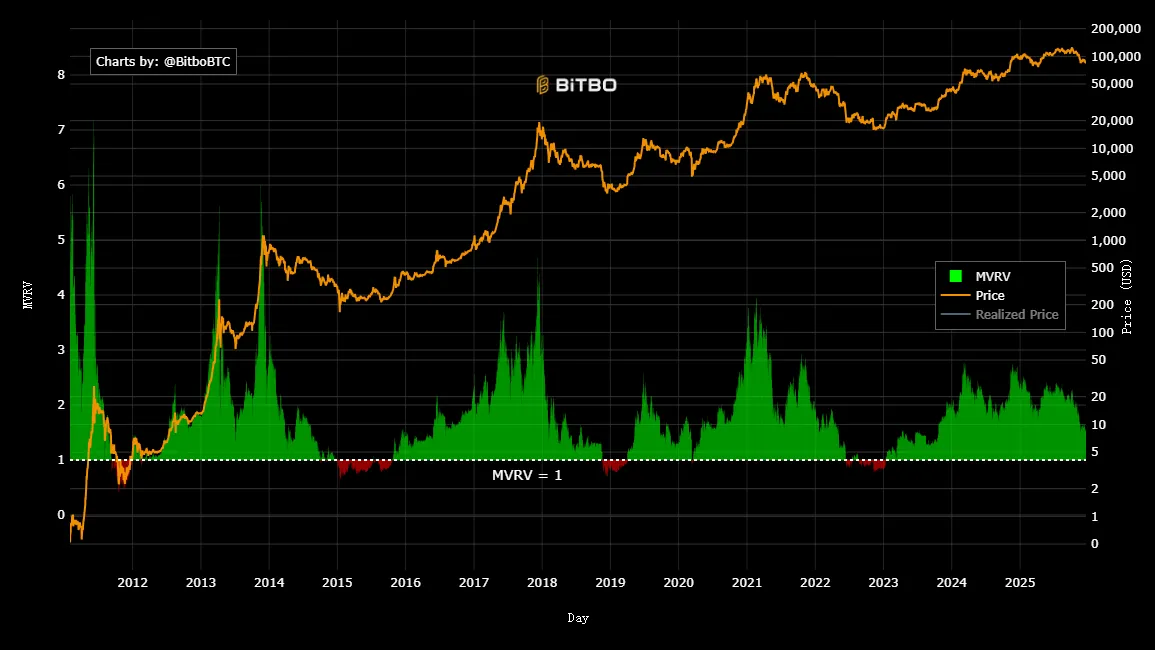
Source: https://charts.bitbo.io/mvrv
7. Altcoin Season Index: Has Altcoin Season Started?
The Altcoin Season Index tracks the performance of the top 100 altcoins relative to Bitcoin to assess whether an "alt season" has begun.
Its principle is based on relative performance: an index above 75 indicates the start of an alt season, often occurring after a BTC top, as funds flow from BTC to alts. In other words, a high index means BTC's dominance is weakening, and market risk is accumulating through diversification.
Historically, each bull market peak has ended with the狂欢 (狂欢) of an alt season as a closing signal:
2017 peak: Exceeded 90, alt season erupted;
2021 double top: Exceeded 80, followed by a BTC correction;
Currently (Q4 2025), the index is in the 30~40 range, with the altcoin sector performing sluggishly. In fact, since the start of this BTC bull run, this indicator has not even reached 60 at its highest, possibly due to insufficient liquidity and an oversupply of new coins.
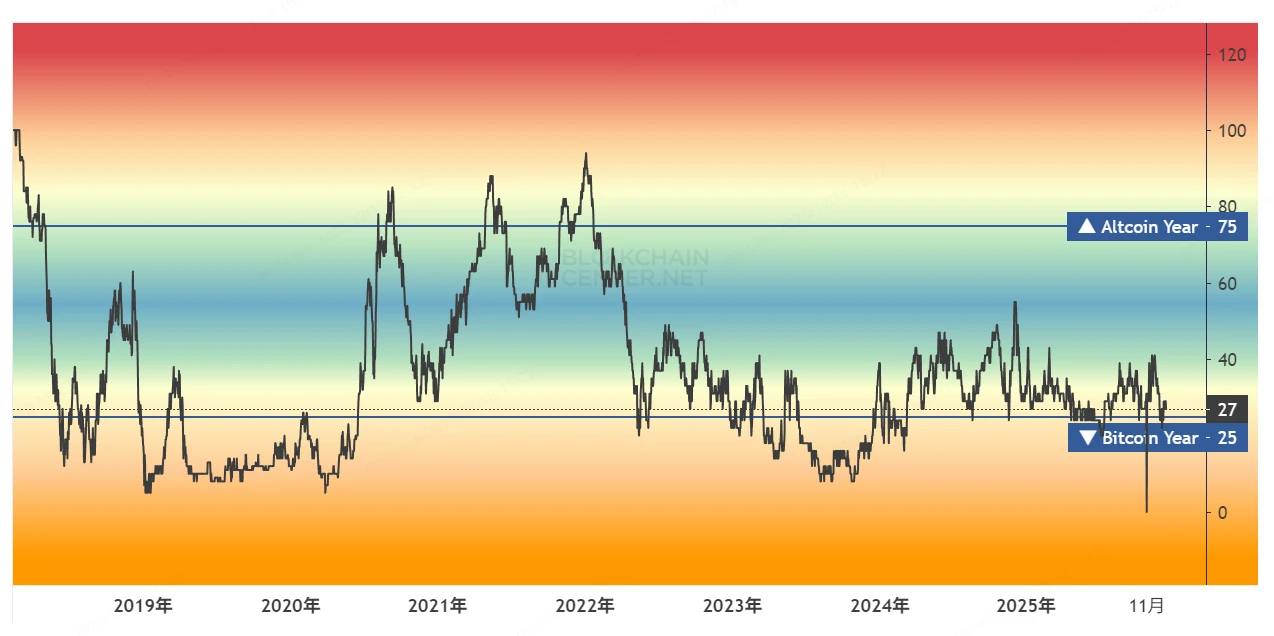
Source: https://www.blockchaincenter.net/en/altcoin-season-index
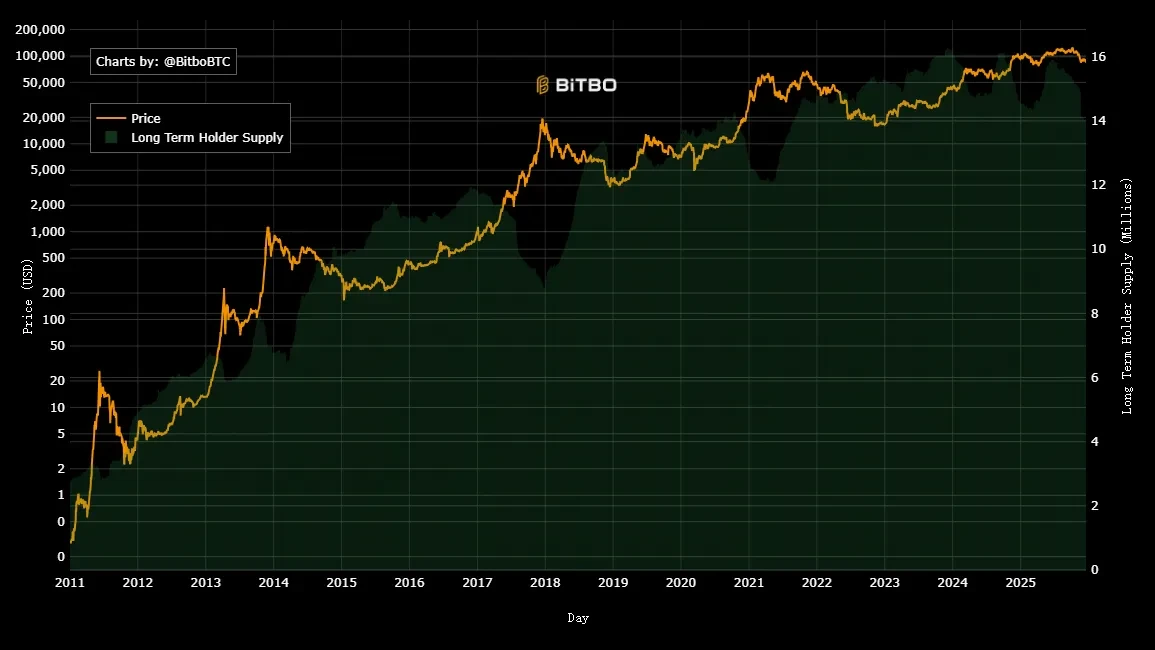
8. Bitcoin Long Term Holder Supply (LTH): Is Long-Term Holder Supply Decreasing?
Bitcoin Long Term Holder Supply (LTH) tracks the supply of Bitcoin held for more than 155 days, reflecting HODLer behavior.
Its principle observes supply changes: at tops, LTHs often sell to realize profits; at bottoms, they accumulate. In other words, a decrease in LTH supply means "smart money" is exiting, indicating high risk.
Historically, LTH has also shown significant decreases before each bull market peak:
2017 peak: The selling period lasted a year, reaching a selling climax at the top;
2021 double top: The first top followed a trend of continuous selling for half a year, but the accumulation at the second top reached a historical high;
Currently (Q4 2025), slow selling has been ongoing for half a year, but the top in October does not align with historical patterns.
Source: https://charts.bitbo.io/long-term-holder-supply
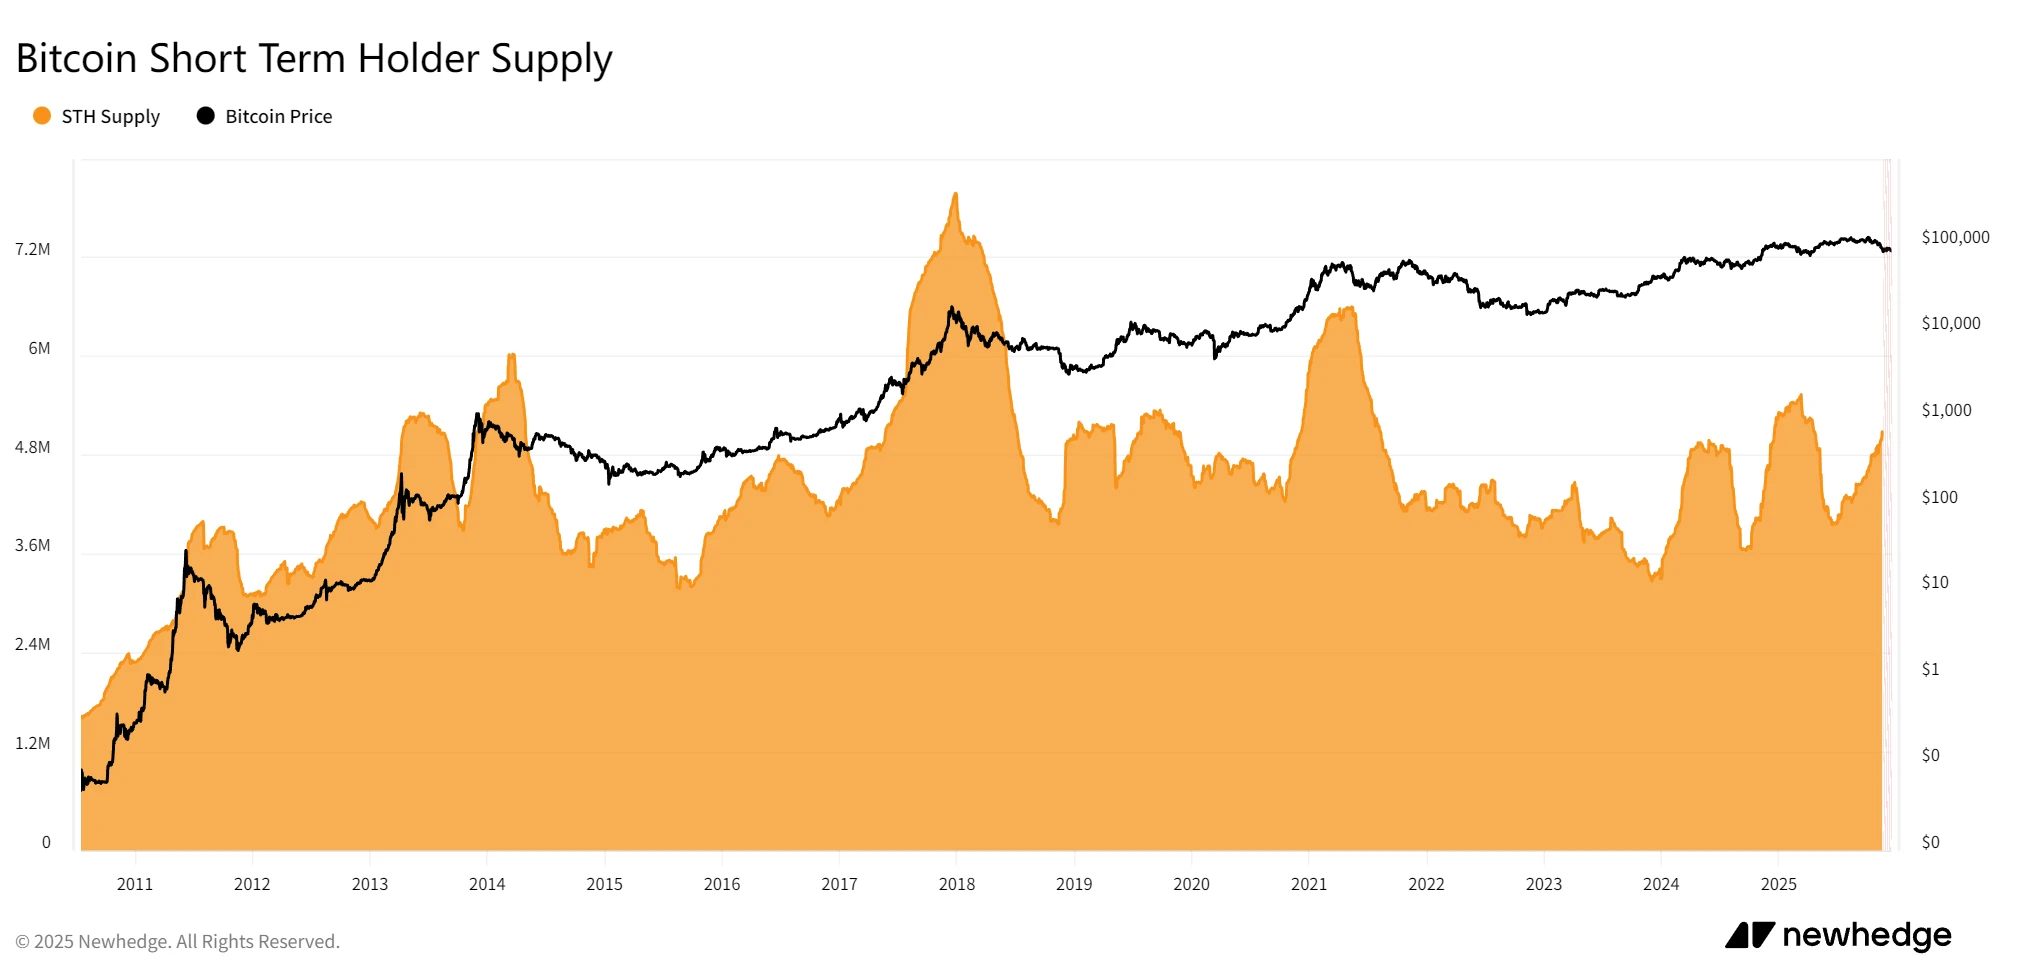
9. Bitcoin Short Term Holder Supply (STH): Has Short-Term Holder Supply Surged?
Bitcoin Short Term Holder Supply (STH) tracks the proportion of Bitcoin held for less than 155 days, assessing novice speculation.
Its principle captures new capital inflows: a high proportion indicates rampant speculation, often signaling a top; a low proportion indicates market maturity. In other words, high STH means "too many newcomers," making the bubble prone to bursting.
Historically, STH has shown surges before each bull market peak:
2017 peak: Nearly 8M BTC, peak speculation;
2021 double top: Nearly 6.5M BTC at the first top; the selling at the second absolute top did not reach a peak;
Currently, STH is continuously climbing, approaching 5.5M BTC, but the price peak was on October 6th, unlike the previous two bull markets where the STH peak and price top were closely aligned in time.
Source: https://newhedge.io/bitcoin/short-term-holder-supply
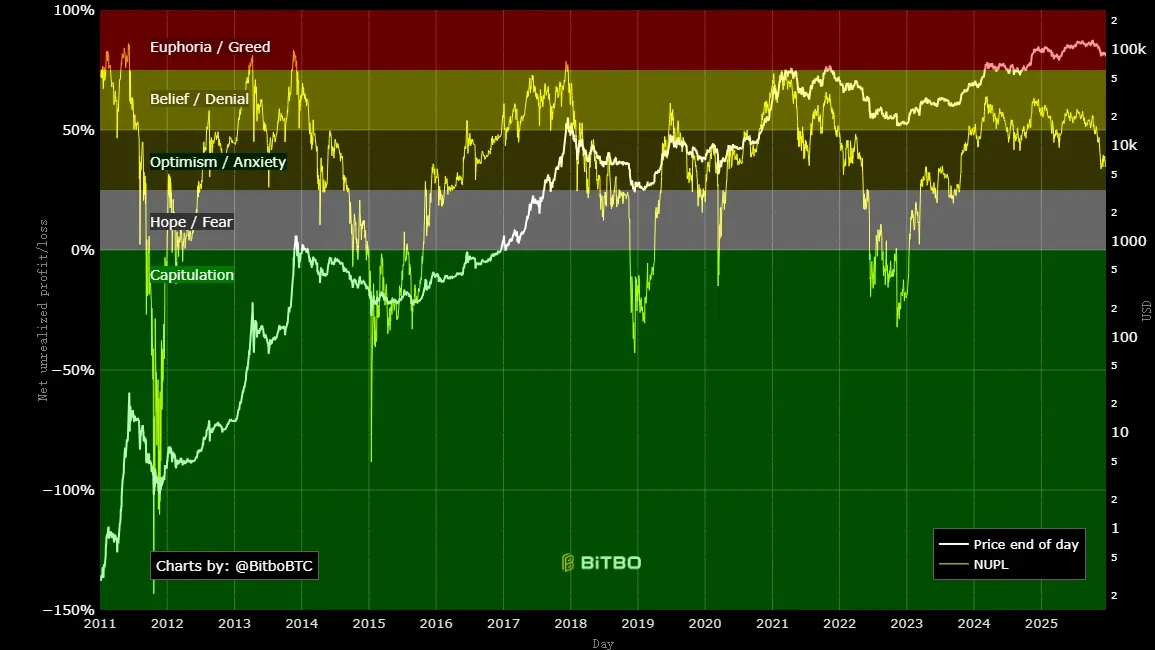
10. Bitcoin Net Unrealized Profit/Loss (NUPL): Has Unrealized Profit/Loss Entered the Greed Zone?
Bitcoin NUPL measures the overall network's ratio of unrealized profit to loss, assessing market sentiment.
Its principle is: calculate market cap minus realized cap, then divide by market cap: above 0.75 indicates greed (top signal); below 0 indicates fear (bottom). In other words, high NUPL means "everyone is in profit," indicating high selling risk.
Historically, Bitcoin NUPL has shown extremely high values before each bull market peak:
2017 peak: Exceeded 0.8, a historical extreme;
2021 double top: Exceeded 0.7, followed by a crash;
Currently (Q4 2025), NUPL reached a high of 0.64 in early March 2024 and has been fluctuating since, now falling to 0.34.
Source: https://charts.bitbo.io/net-unrealized-profit-loss
Conclusion: Structural Changes in This Bitcoin Bull Market
Judging from the above indicators, the current Bitcoin market trend does not highly align with the extreme performances seen at past bull market tops. Historical tops were often accompanied by multiple indicators overheating simultaneously, such as high Z-Score, high Puell Multiple, NUPL entering the greed zone, accompanied by LTH selling and STH surges. However, the performance of these indicators now is quite moderate.
This does not mean that the current Bitcoin price has not yet peaked; these indicators are all based on spatial judgment. The following schematic, which uses a 3-year time cycle to predict price tops,似乎 (seems to) indicate that Bitcoin has already peaked.
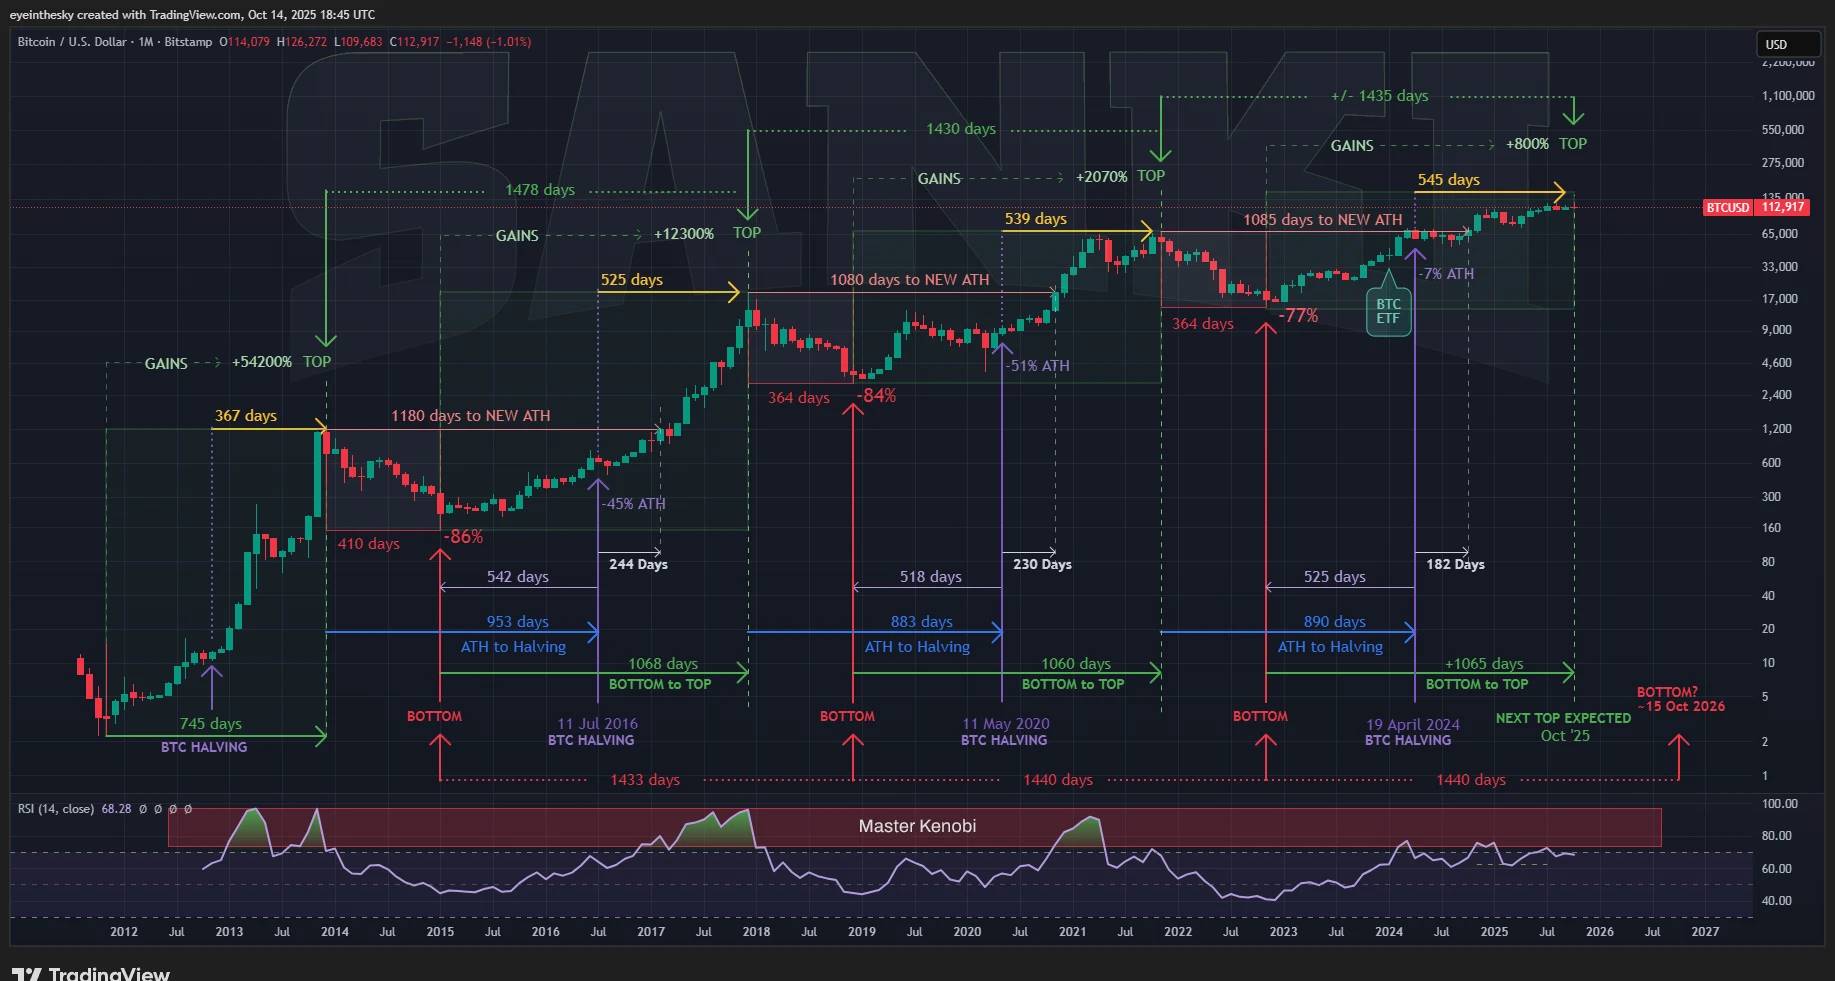
Source: https://x.com/btc_MasterPlan/status/1978180632410042828/photo/1
Of course, while analyzing the above indicators, we also found that these tools, based on linear price predictions, have already shown signs of decay in predicting top regions, exhibiting a characteristic of marginal diminishment. For example, the peak MVRV values at the 2017, 2021, and 2025 bull market tops were 10, 7, and 3 respectively. We can obviously no longer expect the MVRV to reach 7 in this bull run, and it is also not easy to predict a reliable numerical value corresponding to the top of this bull run from MVRV.
In other words, while these indicators show the market is in a neutral or moderate range, they do not confirm that the bull market is still ongoing or that a bear market has arrived. Instead, they suggest that the growth of the current Bitcoin market has become more gradual rather than explosive, which may be attributed to:
• Firstly, the introduction of Bitcoin ETFs has attracted a large amount of long-term capital, stabilizing supply dynamics. This contrasts with past retail-driven bubbles, slowing down the pace of overheating.
• Secondly, changes in global liquidity in 2025 (Fed rate cuts VS BOJ rate hikes) and geopolitical changes have repeatedly disturbed BTC's price, and the平稳 (steady) changes in various indicators恰恰 (precisely) show a more mature market.
In summary, whether the recent high on October 6th is the peak of this bull market or not, we need to acknowledge that Bitcoin price fluctuations may have broken through past historical frameworks and experiences. It seems to be undergoing a structural transformation from a "cyclical asset" to a "mainstream reserve." It is important to remind investors that these indicators may need adjusted thresholds or to be used in combination with each other to be more effective for investment decisions.
About Us
WEEX Labs is the research department under WEEX Exchange, dedicated to tracking and analyzing cryptocurrencies, blockchain technology, and emerging market trends, providing professional assessments.
The team adheres to the principles of objective, independent, and comprehensive analysis, aiming to explore cutting-edge trends and investment opportunities through rigorous research methods and前沿 (frontier) data analysis, outputting comprehensive, rigorous, and clear insights for the industry, and providing全方位 (all-round) construction and investment guidance for Web3 startups and investors.
Disclaimer
The views expressed in this article are for reference only and do not constitute an endorsement of any products or services discussed, nor do they constitute any investment, financial, or trading advice. Readers should consult qualified professionals before making financial decisions. Please note that WEEX Labs may restrict or prohibit all or part of the services from restricted areas.