Dogecoin Divergence Formation At This Level Could Trigger Major Move

bitcoinistPublished on 2026-02-19Last updated on 2026-02-19

Abstract

Dogecoin (DOGE) is approaching a critical support level around $0.10, which could determine its next major price movement. Analyst NaBer highlights that a reaction at this zone could form a divergence—a technical pattern often signaling a trend reversal. He notes that DOGE is compressing near a key support band between $0.07 and $0.10, with the Relative Strength Index (RSI) showing flattening momentum. A divergence formation, coupled with lower time frame buying volume, could indicate a potential reversal. Meanwhile, Trader Tardigrade observes that DOGE has broken out of a bearish descending channel into a bullish ascending structure, suggesting a trend reversal with a possible rally toward $0.165.

The price of Dogecoin (DOGE) is steadily approaching a critical level that could shape its next significant move. According to a crypto analyst closely tracking the meme coin’s price action, a reaction at this key level could form a “divergence,” a technical pattern often associated with a major trend reversal.

Dogecoin Divergence Setup Could Trigger Next Move

On Tuesday, February 17, crypto market analyst NaBer shared fresh updates on Dogecoin in an X post, providing his latest insights into the meme coin’s recent price action. Specifically, he highlighted a key horizontal zone around $0.10 on the DOGE chart, noting that this area would be his primary watch zone if he were considering adding more to his position.

The analyst admitted to already holding some DOGE tokens at around $0.10 and outlined a simple plan based on whether the meme coin can hold or form a divergence. The one-week chart shared in the post shows Dogecoin’s price compressing directly above a long-standing support band that previously acted as resistance during earlier cycles. This support is marked by a green horizontal zone around $0.07 and $0.10.

Interestingly, NaBer’s focus is not only on horizontal support but also on the structure. The chart shows a sequence of lower highs, with a recent swing high that has fallen well below previous peaks. At the same time, the weekly candles are grinding into support, with a slight descending trendline pressing down from the right and price action tightening into a narrowing wedge against the horizontal support.

Source: Chart from NaBer on X

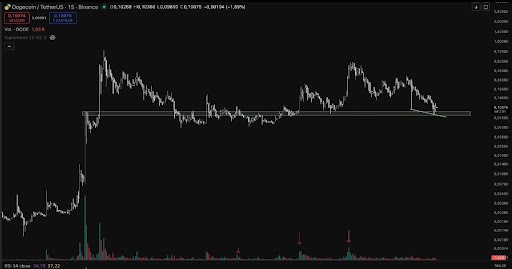
While Dogecoin’s price has been making new lows around the $0.10 support, the Relative Strength Index (RSI) in the chart is at 34.78, down from a previous reading of 37.22, indicating that momentum is flattening. NaBer has said he wants to see a possible divergence and, ideally, some Lower Time Frame (LTF) volume stepping in, signaling that buyers are absorbing supply at this range.

The analyst has also made it clear that he intends to closely watch for an ABC structure or an LTF impulse before making any aggressive projections. He agreed that an impulsive move will be enough confirmation of a divergence formation.

DOGE Bearish Channel Flips Bullish

In his latest Dogecoin analysis, crypto expert Trader Tardigrade stated that the DOGE price has officially transitioned from a descending channel downtrend into an ascending channel uptrend. According to him, the meme coin’s price recently broke out of its bearish structure and tested the lower support below $0.083.

After this, Dogecoin entered a new bullish channel and is now trending upwards within higher lows and higher highs. Trader Tardigrade has characterized this price behavior as a textbook trend reversal. He said Dogecoin has finally shifted momentum, projecting a possible price rally toward $0.165.

DOGE trading at $0.10 on the 1D chart | Source: DOGEUSDT on Tradingview.com

Related Questions

QWhat critical level is Dogecoin approaching that could shape its next significant move?

ADogecoin is approaching a critical horizontal support zone around $0.10, which could shape its next significant move.

QAccording to analyst NaBer, what technical pattern could form at the key level, and what does it often signal?

AAccording to NaBer, a 'divergence' could form at the key level, which is a technical pattern often associated with a major trend reversal.

QWhat does the Relative Strength Index (RSI) reading of 34.78 indicate about Dogecoin's momentum?

AThe RSI reading of 34.78, down from a previous 37.22, indicates that momentum is flattening.

QWhat specific price structure does analyst Trader Tardigrade say Dogecoin has transitioned into?

ATrader Tardigrade states that Dogecoin has officially transitioned from a descending channel downtrend into an ascending channel uptrend, characterized by higher lows and higher highs.

QWhat price target does Trader Tardigrade project for Dogecoin following its trend reversal?

ATrader Tardigrade projects a possible price rally toward $0.165 for Dogecoin following its trend reversal.

Related Reads

Data Modeling: How to Improve the Quality of Interaction on Polymarket?

Polymarket, a leading prediction market platform, is anticipated to have one of the largest airdrops in the sector. This analysis provides a data-driven strategy to optimize user interactions for potential rewards. A critical finding is that public dashboards often double-count trading volume by including both sides of a trade. The true, single-sided figure is likely half of what is displayed, which will be the metric Polymarket uses internally. User distribution data reveals extreme concentration: only 0.51% of addresses profited over $1,000, and a mere 1.74% traded over $50,000. Crucially, 79% of traders have never earned even $1 in liquidity provider (LP) rewards, making LP activity a currently undervalued and highly capital-efficient interaction. Historical airdrop precedents suggest rewards will be based on active behavior—not profitability—to avoid favoring insiders. A multi-dimensional model is predicted, likely featuring: * 40% weight on trade volume (using a square root compression formula to limit whale dominance). * 35% weight on LP rewards. * 15% weight on market diversity (number of distinct markets traded in). * 10% weight on longevity (months active). The analysis advises users to accumulate genuine, on-chain provable volume across diverse markets, hold positions for 1-24 hours, and, most importantly, begin providing liquidity to accumulate LP rewards, which are a strong anti-Sybil signal. A hard cap per address is also expected to prevent excessive concentration of the airdrop.

Odaily星球日报18m ago

Data Modeling: How to Improve the Quality of Interaction on Polymarket?

Odaily星球日报18m ago

Deep Reflections Behind the OP Plunge

In a significant move, Coinbase's Base announced its departure from the Optimism OP Stack to develop its own proprietary unified architecture, causing a sharp 20% drop in $OP’s price. This event highlights the ongoing debate between two competing economic models for blockchain infrastructure: Optimism’s fully open-source, MIT-licensed approach versus Arbitrum’s “community source” model, which mandates a 10% protocol income contribution from chains built on its Orbit stack that settle outside the Arbitrum ecosystem. Optimism’s strategy emphasizes openness and network effects, attracting major projects like Base, Worldcoin, and Uniswap with its modular, permission-free stack. However, this model risks ecosystem fragmentation, as high-value chains may eventually choose independence. In contrast, Arbitrum enforces economic alignment through its revenue-sharing requirement, aiming for long-term sustainability, though it may slow initial adoption. This tension mirrors historical open-source dilemmas, such as those seen with Linux, MySQL, and WordPress, where balancing free access with sustainable funding remains challenging. In crypto, the presence of native tokens amplifies these dynamics, making economic alignment and infrastructure financing even more critical. Neither model is perfect—each involves trade-offs between growth and sustainability. The key takeaway is the need for a broader ecosystem discussion on how to fund and maintain essential public infrastructure without relying on free-riders. Base’s exit should serve as a catalyst for this conversation.

marsbit1h ago

Deep Reflections Behind the OP Plunge

marsbit1h ago

Trading

Spot
Futures

Hot Articles

How to Buy MOVE

Welcome to HTX.com! We've made purchasing Movement (MOVE) simple and convenient. Follow our step-by-step guide to embark on your crypto journey.Step 1: Create Your HTX AccountUse your email or phone number to sign up for a free account on HTX. Experience a hassle-free registration journey and unlock all features.Get My AccountStep 2: Go to Buy Crypto and Choose Your Payment MethodCredit/Debit Card: Use your Visa or Mastercard to buy Movement (MOVE) instantly.Balance: Use funds from your HTX account balance to trade seamlessly.Third Parties: We've added popular payment methods such as Google Pay and Apple Pay to enhance convenience.P2P: Trade directly with other users on HTX.Over-the-Counter (OTC): We offer tailor-made services and competitive exchange rates for traders.Step 3: Store Your Movement (MOVE)After purchasing your Movement (MOVE), store it in your HTX account. Alternatively, you can send it elsewhere via blockchain transfer or use it to trade other cryptocurrencies.Step 4: Trade Movement (MOVE)Easily trade Movement (MOVE) on HTX's spot market. Simply access your account, select your trading pair, execute your trades, and monitor in real-time. We offer a user-friendly experience for both beginners and seasoned traders.

2.9k Total ViewsPublished 2024.12.10Updated 2025.03.21

Discussions

Welcome to the HTX Community. Here, you can stay informed about the latest platform developments and gain access to professional market insights. Users' opinions on the price of MOVE (MOVE) are presented below.

活动图片