Stablecoin issuer Circle reported somewhat paradoxical second-quarter results. The on-chain transaction volume of USDC reached $14.8 trillion, while "Total Revenue and Reserve Revenue" stood at $701 million. According to Circle's unaudited earnings press release accompanying its Form 8-K, these two figures were placed in the same announcement, easily leading people to view trading volume as a direct amplifier of revenue.
Yet, when compared year-over-year, transaction volume grew by 151%, while revenue only increased by 7%. These are not two malfunctioning data lines; they reveal the true contours of Circle's business model. On-chain transaction volume records the intensity of USDC usage, while the income statement cares more about how much USDC remains in the system on average and how much return that reserve can generate in the quarter.
On-Chain Transactions Are Busy, So Why Aren't the Books Keeping Up?
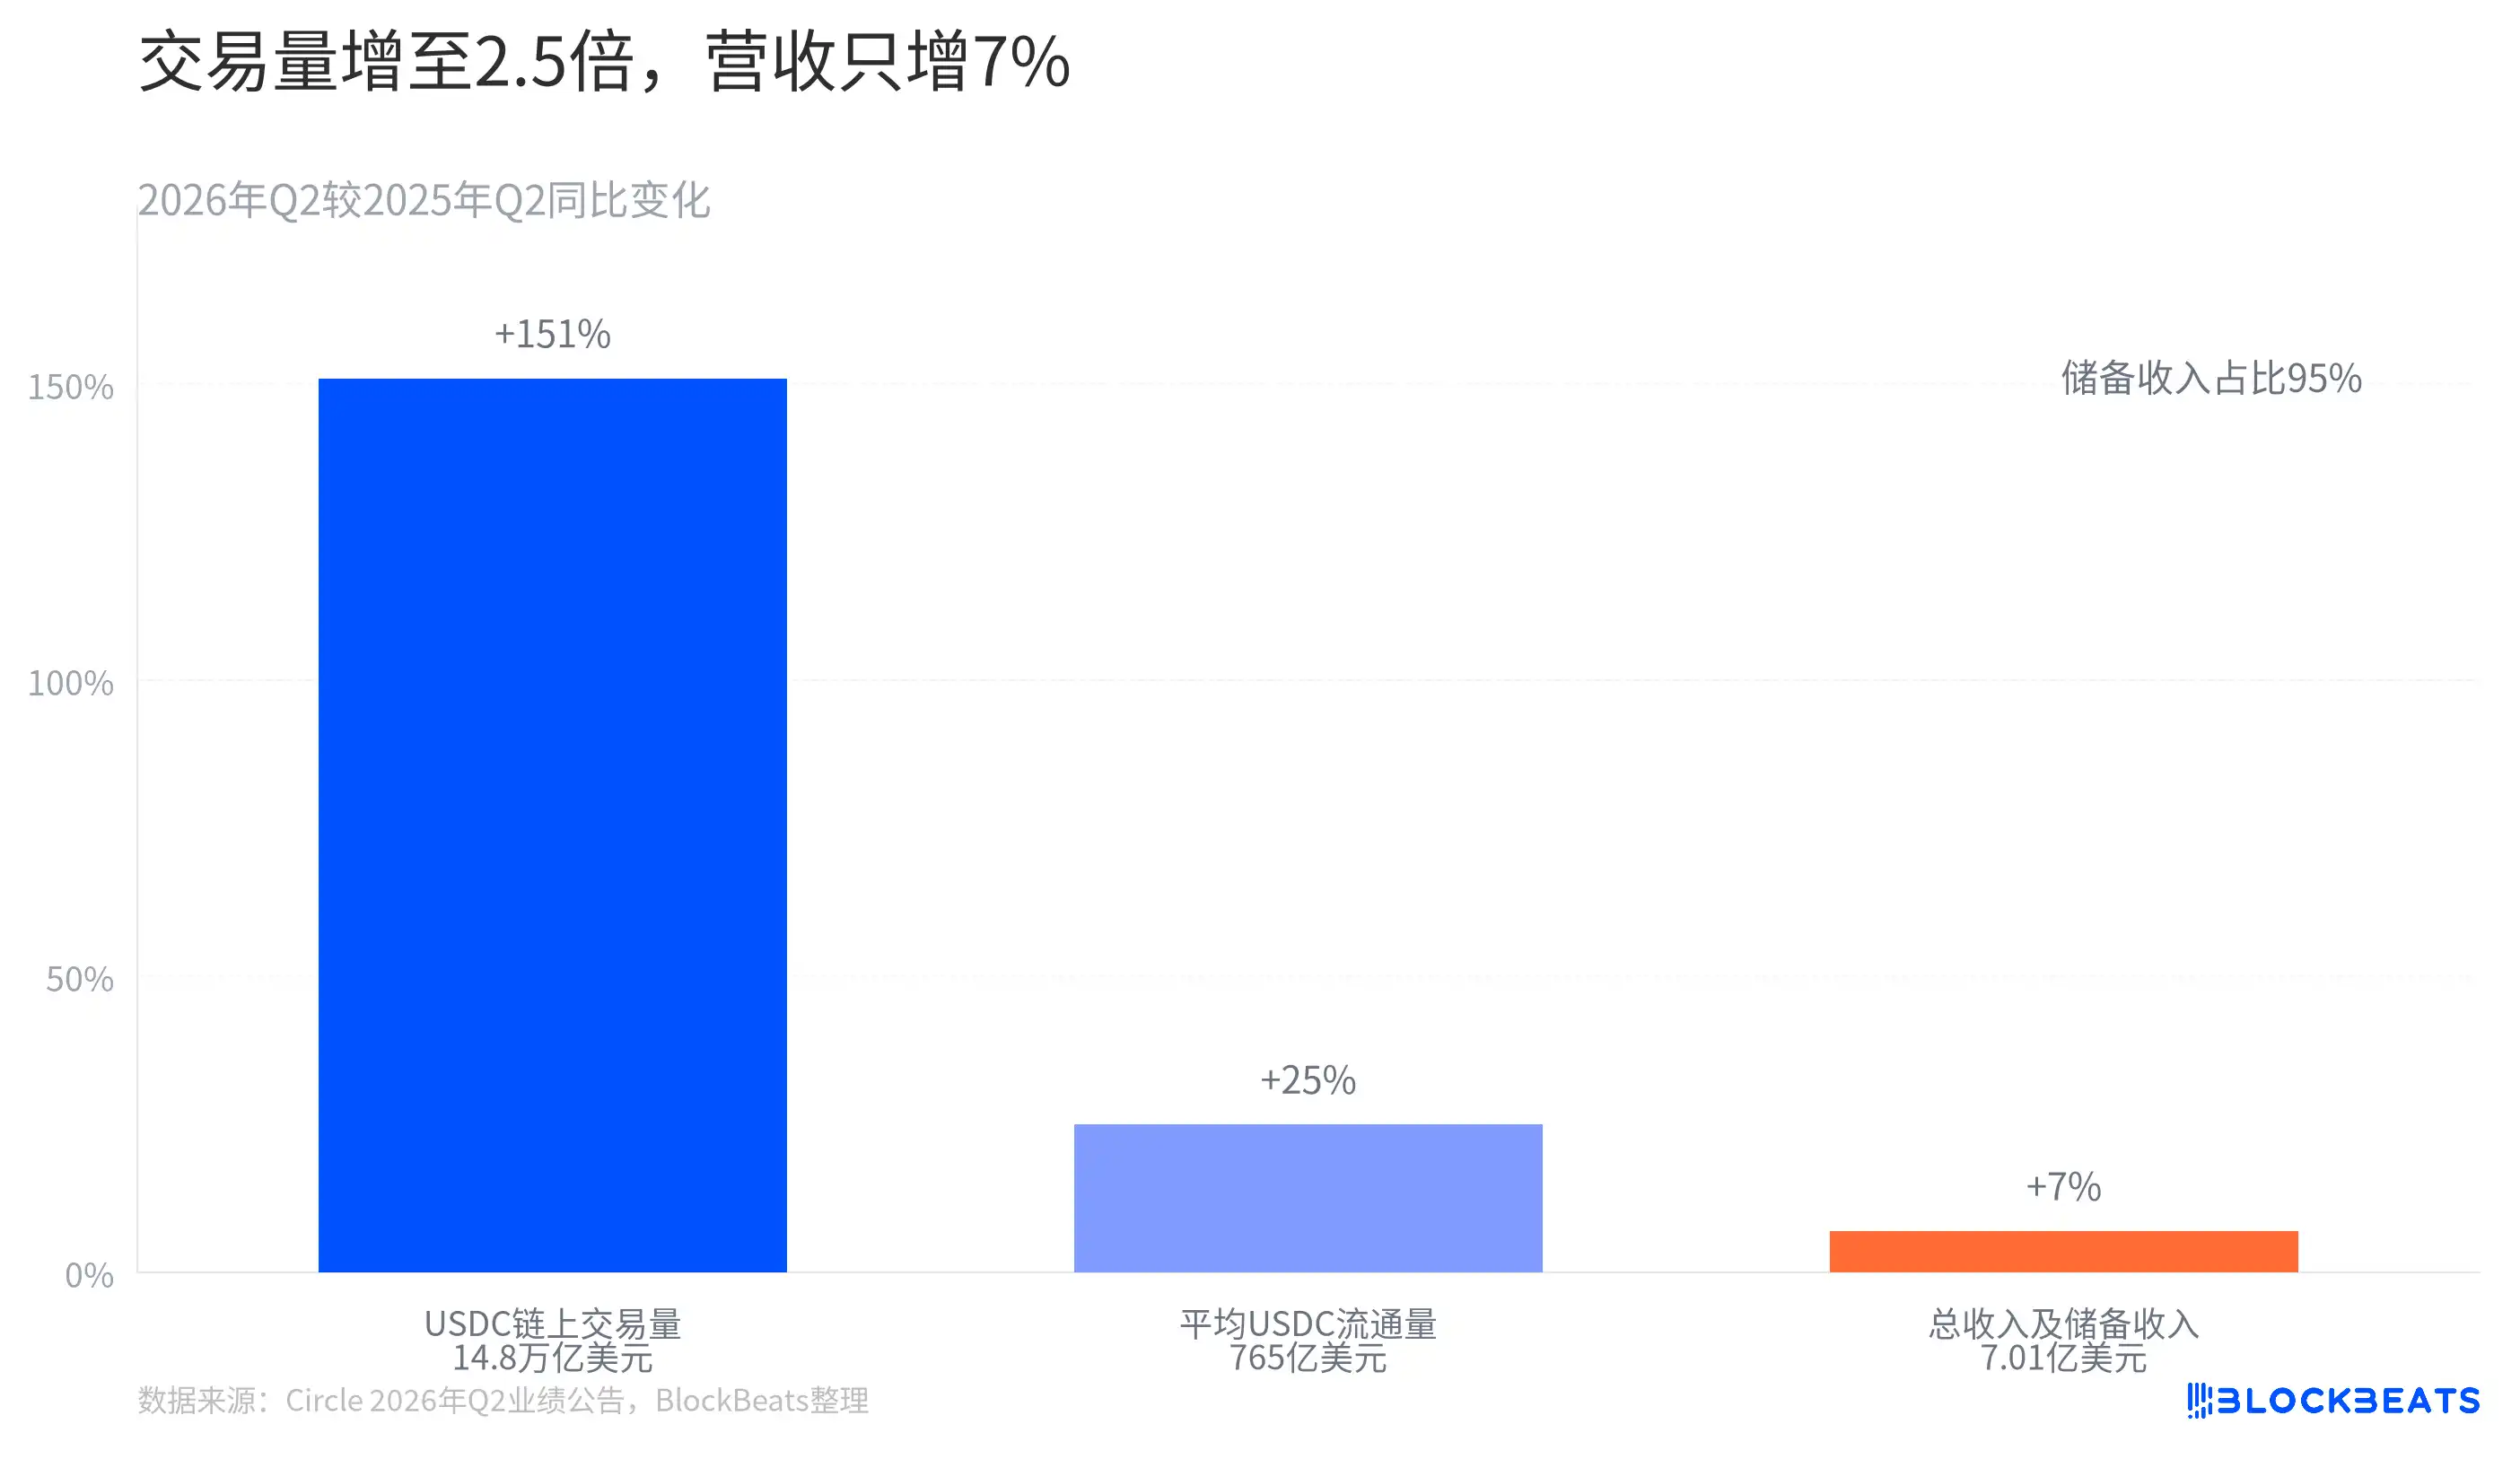
Figure 1 places three growth rates together, making the gap immediately concrete. Transaction volume is the largest blue bar this quarter, average USDC circulation sits in the middle, and revenue growth is the smallest. According to Circle's announcement, reserve revenue accounts for over 90% of "Total Revenue and Reserve Revenue". For these results, transaction volume is not the variable closest to revenue.
This relationship is not hard to understand. An on-chain transfer can indicate that USDC was mobilized for payment, exchange, or settlement, but it does not mean Circle earns a proportional fee for that specific transfer. The announcement does not list on-chain transaction volume as a revenue calculation metric. Instead, reserve revenue changes with average circulation and reserve yield—these two are the most direct levers for quarterly revenue.
Circle's other revenue for the quarter was $34 million. According to the company's announcement, the year-over-year growth primarily came from subscription and service revenue. However, the announcement does not break out Circle Payments Network, Arc, or Agent Stack as separate revenue items. Directly converting the operational progress of these products into revenue would skip a segment the company has not yet disclosed.
Why Didn't the Extra USDC Bring a Proportionate Increase in Revenue?
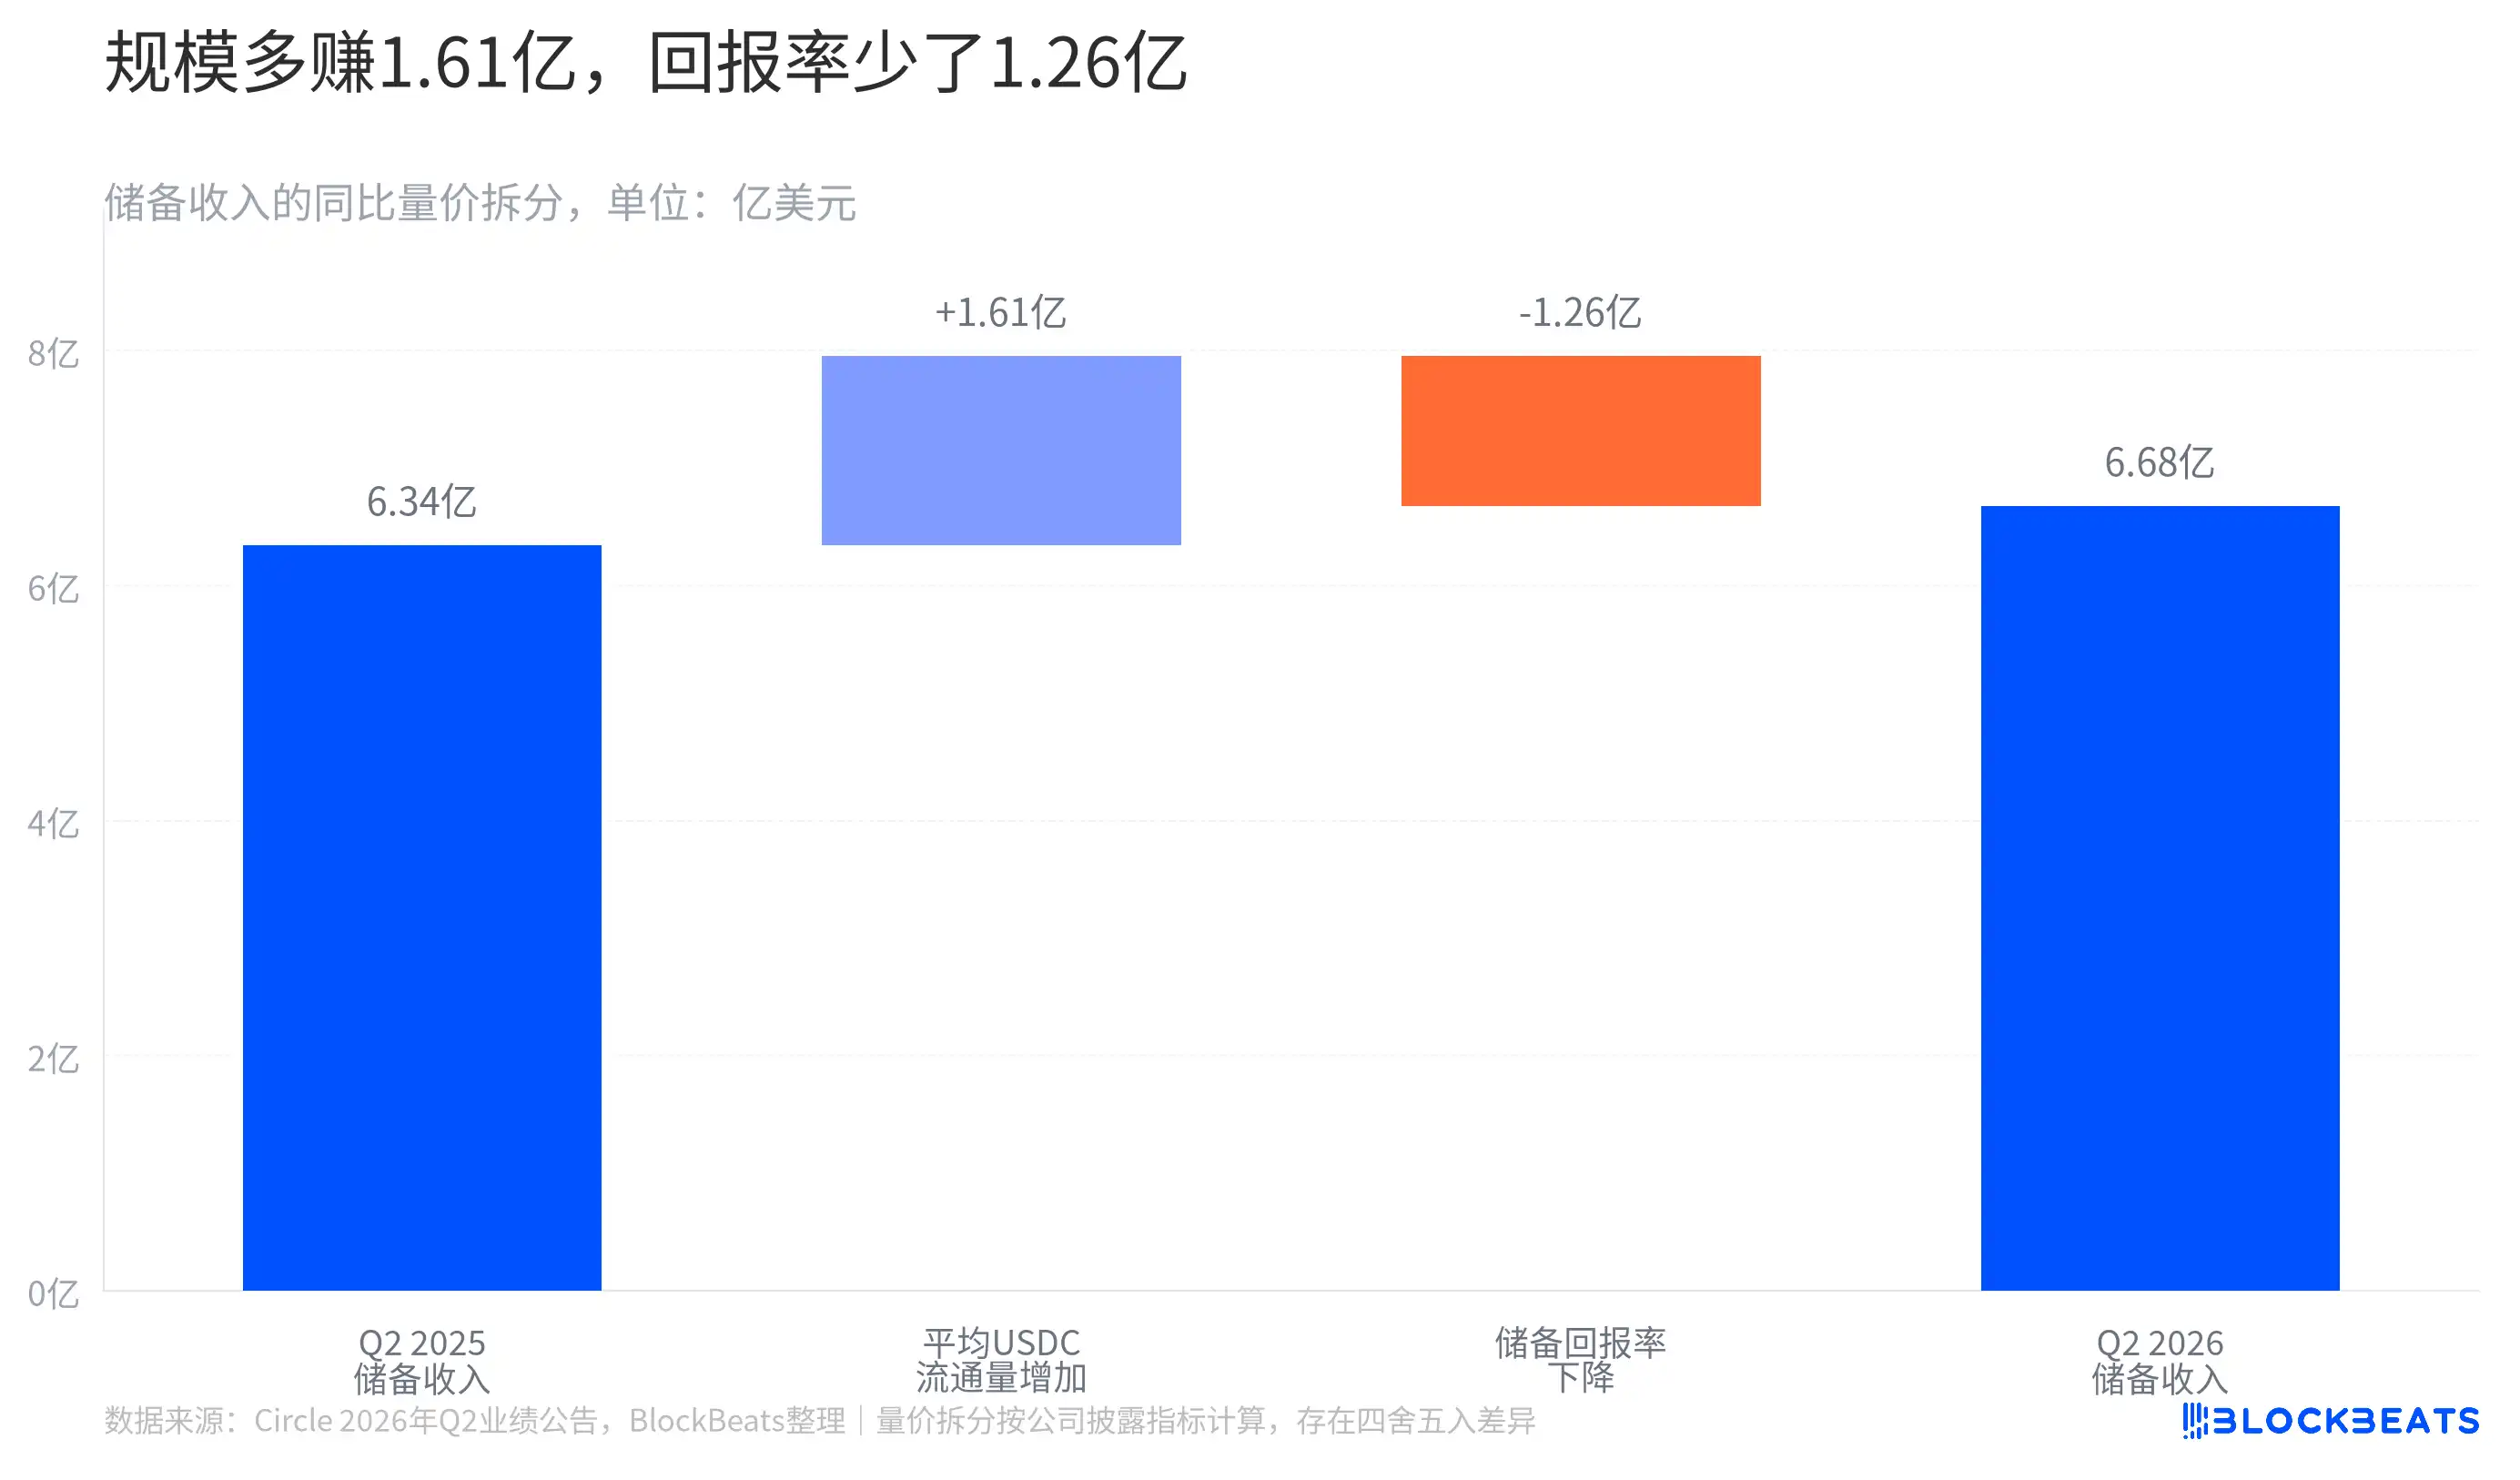
Circle's explanation for reserve revenue is straightforward. According to Exhibit 99.1 of the 8-K, average USDC circulation increased by 25% year-over-year, but the reserve yield decreased by 66 basis points. One quantity grew larger, the other grew thinner, resulting in reserve revenue increasing by only about 5% compared to the same period last year.
Figure 2 breaks this down into volume and yield. The two segments of change in the chart are not a formal attribution separately disclosed by Circle but are static, quarterly estimates based on the average circulation and reserve yield disclosed by the company. If one only looks at the growth in average balance, reserve revenue would appear significantly elevated. After accounting for the yield decline, almost all of that new revenue increment was erased.
It can be seen as a growing deposit. More dollars are deposited, but each dollar generates a thinner return for the quarter. The heat of on-chain activity hasn't disappeared; it must first be converted into persistently circulating USDC, then enter Circle's income statement through the reserve yield. This process is much slower than a single transaction and is also more susceptible to the interest rate environment.
This also explains why the same announcement can simultaneously contain statements like "the network is expanding" and "the current interest rate environment is slowing revenue growth." The former refers to USDC usage and distribution, the latter to the pricing of reserve returns. Both can be true simultaneously.
Before Revenue Comes In, It Must Pass Through Distribution Costs
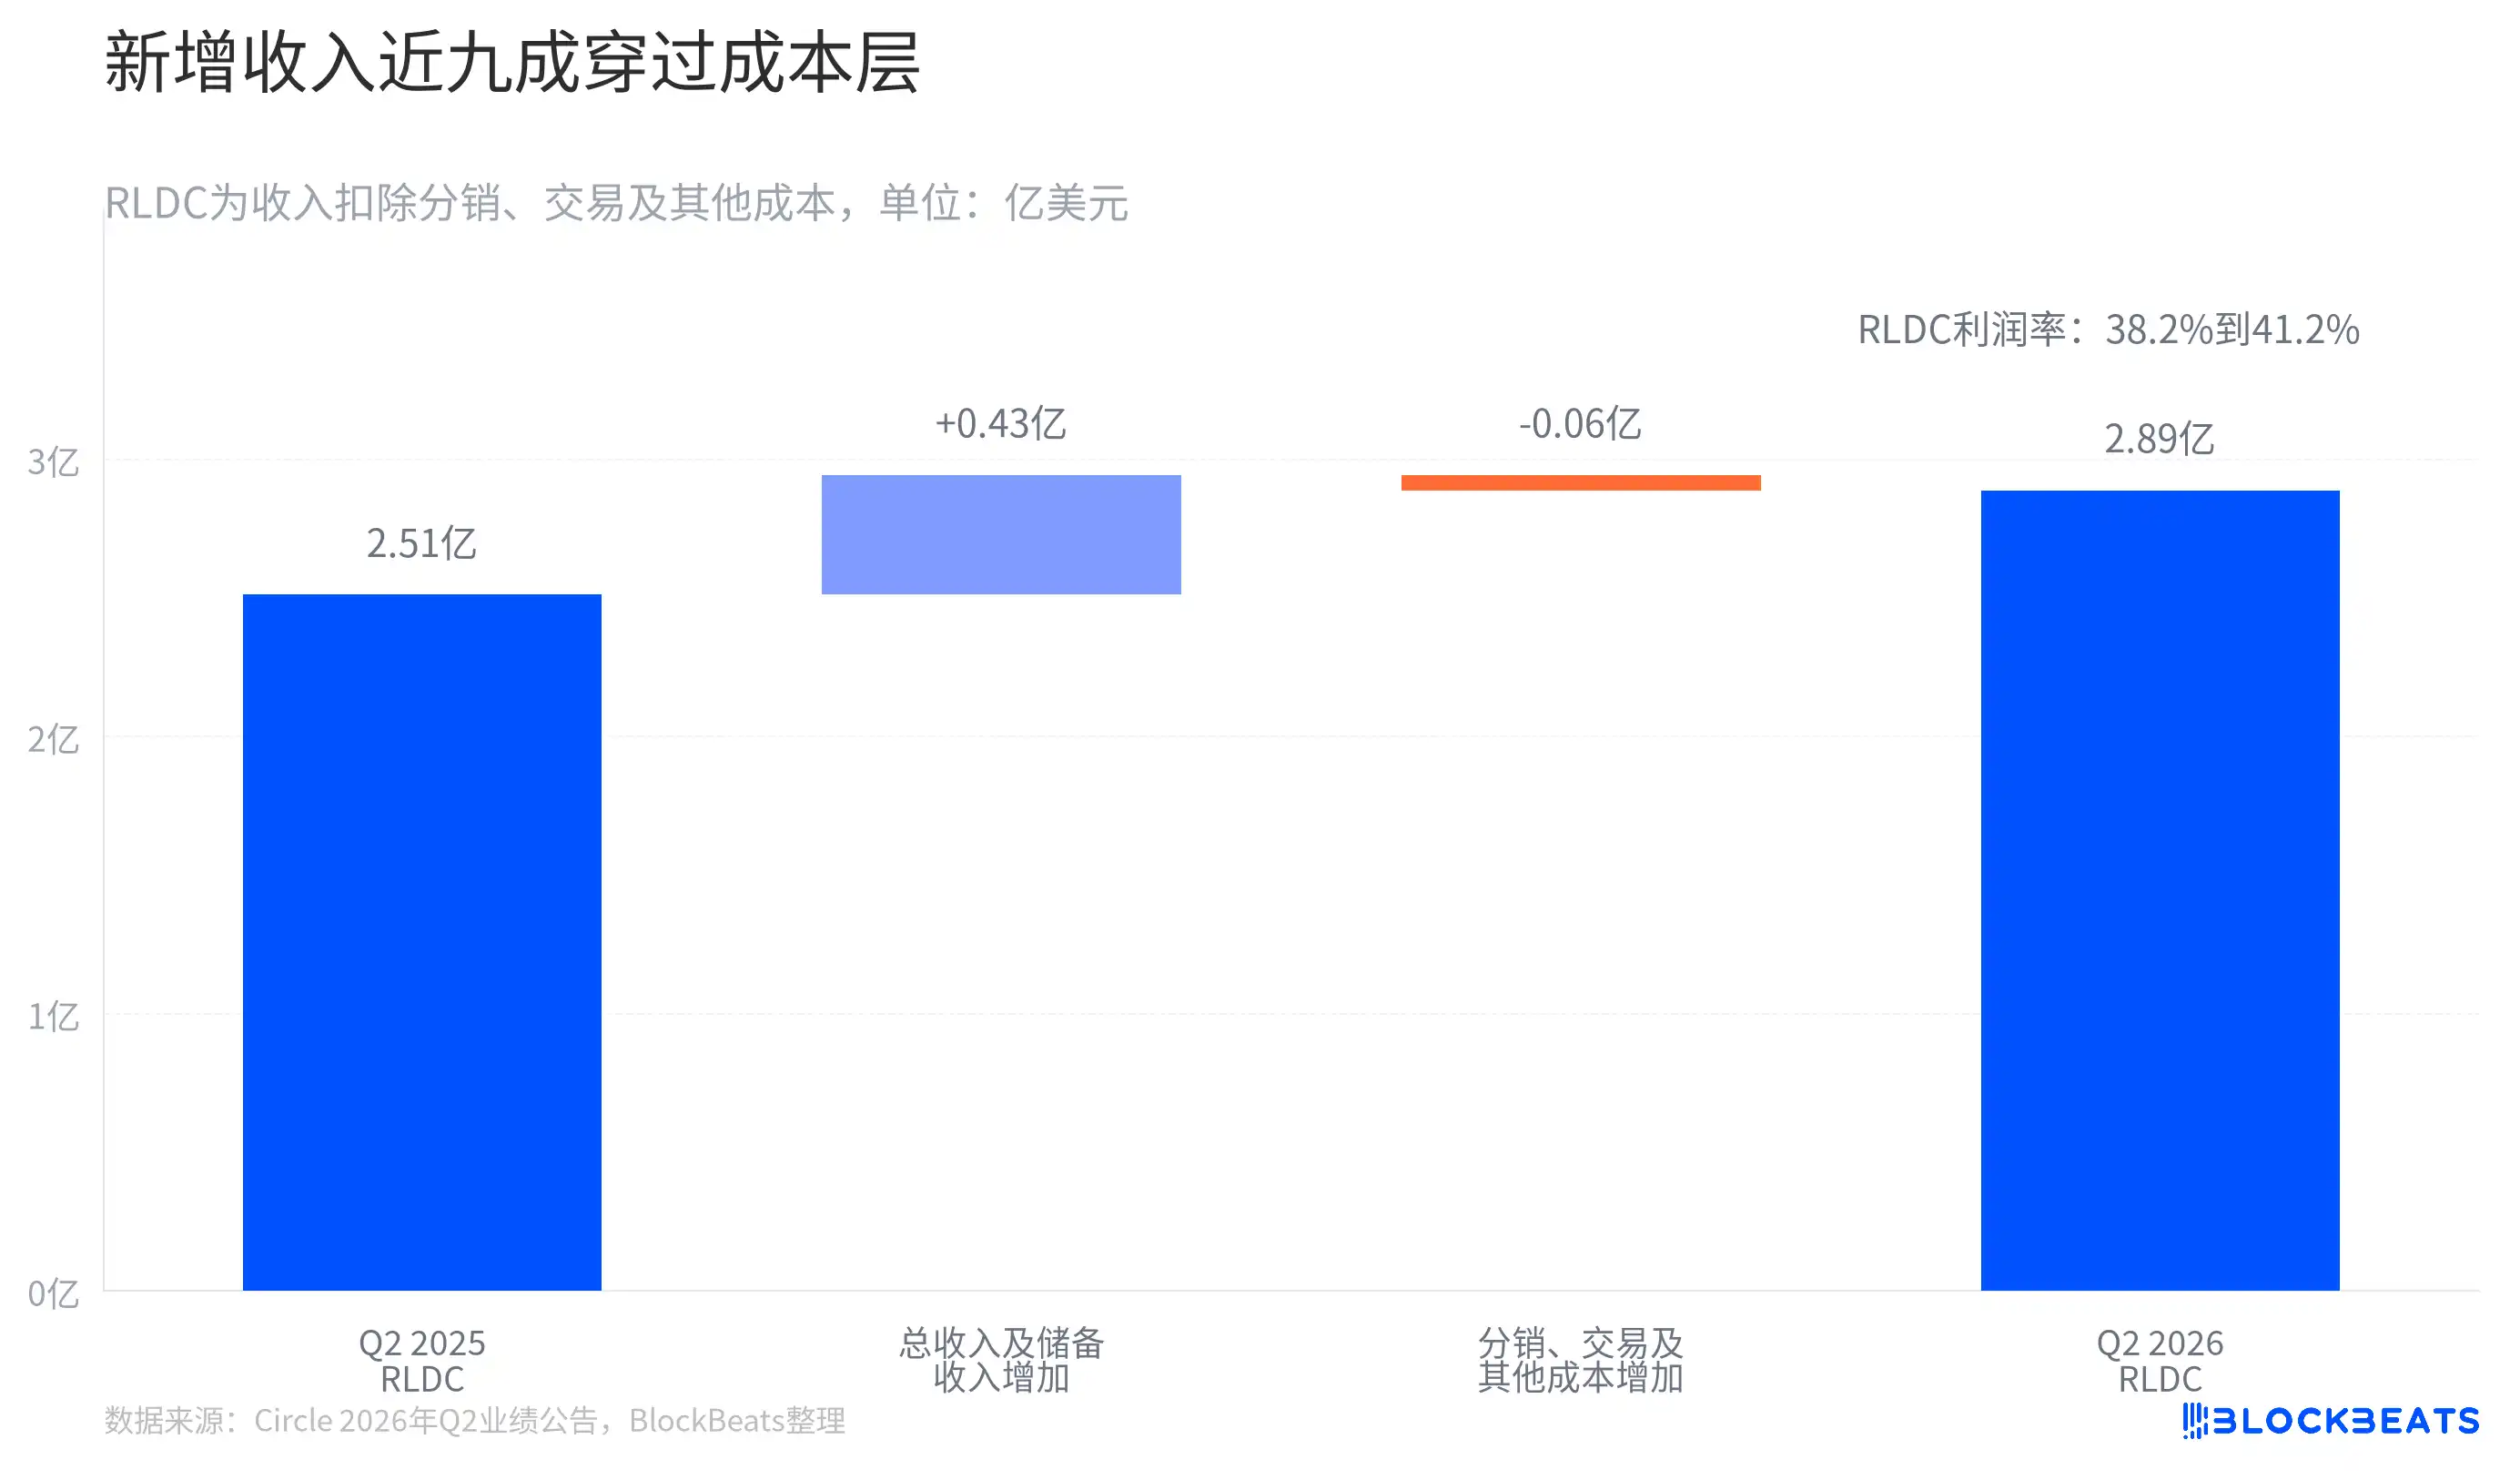
Revenue reaching Circle's hands also does not equal operating profit. The company refers to the intermediate metric after deducting "Total Distribution, Transaction and Other Costs" from "Total Revenue and Reserve Revenue" as RLDC. In Figure 3, this number increased from $251 million to $289 million. According to the company's announcement, its growth rate was faster than that of Total Revenue and Reserve Revenue.
The most easily misinterpreted element in this chart is the short orange bar. It does not mean Circle paid less in costs; rather, the year-over-year increase in costs was much smaller than the increase in revenue. Based on calculations using the unrounded announcement data, nearly 90% of the incremental revenue passed through this cost layer, becoming RLDC increment. The RLDC margin also increased from 38.2% to 41.2%.
However, RLDC is not gross profit, let alone adjusted EBITDA or net profit. Operating expenses such as R&D, infrastructure, and personnel costs still follow. According to Circle's announcement, adjusted operating expenses increased by 23% year-over-year, while adjusted EBITDA only grew by 8%. Directly interpreting the improvement after distribution costs as "all new revenue stayed with the company" would be reading the financial statements a step too fast.
The quarter-over-quarter rhythm is also not as lively as the year-over-year headlines suggest. According to Circle's Q1 earnings announcement and this quarter's announcement, average USDC circulation only increased by 1.7%, and Total Revenue and Reserve Revenue only increased by 1.0%.
During the same period, adjusted operating expenses increased by 7.9%, while adjusted EBITDA decreased by 5.2%. This set of changes does not indicate business stagnation but hints at another reality. When USDC circulation only shifts slightly between quarters, investments in new products and infrastructure land on the expense statement first; the profit statement does not automatically accelerate in sync.
The New Network Shows Signals, But Revenue Boundaries Remain Beyond the Financials
Circle provided many network-level updates this quarter. According to the company's announcement, as of quarter-end, the Circle Payments Network's annualized transaction volume over the past 30 days reached $14.7 billion, with 175 financial institutions onboarded. This is a metric about network density, not quarterly revenue, and cannot be compared using the same yardstick as USDC's on-chain transaction volume.
The announcement also stated that Arc is scheduled to launch its public mainnet on September 16th, and Agent Stack already has over 900 paid services. The former remains a disclosed launch plan by the company; the latter is a service count, not a client count, revenue amount, or profit. They indicate Circle is building out infrastructure beyond stablecoin issuance, but the disclosures this quarter are insufficient to verify that these products have become a second revenue curve.
Circle's second-quarter results are, first and foremost, a scorecard determined jointly by average USDC circulation, reserve yield, and the structure of distribution costs. Transaction volume proves USDC is being used frequently; the income statement answers how that usage navigates through the two layers of reserves and cost structure.