Share
- Share
- Tweet
-
ambcryptoPublished on 2026-02-08Last updated on 2026-02-08
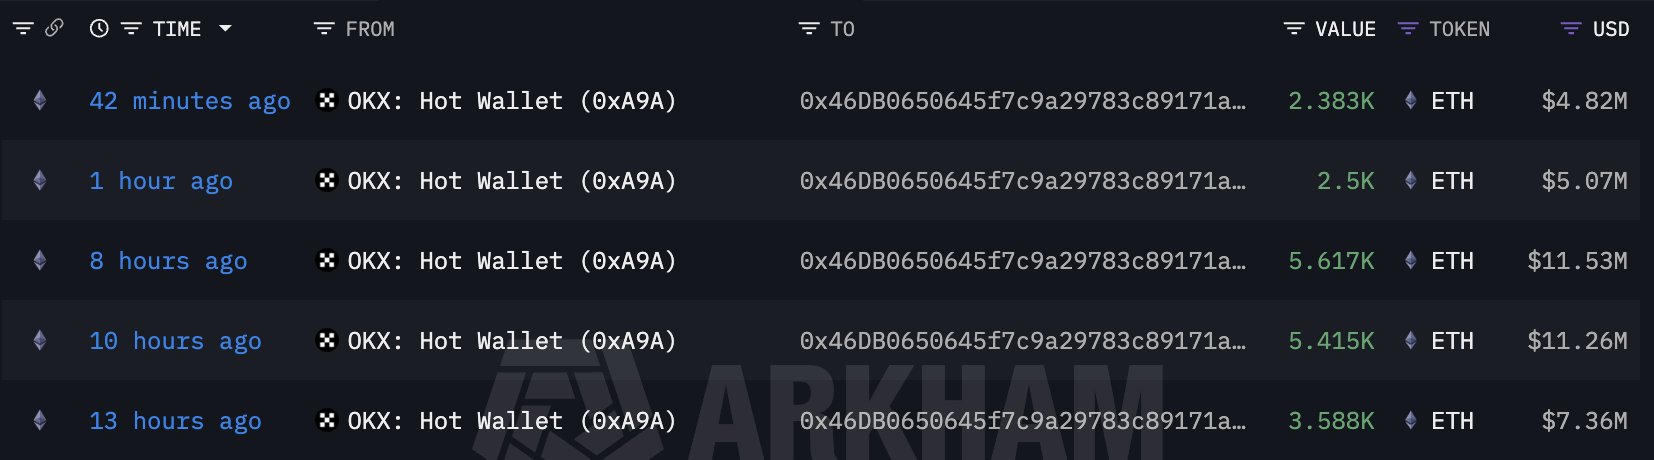
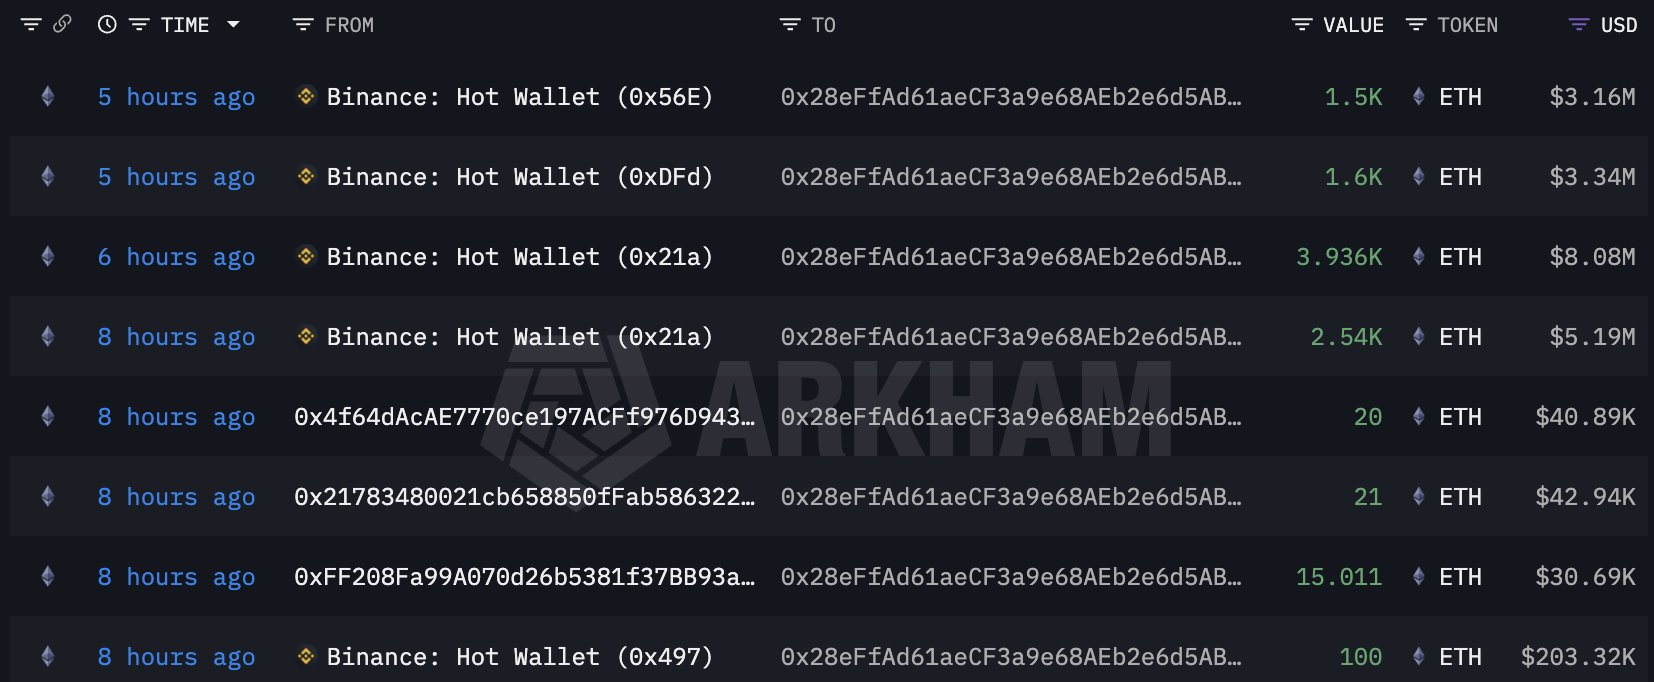
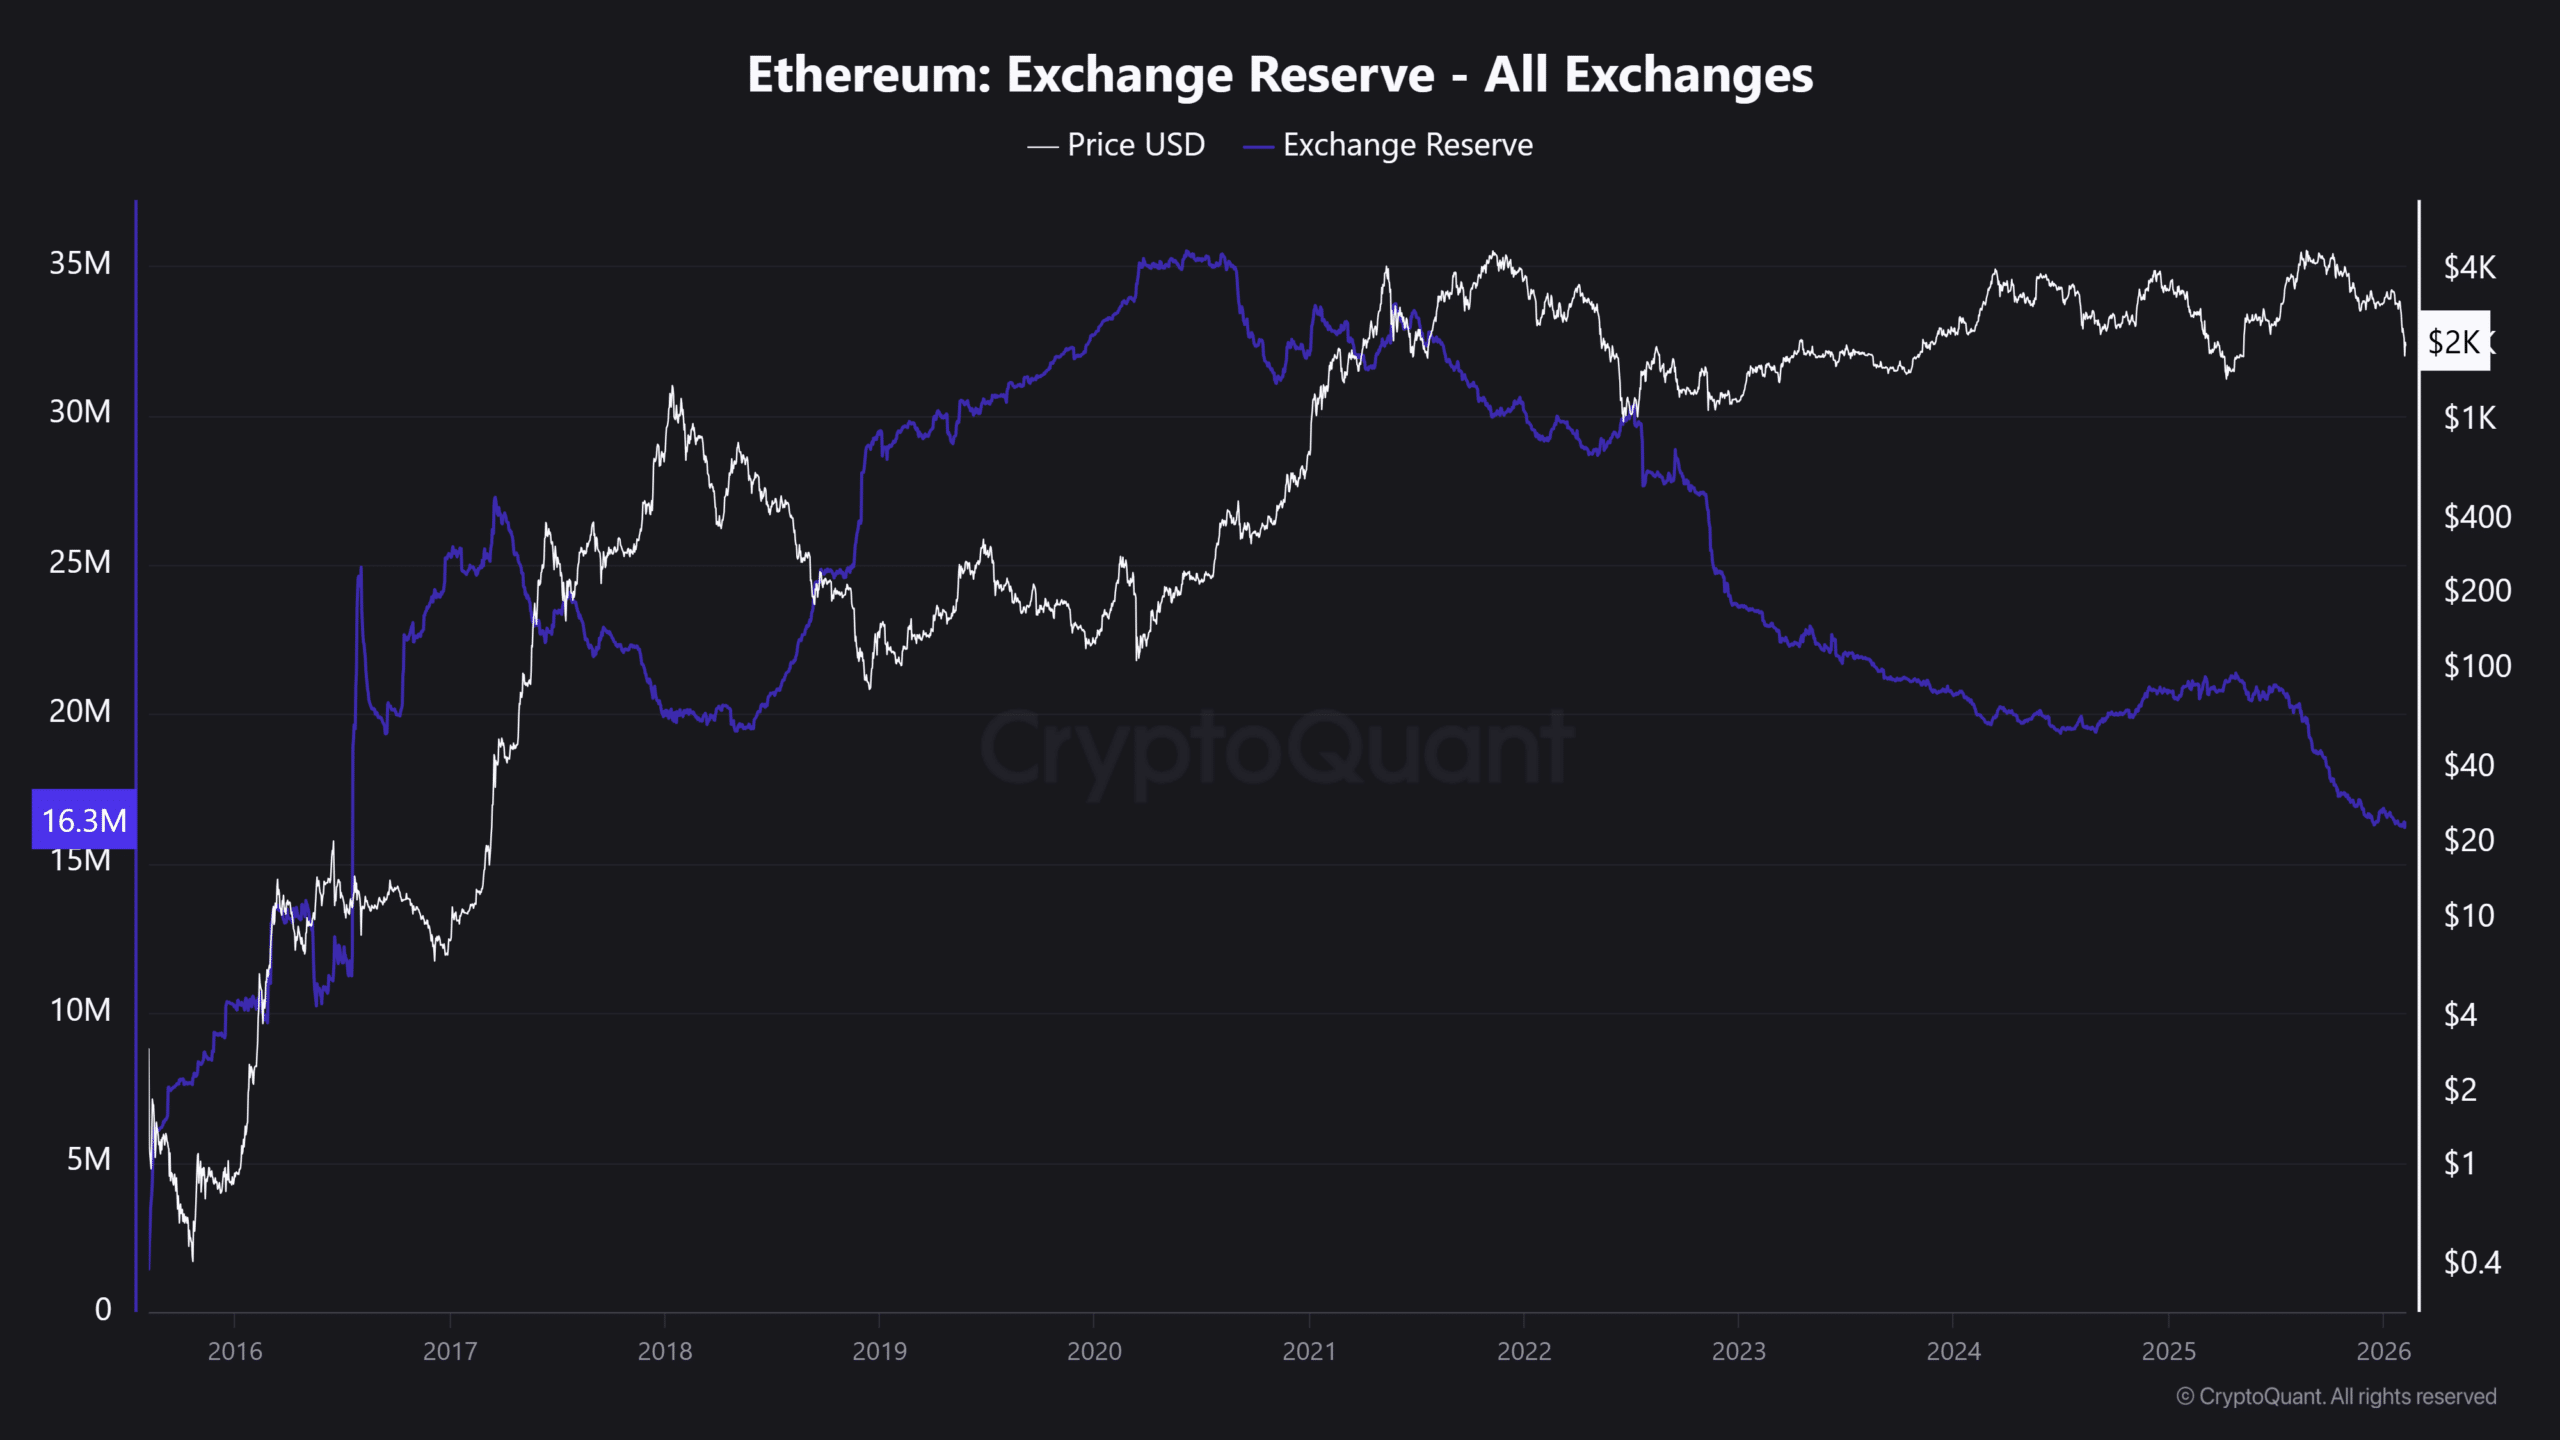
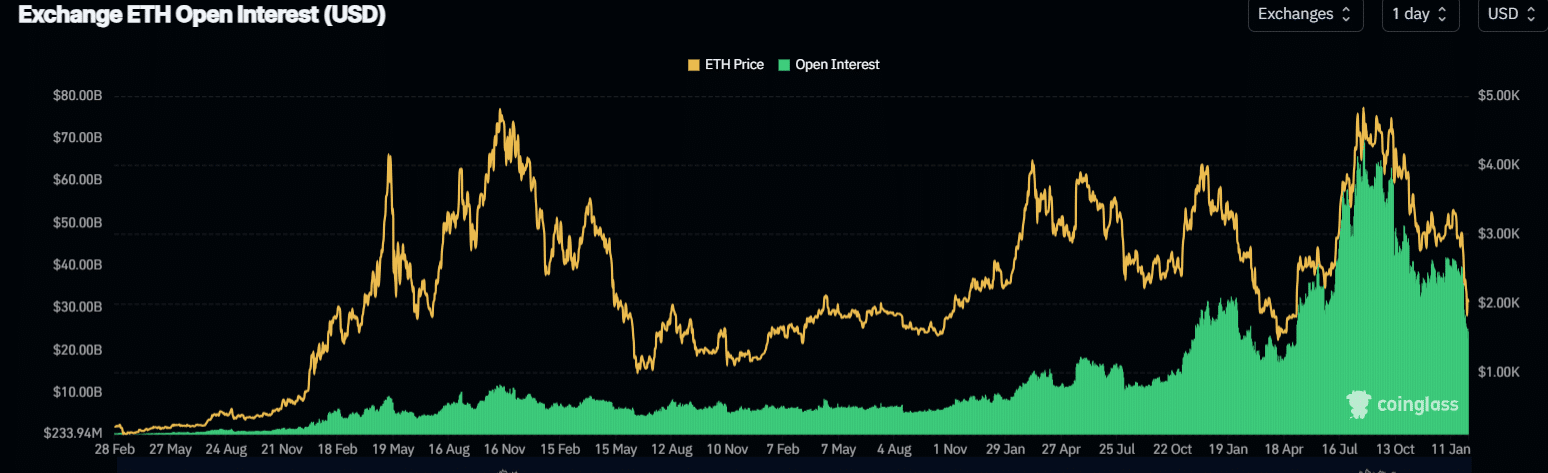
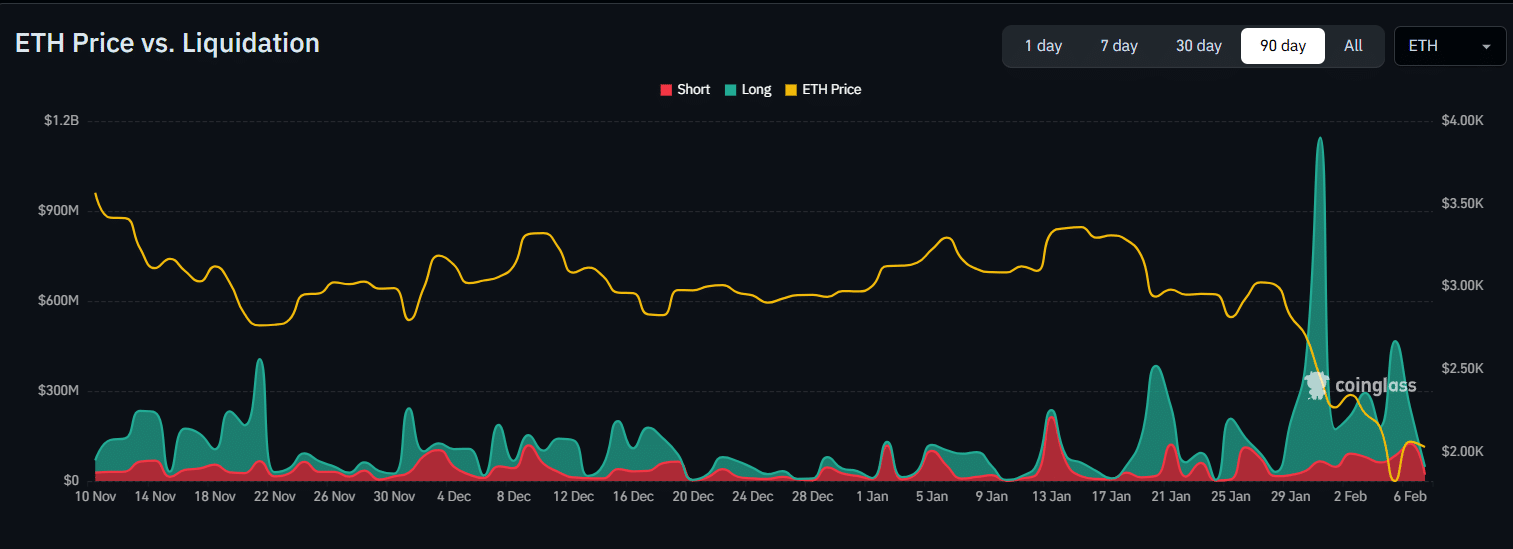
With Ethereum's exchange reserves hitting multi-year lows of 16.3 million ETH in early February 2026—levels not seen since 2016—the liquidity landscape is undergoing a structural shift. Large-scale withdrawals from exchanges like OKX and Binance suggest strategic accumulation by whales, likely capitalizing on ETH's dip near $2,050. This reduction in sell-side supply is easing selling pressure and may precede potential price rallies. Meanwhile, derivatives market reflects risk reduction rather than expansion, with open interest declining to the $24 billion–$36 billion range, negative rates, and over $1 billion in long liquidations during the crash. These factors, combined with growing institutional adoption post-ETF and increased staking activity, indicate a tightening circulating supply and reduced leverage, setting the stage for stronger recoveries once demand improves.
QWhat is the current state of Ethereum's exchange reserves as of early February 2026, and why is this significant?
AEthereum's exchange reserves hit 16.3 million ETH in early February 2026, marking multi-year lows last seen in 2016. This is significant because it indicates a structural tightening of tradable supply, which reduces immediate sell pressure and has historically preceded stronger price recoveries when demand conditions improve.
QHow did whale activity contribute to the shift in Ethereum's liquidity landscape?
AWhales initiated large Ethereum withdrawals from exchanges like OKX and Binance, capitalizing on ETH's dip near $2,050. This coordinated off-exchange migration suggests deliberate accumulation rather than routine transfers, absorbing supply while sentiment weakened and easing selling pressure.
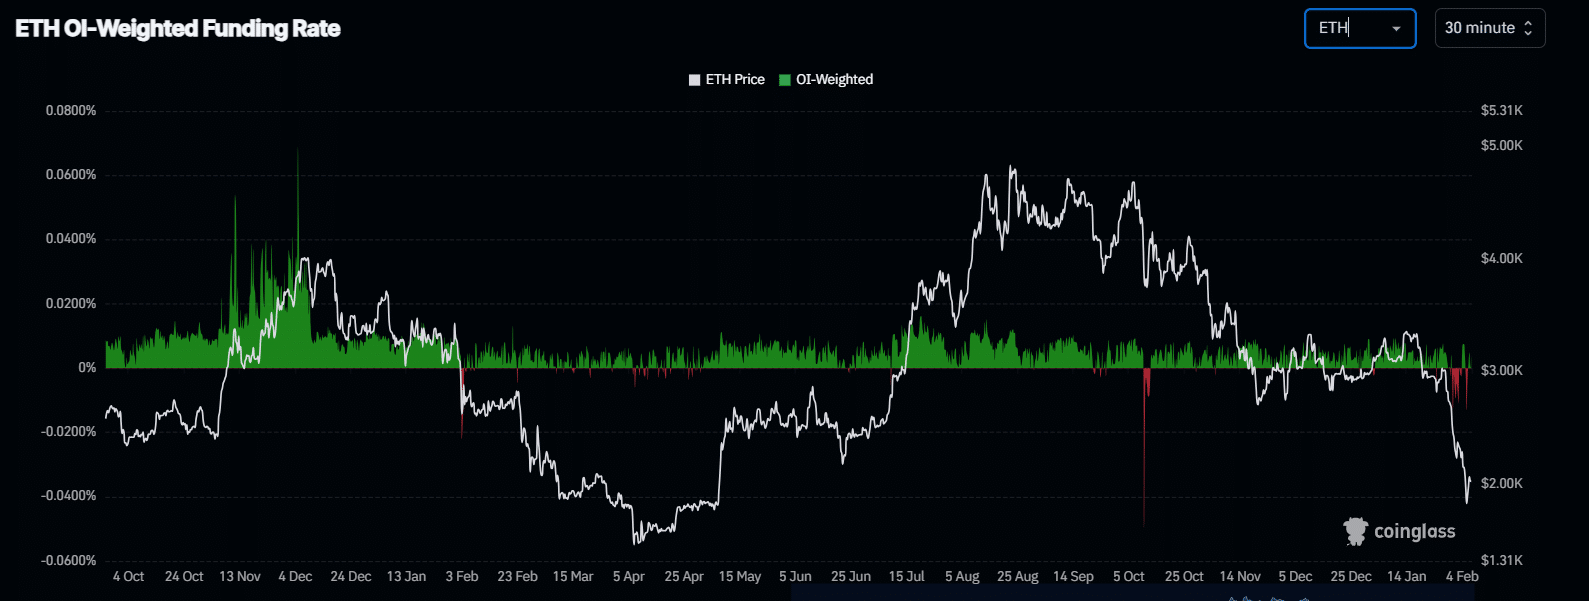
QWhat does the decline in Ethereum's derivatives market metrics, such as Open Interest and Funding Rates, indicate?
AThe decline in Open Interest (falling to the $24 billion–$36 billion range) and persistently negative Funding Rates (near -0.003%) reflect active deleveraging and dominant bearish positioning. This confirms that leverage has not offset spot compression, reinforcing medium-term squeeze potential despite near-term volatility.
QHow have staking and institutional adoption impacted Ethereum's circulating supply?
AStaking and off-exchange custody, accelerated by post-ETF institutional adoption in 2026, have absorbed ETH supply, tightening circulating inventory. This reduces tradable liquidity and anticipates deeper DeFi deployment, further compounding the supply contraction.
QWhat historical context is provided for Ethereum's exchange reserves, and how has the trend evolved?
AETH Exchange reserves expanded from 5–10 million ETH in 2016–2017 to a peak of nearly 35 million ETH during the 2020–2021 DeFi and NFT boom. A structural drawdown began in 2024–2025, intensifying as staking and off-exchange solutions gained dominance, leading to the multi-year lows in early 2026.
As a major evolution of Ethereum’s account system, AA is designed to address the fundamental security and experience bottlenecks of the “private key equals account” model in the EOA era.
1.8k Total ViewsPublished 2025.12.18Updated 2025.12.18
The privacy + payments narrative has been the primary catalyst driving rotation and substantial price gains in privacy coins such as DASH and XMR.
15.4k Total ViewsPublished 2026.01.20Updated 2026.01.20
ADA's Ouroboros Leios mainnet is expected to launch in 2026, and the hard fork to Protocol Version 11 is planned for Q1 2026.
11.4k Total ViewsPublished 2026.02.10Updated 2026.02.12