Bitcoin ETF Sees First Inflow in Three Weeks After Record $4.4 Billion Outflow Streak

marsbitPublished on 2026-06-15Last updated on 2026-06-15

Abstract

US Bitcoin spot ETFs experienced a record-breaking outflow streak, with a net withdrawal of $4.4 billion over 13 consecutive trading days from May 15 to June 3, more than doubling the previous record set in February 2025. This sell-off, led predominantly by BlackRock's IBIT, coincided with a Bitcoin price drop from above $80,000 to around $63,000, reducing total ETF assets under management from $104.3 billion to $82.8 billion. A potential turning point emerged on June 12, when the funds collectively recorded zero net outflows and a net inflow of $85.84 million. Geoff Kendrick of Standard Chartered cited this as one of three signals indicating Bitcoin may have reached a cycle bottom. While the single day's inflow is small relative to the preceding outflows, it marks a crucial shift in momentum. Analysts view the halt in sustained selling pressure as a key indicator, suggesting the recent downturn was a significant correction rather than a structural collapse for the ETF market.

Author: Claude, Shenchao TechFlow

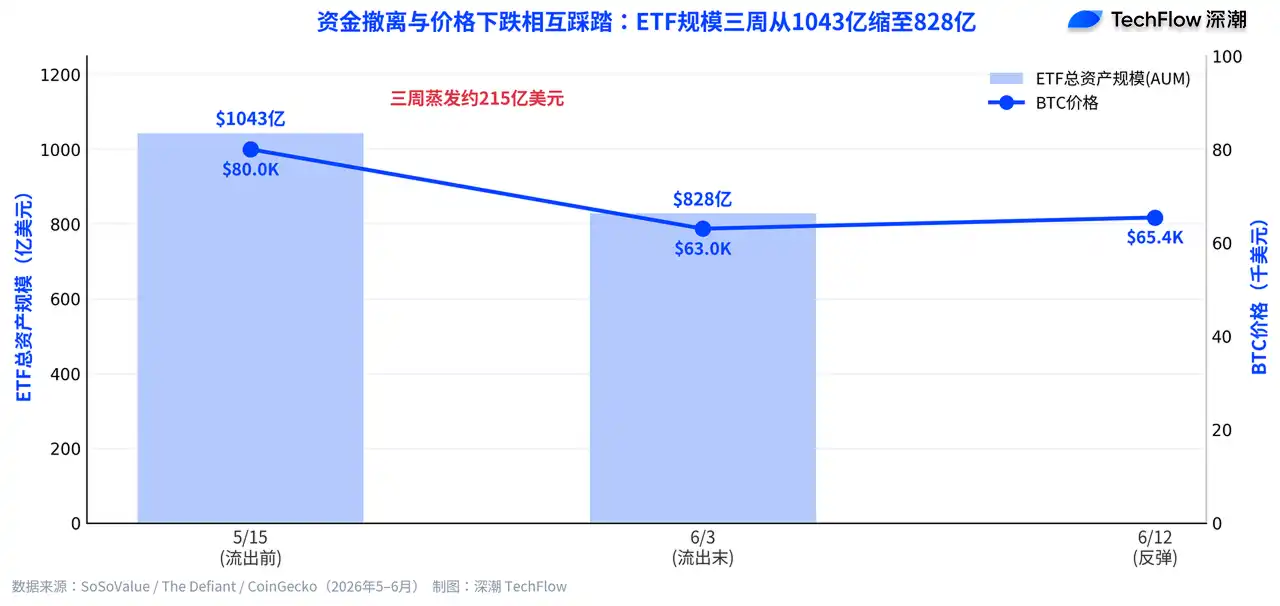
Shenchao Introduction: US spot Bitcoin ETFs have just weathered their most brutal withdrawal since listing: from May 15th to June 3rd, they experienced 13 consecutive trading days of net outflows, totaling $4.4 billion, more than double the old record set in February 2025. Combined with the drop in Bitcoin's price, the total assets under management (AUM) for these ETFs shrank from $104.3 billion to $82.8 billion over three weeks.

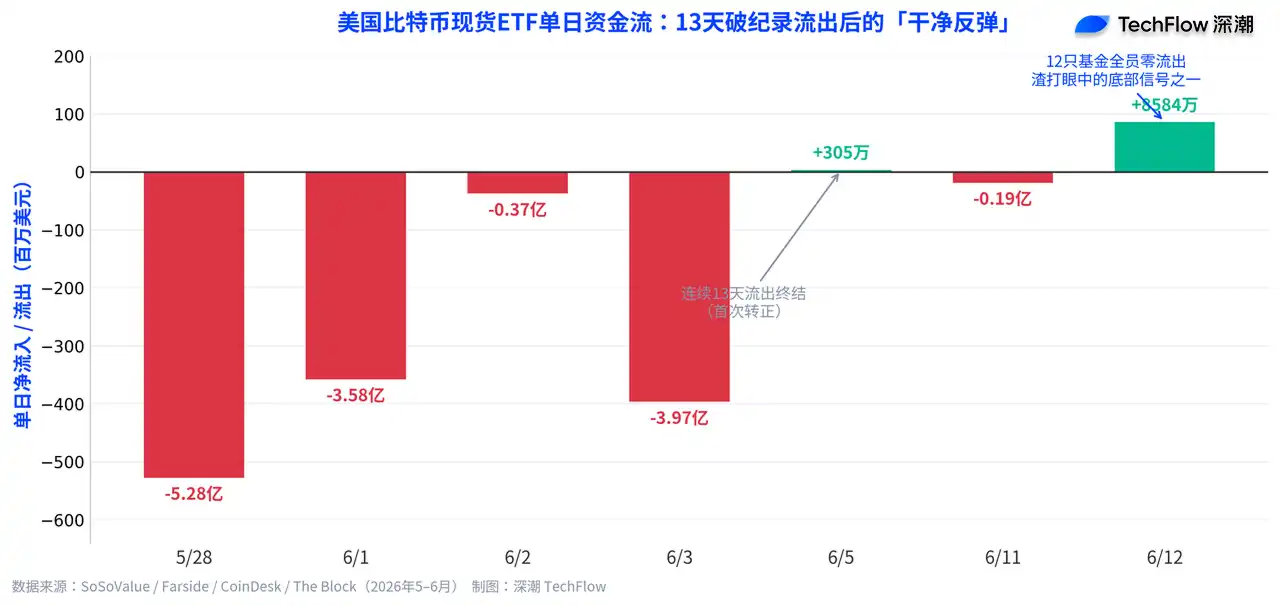
On June 12th, a turnaround signal emerged: all 12 funds saw zero outflows collectively, with a single-day net inflow of $85.84 million. Standard Chartered listed this signal as one of three pieces of evidence pointing to a Bitcoin price bottom.

13 Days, $4.4 Billion: Bitcoin ETFs End Longest Outflow Streak Since Listing

Measuring institutional sentiment towards Bitcoin, fund flows are the most direct yardstick.

These ETFs buy and sell spot Bitcoin in real-time based on investor subscriptions and redemptions. Money in and out directly corresponds to institutional position adjustments, free from the distortions of verbal statements.

Over the past month, this yardstick has revealed the worst numbers since their debut. According to Galaxy Research statistics, from May 15th to June 3rd, US spot Bitcoin ETFs saw net outflows for 13 consecutive trading days, accumulating approximately $4.37 billion, equivalent to about 59,000 BTC. This marks the longest continuous outflow streak since these products launched in January 2024. The previous record was 8 days and $3.2 billion in February 2025, a record this round more than doubled.

Galaxy Research also noted that outflow volumes across multiple time windows—7-day, 10-day, and 20-day—all hit historic highs during this period, indicating that selling pressure was not concentrated on a single day but persisted for a considerable duration. This round of withdrawals pushed the cumulative net inflows for 2026 into negative territory for the first time. Bloomberg ETF analyst Eric Balchunas confirmed that the year-to-date cumulative fund flows turned negative for the first time.

The most aggressive withdrawal came from BlackRock's IBIT. According to Farside Investors data, during the entire outflow period, IBIT alone saw outflows of about $3.3 billion, accounting for three-quarters of the total outflow. Fidelity's FBTC followed with outflows of approximately $456.6 million, and Grayscale's GBTC saw outflows of about $303.6 million. IBIT, the strongest fund in terms of attracting inflows since listing, became the epicenter of redemptions this time.

Capital Flight and Price Decline Mutually Reinforce, $21.5 Billion Evaporates in Three Weeks

The destructive force of the outflows was amplified by the simultaneous decline in Bitcoin's price.

According to The Defiant citing SoSoValue data, the total AUM of all US spot Bitcoin ETFs dropped from approximately $104.29 billion on May 15th to around $82.83 billion on June 3rd, shrinking by about $21.5 billion in three weeks. This decline stems from the combined effect of two forces: the redemptions themselves withdrawing capital, and Bitcoin's price falling from above $80,000 to around $63,000 during the same period—a drop of about 21%—causing the market value of holdings to shrink accordingly. The two factors exacerbated each other.

In terms of holdings, the ETFs' Bitcoin holdings fell to approximately 1.277 million BTC, about 7.2% lower than the peak in October 2025. These ETFs currently hold about 6.36% of Bitcoin's circulating market cap, down from over 7% in mid-May.

A particularly striking redemption occurred on May 28th. That day, BlackRock's IBIT saw a single-day net outflow of $527.8 million, the second-largest daily redemption in the fund's history. For the entire month of May, US Bitcoin ETFs recorded a monthly net outflow of $2.43 billion, setting a record for the largest monthly outflow, with the final week alone accounting for $1.42 billion.

A 'Clean Rebound' After the Outflow Ends, Standard Chartered Counts It as a Bottom Signal

The turning point arrived in early June.

On June 5th, Bitcoin ETFs ended the 13-day outflow streak with a meager net inflow of $3.05 million. While $3.05 million is almost negligible in a market of this size, the direction had changed. On the same day, Ethereum ETFs also ended a 17-day consecutive outflow streak, with a net inflow of $19.3 million, entirely from BlackRock's ETHA fund alone.

The signal truly regarded by institutions came on June 12th (Friday). According to SoSoValue data, US spot Bitcoin ETFs recorded a single-day net inflow of $85.84 million that day. Five funds saw inflows, while the other seven recorded zero net flow; none experienced net outflows. This state of "collective zero outflows" across all 12 products is a key indicator for bullish observers to gauge whether selling pressure has eased.

Geoff Kendrick, Global Head of Digital Assets Research at Standard Chartered, included it in his checklist for a Bitcoin bottom. In a brief report to clients on Friday, Kendrick stated that cryptocurrency asset prices have likely seen the low for this cycle, corresponding to a Bitcoin price around $59,000, down 53% from the $126,000 high. He said three indicators should be watched for confirmation: Strategy reportedly bought Bitcoin again last week, ETFs recorded positive inflows on Friday, and oil prices continue to decline. The report concluded with his words: "Winter is over, welcome back to crypto spring."

However, a single-day inflow of $85.84 million cannot reverse the $4.4 billion withdrawal over three weeks. But a clean trading day is the starting point for observing whether selling pressure has peaked.

ETF fund flows now exert increasing influence on Bitcoin's price. According to calculations cited by Cryptopolitan, ETF flows can currently explain about 45% of Bitcoin's weekly price volatility. The cumulative net inflows for this batch of Bitcoin ETFs since their January 2024 launch still exceed $55 billion, remaining less than $10 billion away from their historical peak. Balchunas therefore judges the $4.4 billion outflow as a significant momentum reversal, not a structural collapse.

Trending Cryptos

Related Questions

QAccording to the article, what was the most significant period of continuous net outflows for U.S. Bitcoin spot ETFs since their listing?

AThe most significant period was from May 15 to June 3, which saw 13 consecutive trading days of net outflows, totaling approximately $4.37 billion.

QWhich ETF was responsible for the largest share of outflows during the mentioned withdrawal period?

ABlackRock's iShares Bitcoin Trust (IBIT) was responsible for the largest share, accounting for about $3.3 billion or roughly three-quarters of the total outflows during that period.

QWhat key event on June 12, 2026, did Geoff Kendrick of Standard Chartered cite as one of the signs of a market bottom for Bitcoin?

AOn June 12, 2026, all 12 U.S. Bitcoin spot ETFs collectively recorded zero outflows, with a net daily inflow of $85.84 million. Geoff Kendrick cited this event as one of the three indicators confirming the market had reached a bottom.

QHow did the article describe the combined impact of ETF outflows and Bitcoin's price decline over the three weeks from May 15?

AThe article described it as a mutually reinforcing downward spiral. The combined impact of net redemptions and Bitcoin's price falling approximately 21% (from above $80,000 to around $63,000) caused the total assets of all U.S. Bitcoin spot ETFs to shrink by about $21.5 billion, from around $104.29 billion to $82.83 billion.

QWhat is the approximate explanatory power of ETF fund flows on Bitcoin's weekly price volatility according to the article?

AAccording to the article, citing a calculation, ETF fund flows can explain approximately 45% of Bitcoin's weekly price volatility.

Related Reads

Why Is the World Nervous About Japan Raising Interest Rates?

In June 2026, the Bank of Japan raised its policy rate to 1%, marking its first hike to this level since 1995. While this rate remains low compared to global peers like the US and Europe, the move signals a profound shift for a nation that has been a global source of ultra-cheap funding for decades. Japan's long-standing near-zero or negative interest rates had facilitated massive "yen carry trades," where international investors borrowed low-cost yen to invest in higher-yielding assets worldwide, such as US tech stocks and emerging market bonds. This made Japan a critical, often overlooked, source of global liquidity. Japan's ultra-loose policy stemmed from structural challenges post-1990s asset bubble: aging demographics, chronic low inflation/deflation, and high public debt. Recent shifts, including sustained wage growth (exceeding 5% in recent years) and inflation consistently above the 2% target, have created a "wage-price spiral" possibility, prompting the policy normalization. The global market's concern lies not in the absolute rate but in the potential unwinding of the yen carry trade. As Japanese borrowing costs rise, the economics of these leveraged global investments change, potentially triggering deleveraging and capital outflows from risk assets. Market anxiety focuses on the end of a thirty-year consensus that Japan would perpetually provide cheap funding. Ultimately, the global impact will depend on the interplay with US monetary policy. While Japan is tightening, the significant interest rate differential with the US remains. The key future dynamic is whether simultaneous Japanese hikes and eventual US rate cuts will narrow this gap, forcing a major recalibration of global capital flows and asset pricing built on an era of abundant, cheap yen liquidity.

marsbit5h ago

Why Is the World Nervous About Japan Raising Interest Rates?

marsbit5h ago

Trading

Spot
Futures

Hot Articles

What is $BITCOIN

DIGITAL GOLD ($BITCOIN): A Comprehensive Analysis Introduction to DIGITAL GOLD ($BITCOIN) DIGITAL GOLD ($BITCOIN) is a blockchain-based project operating on the Solana network, which aims to combine the characteristics of traditional precious metals with the innovation of decentralized technologies. While it shares a name with Bitcoin, often referred to as “digital gold” due to its perception as a store of value, DIGITAL GOLD is a separate token designed to create a unique ecosystem within the Web3 landscape. Its goal is to position itself as a viable alternative digital asset, although specifics regarding its applications and functionalities are still developing. What is DIGITAL GOLD ($BITCOIN)? DIGITAL GOLD ($BITCOIN) is a cryptocurrency token explicitly designed for use on the Solana blockchain. In contrast to Bitcoin, which provides a widely recognized value storage role, this token appears to focus on broader applications and characteristics. Notable aspects include: Blockchain Infrastructure: The token is built on the Solana blockchain, known for its capacity to handle high-speed and low-cost transactions. Supply Dynamics: DIGITAL GOLD has a maximum supply capped at 100 quadrillion tokens (100P $BITCOIN), although details regarding its circulating supply are currently undisclosed. Utility: While precise functionalities are not explicitly outlined, there are indications that the token could be utilized for various applications, potentially involving decentralized applications (dApps) or asset tokenization strategies. Who is the Creator of DIGITAL GOLD ($BITCOIN)? At present, the identity of the creators and development team behind DIGITAL GOLD ($BITCOIN) remains unknown. This situation is typical among many innovative projects within the blockchain space, particularly those aligning with decentralized finance and meme coin phenomena. While such anonymity may foster a community-driven culture, it intensifies concerns about governance and accountability. Who are the Investors of DIGITAL GOLD ($BITCOIN)? The available information indicates that DIGITAL GOLD ($BITCOIN) does not have any known institutional backers or prominent venture capital investments. The project seems to operate on a peer-to-peer model focused on community support and adoption rather than traditional funding routes. Its activity and liquidity are primarily situated on decentralized exchanges (DEXs), such as PumpSwap, rather than established centralized trading platforms, further highlighting its grassroots approach. How DIGITAL GOLD ($BITCOIN) Works The operational mechanics of DIGITAL GOLD ($BITCOIN) can be elaborated on based on its blockchain design and network attributes: Consensus Mechanism: By leveraging Solana’s unique proof-of-history (PoH) combined with a proof-of-stake (PoS) model, the project ensures efficient transaction validation contributing to the network's high performance. Tokenomics: While specific deflationary mechanisms have not been extensively detailed, the vast maximum token supply implies that it may cater to microtransactions or niche use cases that are still to be defined. Interoperability: There exists the potential for integration with Solana’s broader ecosystem, including various decentralized finance (DeFi) platforms. However, the details regarding specific integrations remain unspecified. Timeline of Key Events Here is a timeline that highlights significant milestones concerning DIGITAL GOLD ($BITCOIN): 2023: The initial deployment of the token occurs on the Solana blockchain, marked by its contract address. 2024: DIGITAL GOLD gains visibility as it becomes available for trading on decentralized exchanges like PumpSwap, allowing users to trade it against SOL. 2025: The project witnesses sporadic trading activity and potential interest in community-led engagements, although no noteworthy partnerships or technical advancements have been documented as of yet. Critical Analysis Strengths Scalability: The underlying Solana infrastructure supports high transaction volumes, which could enhance the utility of $BITCOIN in various transaction scenarios. Accessibility: The potential low trading price per token could attract retail investors, facilitating wider participation due to fractional ownership opportunities. Risks Lack of Transparency: The absence of publicly known backers, developers, or an audit process may yield skepticism regarding the project's sustainability and trustworthiness. Market Volatility: The trading activity is heavily reliant on speculative behavior, which can result in significant price volatility and uncertainty for investors. Conclusion DIGITAL GOLD ($BITCOIN) emerges as an intriguing yet ambiguous project within the rapidly evolving Solana ecosystem. While it attempts to leverage the “digital gold” narrative, its departure from Bitcoin's established role as a store of value underscores the need for a clearer differentiation of its intended utility and governance structure. Future acceptance and adoption will likely depend on addressing the current opacity and defining its operational and economic strategies more explicitly. Note: This report encompasses synthesised information available as of October 2023, and developments may have transpired beyond the research period.

382 Total ViewsPublished 2025.05.13Updated 2025.05.13

What is $BITCOIN

Discussions

Welcome to the HTX Community. Here, you can stay informed about the latest platform developments and gain access to professional market insights. Users' opinions on the price of BTC (BTC) are presented below.

活动图片